In the fast-evolving semiconductor industry, Qnity Electronics, Inc. and CEVA, Inc. stand out with their innovative approaches to advanced electronic materials and smart sensing technologies. Both companies serve critical roles in powering next-generation devices, with overlapping markets in semiconductor solutions and AI-driven platforms. This article will dissect their strengths and risks to help you decide which company holds the most promise for your investment portfolio.
Table of contents
Companies Overview
I will begin the comparison between Qnity Electronics, Inc. and CEVA, Inc. by providing an overview of these two companies and their main differences.
Qnity Electronics, Inc. Overview
Qnity Electronics, Inc. specializes in providing electronic solutions and materials used in semiconductor chip manufacturing and advanced electronic materials. The company, formerly known as Novus SpinCo 1, Inc., rebranded in April 2025 and is headquartered in Wilmington, Delaware. It operates within the technology sector, focusing on semiconductors, and recently went public in October 2025 with a market cap of approximately 19.5B USD.
CEVA, Inc. Overview
CEVA, Inc. is a licensor of wireless connectivity and smart sensing technologies, including digital signal processors, AI processors, and wireless platforms for use in mobile, IoT, and other sectors. Founded in 1999 and based in Rockville, Maryland, CEVA licenses its technology to semiconductor and OEM companies globally. With a market cap near 536M USD, CEVA employs around 406 full-time staff and trades on NASDAQ.
Key similarities and differences
Both companies operate in the semiconductor industry within the technology sector and provide essential components for electronic and connected devices. However, Qnity focuses on materials and solutions for chip manufacturing, while CEVA specializes in licensing IP for wireless connectivity, AI, and sensing technologies. Qnity is a newer public company with a significantly larger market capitalization compared to CEVA, which has a longer operational history and a smaller workforce.
Income Statement Comparison
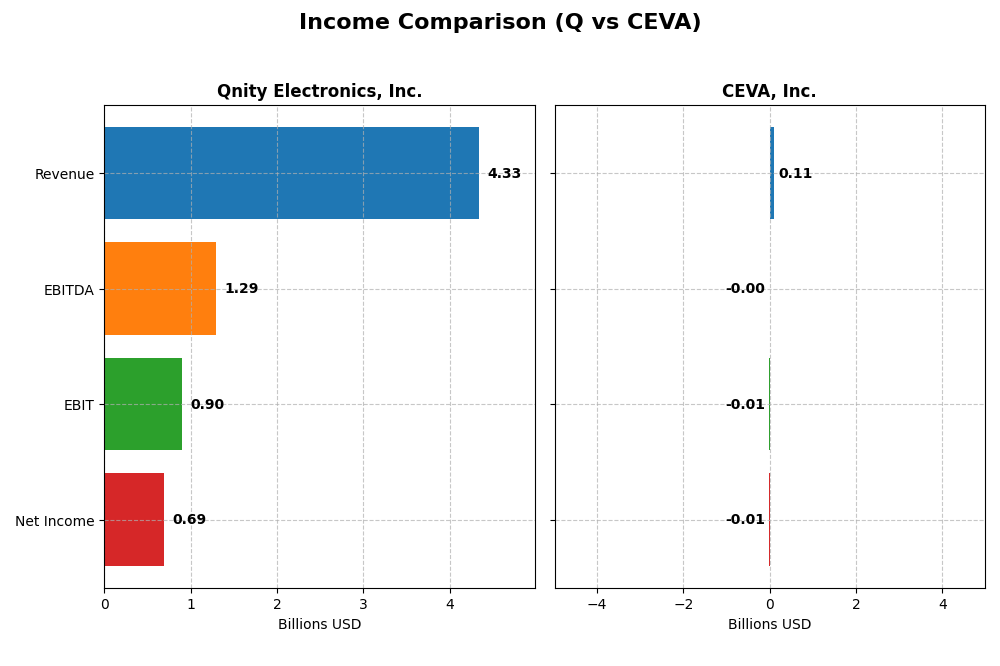
This table compares the key income statement metrics for Qnity Electronics, Inc. and CEVA, Inc. for the fiscal year 2024, providing a clear overview of their financial performance.
| Metric | Qnity Electronics, Inc. | CEVA, Inc. |
|---|---|---|
| Market Cap | 19.5B | 536M |
| Revenue | 4.34B | 107M |
| EBITDA | 1.29B | -3.41M |
| EBIT | 898M | -7.55M |
| Net Income | 693M | -8.79M |
| EPS | 3.31 | -0.37 |
| Fiscal Year | 2024 | 2024 |
Income Statement Interpretations
Qnity Electronics, Inc.
From 2022 to 2024, Qnity Electronics experienced a declining revenue trend, from $4.76B down to $4.34B in 2024, alongside a net income decrease from $774M to $693M. Margins showed some stability with a favorable gross margin around 46% and net margin near 16%. The latest year marked slower revenue growth but improved EBIT and net margin growth, signaling operational efficiency.
CEVA, Inc.
CEVA’s revenues fluctuated moderately over 2020–2024, with $107M in 2024 up from $100M in 2020, and net income remained negative but improved to a loss of $8.8M in 2024 from a larger loss previously. Despite a high gross margin above 88%, EBIT and net margins stayed negative, though both showed favorable improvement in 2024, reflecting progress in cost management and profitability.
Which one has the stronger fundamentals?
Qnity Electronics exhibits stronger fundamentals with consistently positive net income and stable margins, despite some revenue pressure. CEVA shows high gross profitability but persistent net losses and negative margins, though recent improvement is noted. Overall, Qnity’s scale, profitability, and margin stability present a more favorable income statement profile compared to CEVA’s ongoing challenges.
Financial Ratios Comparison
The table below presents the key financial ratios for Qnity Electronics, Inc. (Q) and CEVA, Inc. (CEVA) based on their most recent fiscal year data, allowing for a side-by-side comparison.
| Ratios | Qnity Electronics, Inc. (Q) | CEVA, Inc. (CEVA) |
|---|---|---|
| ROE | 6.51% | -3.30% |
| ROIC | 5.92% | -2.68% |
| P/E | 28.8 | -84.79 |
| P/B | 1.88 | 2.79 |
| Current Ratio | 1.77 | 7.09 |
| Quick Ratio | 1.06 | 7.09 |
| D/E | 0.018 | 0.021 |
| Debt-to-Assets | 1.56% | 1.80% |
| Interest Coverage | 3.03 | 0 |
| Asset Turnover | 0.35 | 0.35 |
| Fixed Asset Turnover | 2.59 | 8.43 |
| Payout ratio | 0% | 0% |
| Dividend yield | 0% | 0% |
Interpretation of the Ratios
Qnity Electronics, Inc.
Qnity Electronics shows a mix of strengths and weaknesses in its financial ratios. The company benefits from a favorable net margin and solid liquidity ratios, such as a current ratio of 1.77. However, concerns arise from a relatively low return on equity (6.51%) and an elevated price-to-earnings ratio of 28.8. Qnity pays dividends, but with a low last dividend of $0.06, the dividend yield is minimal, suggesting limited shareholder income from dividends.
CEVA, Inc.
CEVA’s financial ratios indicate challenges, with unfavorable net margin (-8.22%), return on equity (-3.3%), and return on invested capital (-2.68%). Despite a strong quick ratio of 7.09 and low debt levels, the company’s negative earnings and zero dividend payout reflect ongoing losses or reinvestment priorities. CEVA does not pay dividends, likely due to its current unprofitable status and focus on growth and R&D.
Which one has the best ratios?
Qnity Electronics presents a slightly favorable overall ratio profile with stronger profitability and liquidity metrics, while CEVA’s ratios largely remain unfavorable, reflecting financial strain and lack of profitability. Qnity’s dividend payments, though modest, contrast with CEVA’s lack of returns to shareholders. Thus, Qnity holds the more stable financial ratio standing between the two.
Strategic Positioning
This section compares the strategic positioning of Qnity Electronics, Inc. and CEVA, Inc. regarding Market position, Key segments, and disruption:
Qnity Electronics, Inc.
- Market position and competitive pressure
- Key segments and business drivers
- Exposure to technological disruption
CEVA, Inc.
- Large market cap of $19.5B, focused on semiconductor materials and chip manufacturing solutions, stable profitability.
- Concentrated on electronic solutions and advanced materials for semiconductor chip manufacturing.
- Positioned in semiconductor materials, potentially stable with no explicit disruption noted.
Qnity Electronics, Inc. vs CEVA, Inc. Positioning
Qnity maintains a concentrated focus on semiconductor materials with stable profitability, while CEVA operates a diversified licensing model across multiple wireless and AI segments but faces declining returns and profitability challenges.
Which has the best competitive advantage?
Qnity holds a neutral moat with stable profitability, whereas CEVA shows a very unfavorable moat with declining ROIC, indicating Qnity has a stronger competitive position based on MOAT evaluation.
Stock Comparison
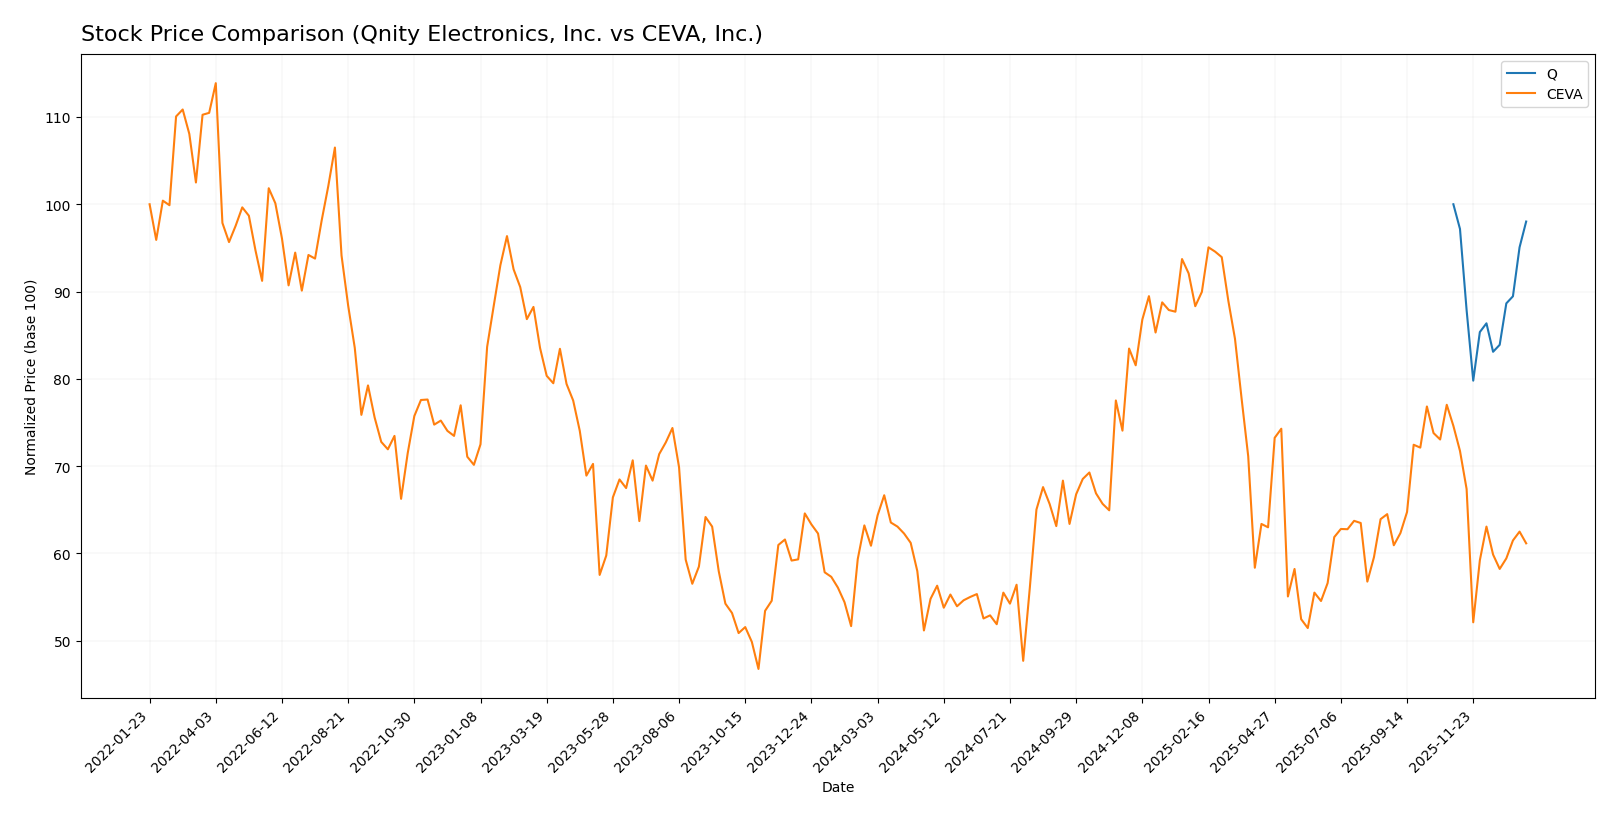
The stock prices of Qnity Electronics, Inc. and CEVA, Inc. exhibited contrasting dynamics over the past year, with Qnity Electronics showing a slight bearish trend while CEVA’s overall movement was mildly bullish despite recent weakness.
Trend Analysis
Qnity Electronics, Inc. experienced a -1.98% price change over the past 12 months, indicating a neutral to slightly bearish trend with stable acceleration. The stock traded between 75.8 and 95.0, showing moderate volatility with a 5.94 standard deviation.
CEVA, Inc. recorded a 0.45% price increase over the same period, classifying as a bullish trend but with deceleration. The price ranged from 17.39 to 34.67, with a lower volatility of 4.4 standard deviation. Recent months showed a sharp decline of -18.04%.
Comparatively, CEVA delivered the highest market performance over the year with a positive overall price change, while Qnity Electronics remained nearly flat with a slight negative drift.
Target Prices
Analysts present a clear target price consensus for Qnity Electronics, Inc. and CEVA, Inc.
| Company | Target High | Target Low | Consensus |
|---|---|---|---|
| Qnity Electronics, Inc. | 117 | 92 | 105.89 |
| CEVA, Inc. | 28 | 28 | 28 |
The target consensus for Qnity Electronics suggests upside potential from the current price of 93.12 USD, while CEVA’s consensus target of 28 USD indicates a significant premium over the present 22.3 USD stock price. Overall, analysts expect moderate to strong appreciation.
Analyst Opinions Comparison
This section compares analysts’ ratings and grades for Qnity Electronics, Inc. (Q) and CEVA, Inc. (CEVA):
Rating Comparison
Q Rating
- Rating: B+ indicating a very favorable overall evaluation.
- Discounted Cash Flow Score: 4, showing favorable future cash flow projections.
- ROE Score: 3, reflecting moderate efficiency in generating profits from equity.
- ROA Score: 4, favorable utilization of assets to generate earnings.
- Debt To Equity Score: 3, moderate financial risk with manageable debt levels.
- Overall Score: 3, indicating a moderate overall financial standing.
CEVA Rating
- Rating: C+ with a very favorable status despite lower scores.
- Discounted Cash Flow Score: 3, a moderate assessment of future cash flows.
- ROE Score: 1, very unfavorable efficiency in profit generation from equity.
- ROA Score: 1, very unfavorable asset utilization for earnings.
- Debt To Equity Score: 4, favorable indication of low financial leverage risk.
- Overall Score: 2, showing a moderate but lower overall financial standing.
Which one is the best rated?
Based strictly on the data, Q holds a better overall rating (B+) and stronger scores in discounted cash flow, ROE, and ROA. CEVA has a lower rating (C+) and weaker profitability scores but a stronger debt-to-equity score. Overall, Q is better rated.
Scores Comparison
The following table compares the Altman Z-Score and Piotroski Score for the two companies:
Q Scores
- No available data on Altman Z-Score
- No available data on Piotroski Score
CEVA Scores
- Altman Z-Score is 9.99, indicating a safe financial zone.
- Piotroski Score is 4, reflecting average financial strength.
Which company has the best scores?
Based on the provided data, CEVA has measurable scores showing strong financial stability (Altman Z-Score 9.99) and average financial health (Piotroski 4). No score data is available for Q, so no direct comparison can be made.
Grades Comparison
Here is the comparison of recent grades and ratings for Qnity Electronics, Inc. and CEVA, Inc.:
Qnity Electronics, Inc. Grades
The table below summarizes the latest grades issued by reputable grading companies for Qnity Electronics, Inc.:
| Grading Company | Action | New Grade | Date |
|---|---|---|---|
| RBC Capital | Maintain | Outperform | 2025-11-25 |
| Mizuho | Maintain | Outperform | 2025-11-20 |
Qnity Electronics, Inc. has consistently received an “Outperform” rating from its grading companies, indicating a positive outlook without recent changes.
CEVA, Inc. Grades
The table below shows the most recent grades assigned by recognized grading firms for CEVA, Inc.:
| Grading Company | Action | New Grade | Date |
|---|---|---|---|
| Barclays | Maintain | Overweight | 2025-11-12 |
| Rosenblatt | Maintain | Buy | 2025-11-11 |
| Rosenblatt | Maintain | Buy | 2025-08-14 |
| Oppenheimer | Maintain | Outperform | 2025-05-09 |
| Rosenblatt | Maintain | Buy | 2025-05-08 |
| Barclays | Maintain | Overweight | 2025-05-08 |
| Rosenblatt | Maintain | Buy | 2025-04-23 |
| Barclays | Maintain | Overweight | 2025-02-14 |
| Rosenblatt | Maintain | Buy | 2025-02-14 |
| Rosenblatt | Maintain | Buy | 2025-02-11 |
CEVA, Inc. maintains mostly “Buy” and “Overweight” grades, reflecting steady confidence from multiple grading companies.
Which company has the best grades?
Both Qnity Electronics and CEVA, Inc. have received positive grades, but CEVA has a larger volume of “Buy” and “Overweight” ratings from various reputable firms, while Qnity Electronics holds consistent “Outperform” grades from two sources. Investors may interpret CEVA’s broader support as more widespread analyst confidence, whereas Qnity’s grades suggest focused but strong endorsement.
Strengths and Weaknesses
Below is a comparative table highlighting the key strengths and weaknesses of Qnity Electronics, Inc. (Q) and CEVA, Inc. (CEVA) based on the most recent financial and operational data.
| Criterion | Qnity Electronics, Inc. (Q) | CEVA, Inc. (CEVA) |
|---|---|---|
| Diversification | Moderate product focus, limited diversification | Diversified revenue streams from licenses and royalties |
| Profitability | Positive net margin (16%), stable ROIC (~6%) | Negative net margin (-8%) and declining ROIC |
| Innovation | Neutral ROIC trend, stable but no strong moat | Declining ROIC trend signals weakening innovation impact |
| Global presence | Stable with favorable liquidity and low debt | Strong liquidity but profitability issues limit expansion potential |
| Market Share | Stable but no significant growth in asset turnover | Declining market profitability despite increasing license revenue |
Key takeaway: Qnity Electronics maintains stable profitability and financial health with a neutral competitive advantage, making it a cautiously favorable investment. CEVA faces significant profitability challenges and a declining economic moat, signaling high risk despite diversified licensing revenue. Investors should weigh stability against growth risks carefully.
Risk Analysis
Below is a comparative overview of key risks faced by Qnity Electronics, Inc. (Q) and CEVA, Inc. (CEVA) as of 2026:
| Metric | Qnity Electronics, Inc. (Q) | CEVA, Inc. (CEVA) |
|---|---|---|
| Market Risk | Moderate (Beta 0, stable demand in semiconductors) | High (Beta 1.436, volatile pricing) |
| Debt level | Very Low (D/E 0.02, Debt to assets 1.56%) | Very Low (D/E 0.02, Debt to assets 1.8%) |
| Regulatory Risk | Moderate (US tech sector regulations) | Moderate (US tech and IP licensing regulations) |
| Operational Risk | Moderate (Newly rebranded, growth phase) | Elevated (Negative margins, operational losses) |
| Environmental Risk | Low (Tech manufacturing footprint, industry standards) | Low (IP licensing model, low physical footprint) |
| Geopolitical Risk | Moderate (US-based, sensitive to global chip supply) | Moderate (Global client base, supply chain exposure) |
Q faces moderate market risk with a stable beta of 0, indicating low stock price volatility, and very low debt, which reduces financial risk. Its operational risk is moderate given its recent IPO and rebranding in 2025. CEVA shows higher market risk due to a beta of 1.436 and struggles with negative profitability, increasing operational risk. Both companies have low debt levels, but CEVA’s negative margins and interest coverage of zero highlight financial vulnerability. Geopolitical and regulatory risks remain moderate for both, given their US base and semiconductor industry exposure. The most impactful risks are CEVA’s operational losses and market volatility, which investors should monitor closely.
Which Stock to Choose?
Qnity Electronics, Inc. has shown a favorable income statement with a 15.99% net margin and positive income growth over the last year. Its financial ratios are slightly favorable overall, with low debt and a strong current ratio, though return on equity remains modest. The company’s rating is very favorable with a B+ score, indicating moderate financial strength.
CEVA, Inc. presents a mixed financial picture: despite a high gross margin of 88.06%, it suffers from negative net margin and declining profitability. Financial ratios are mostly unfavorable, with high operating leverage and weak returns. The company holds a C+ rating, reflecting moderate overall strength but considerable financial challenges and value erosion.
For investors, Qnity Electronics may appear more stable with favorable profitability and a solid rating, which could suit those prioritizing quality and moderate risk. CEVA’s profile, marked by higher volatility and weaker returns, might be interpreted as more suitable for risk-tolerant investors seeking potential growth despite current challenges.
Disclaimer: Investment carries a risk of loss of initial capital. The past performance is not a reliable indicator of future results. Be sure to understand risks before making an investment decision.
Go Further
I encourage you to read the complete analyses of Qnity Electronics, Inc. and CEVA, Inc. to enhance your investment decisions: