In the fast-evolving semiconductor industry, Onto Innovation Inc. and CEVA, Inc. stand out for their distinct yet overlapping roles in advancing technology. Onto focuses on process control and defect inspection tools, while CEVA specializes in licensing wireless connectivity and AI processing technologies. Comparing these innovators sheds light on their market positions and growth potential. Join me as we explore which company offers the most compelling opportunity for investors today.
Table of contents
Companies Overview
I will begin the comparison between Onto Innovation Inc. and CEVA, Inc. by providing an overview of these two companies and their main differences.
Onto Innovation Inc. Overview
Onto Innovation Inc. specializes in designing, developing, manufacturing, and supporting process control tools used in semiconductor and advanced packaging industries. The company offers solutions for macro defect inspection, 2D/3D optical metrology, lithography systems, and process control software. Founded in 1940 and headquartered in Wilmington, Massachusetts, Onto Innovation serves a diverse range of applications including LEDs, MEMS, CMOS sensors, and RF filters.
CEVA, Inc. Overview
CEVA, Inc. operates as a licensor of wireless connectivity and smart sensing technologies, providing digital signal processors, AI processors, and wireless platforms to semiconductor and OEM companies. Headquartered in Rockville, Maryland, CEVA licenses technologies for 5G, imaging, computer vision, voice input, and IoT applications. Established in 1999, the company supports markets including mobile, automotive, robotics, and aerospace with software and hardware IP solutions.
Key similarities and differences
Both Onto Innovation and CEVA operate in the semiconductor sector, focusing on advanced technology solutions. Onto Innovation primarily manufactures process control and inspection tools, while CEVA licenses IP cores and platforms for wireless communication and AI processing. Onto Innovation’s business is product and service-based, supporting manufacturing processes, whereas CEVA’s model centers on licensing technology to third-party chipmakers and OEMs, emphasizing software and IP development.
Income Statement Comparison
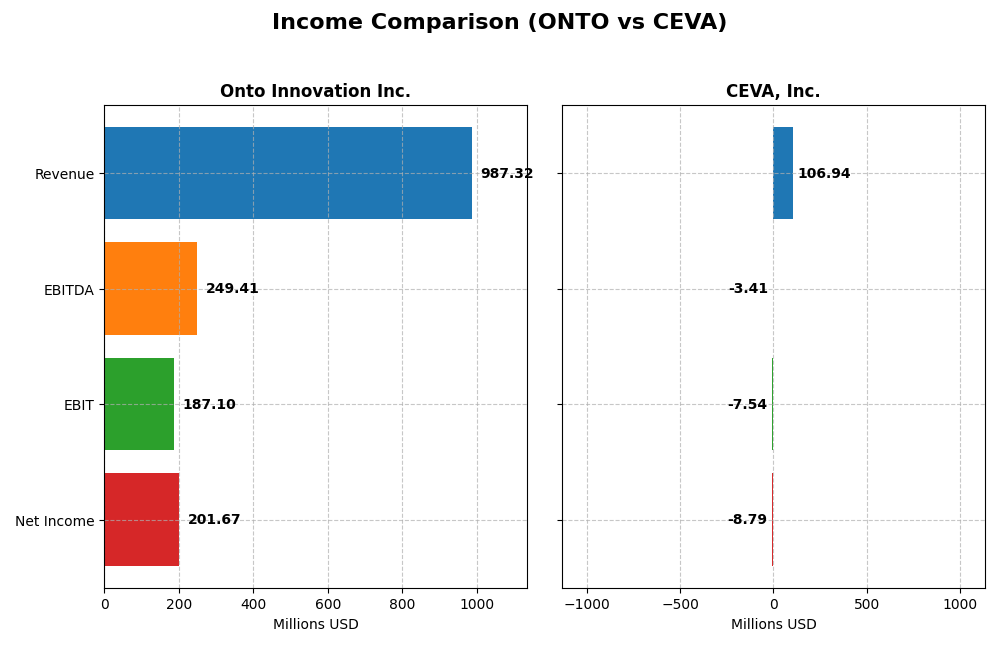
The table below presents a side-by-side comparison of the key income statement metrics for Onto Innovation Inc. and CEVA, Inc. for the fiscal year 2024, providing insight into their financial performance within the semiconductor industry.
| Metric | Onto Innovation Inc. | CEVA, Inc. |
|---|---|---|
| Market Cap | 10.7B | 536M |
| Revenue | 987M | 107M |
| EBITDA | 249M | -3.4M |
| EBIT | 187M | -7.5M |
| Net Income | 202M | -8.8M |
| EPS | 4.09 | -0.37 |
| Fiscal Year | 2024 | 2024 |
Income Statement Interpretations
Onto Innovation Inc.
Onto Innovation Inc. showed a consistent upward trend in revenue and net income from 2020 to 2024, with revenue growing 77.42% and net income surging 550.02%. Margins improved significantly, highlighted by a gross margin of 52.19% and a net margin rising to 20.43% in 2024. The latest year saw strong growth acceleration, with net income up 37.55% and EPS up 65.04%, reflecting improved operational efficiency.
CEVA, Inc.
CEVA, Inc. experienced modest revenue growth of 6.59% over the period 2020-2024, with a 9.77% increase in 2024 alone. However, net income declined substantially overall by 269.31%, despite a recent net margin improvement of 32.62% in 2024. Gross margin remains high at 88.06%, but EBIT and net margins stayed negative in 2024, indicating ongoing profitability challenges despite some operational progress.
Which one has the stronger fundamentals?
Onto Innovation Inc. demonstrates stronger fundamentals with robust revenue and net income growth, expanding margins, and consistent profitability. CEVA, Inc. shows a stable gross margin but struggles with negative EBIT and net margins overall. While CEVA improved recently, its long-term net income and margin declines contrast with Onto’s favorable, sustained financial performance and margin expansion.
Financial Ratios Comparison
The table below provides a side-by-side comparison of key financial ratios for Onto Innovation Inc. and CEVA, Inc. based on their most recent fiscal year data from 2024.
| Ratios | Onto Innovation Inc. (ONTO) | CEVA, Inc. (CEVA) |
|---|---|---|
| ROE | 10.5% | -3.3% |
| ROIC | 8.8% | -2.7% |
| P/E | 41.8 | -84.8 |
| P/B | 4.37 | 2.79 |
| Current Ratio | 8.69 | 7.09 |
| Quick Ratio | 7.00 | 7.09 |
| D/E (Debt-to-Equity) | 0.008 | 0.021 |
| Debt-to-Assets | 0.7% | 1.8% |
| Interest Coverage | 0 | 0 |
| Asset Turnover | 0.47 | 0.35 |
| Fixed Asset Turnover | 7.16 | 8.43 |
| Payout Ratio | 0% | 0% |
| Dividend Yield | 0% | 0% |
Interpretation of the Ratios
Onto Innovation Inc.
Onto Innovation shows a balanced profile with 43% favorable and 43% unfavorable ratios, resulting in a neutral overall evaluation. Its net margin is strong at 20.43%, but valuation metrics like PE at 41.76 and PB at 4.37 are less attractive. The company does not pay dividends, indicating possible reinvestment for growth or operational focus.
CEVA, Inc.
CEVA’s ratios are mostly unfavorable, with 57% negative and only 36% positive, leading to an unfavorable assessment. Negative net margin (-8.22%) and ROE (-3.3%) signal profitability challenges, while valuation metrics are mixed. CEVA also pays no dividends, likely due to negative income and prioritizing R&D and acquisitions for future growth.
Which one has the best ratios?
Comparing the two, Onto Innovation holds a more balanced ratio profile with stronger profitability indicators and a neutral global opinion. CEVA faces significant profitability weaknesses and a less favorable ratio mix, resulting in an overall unfavorable evaluation. Onto Innovation’s ratios appear comparatively more robust in 2024.
Strategic Positioning
This section compares the strategic positioning of Onto Innovation Inc. and CEVA, Inc., focusing on Market position, Key segments, and exposure to technological disruption:
Onto Innovation Inc.
- Leading player in semiconductor process control tools with moderate competitive pressure
- Key segments include systems/software for inspection, metrology, lithography, and services
- Operates in mature semiconductor process control with limited disruption risk
CEVA, Inc.
- Smaller market cap licensor in wireless connectivity and smart sensing technologies
- Focused on licensing DSP, AI processors, wireless platforms, and sensor fusion software
- Faces disruption risks from rapid AI and wireless technology evolution impacting licensing model
Onto Innovation Inc. vs CEVA, Inc. Positioning
Onto Innovation shows a diversified product portfolio in semiconductor manufacturing tools, while CEVA concentrates on licensing connectivity and AI-driven IP. Onto’s broad offerings may provide stability, whereas CEVA’s niche focus depends heavily on technology adoption cycles.
Which has the best competitive advantage?
Onto Innovation exhibits a slightly unfavorable moat with improving profitability, while CEVA displays a very unfavorable moat with declining returns, indicating Onto currently maintains a stronger competitive advantage based on MOAT evaluation.
Stock Comparison
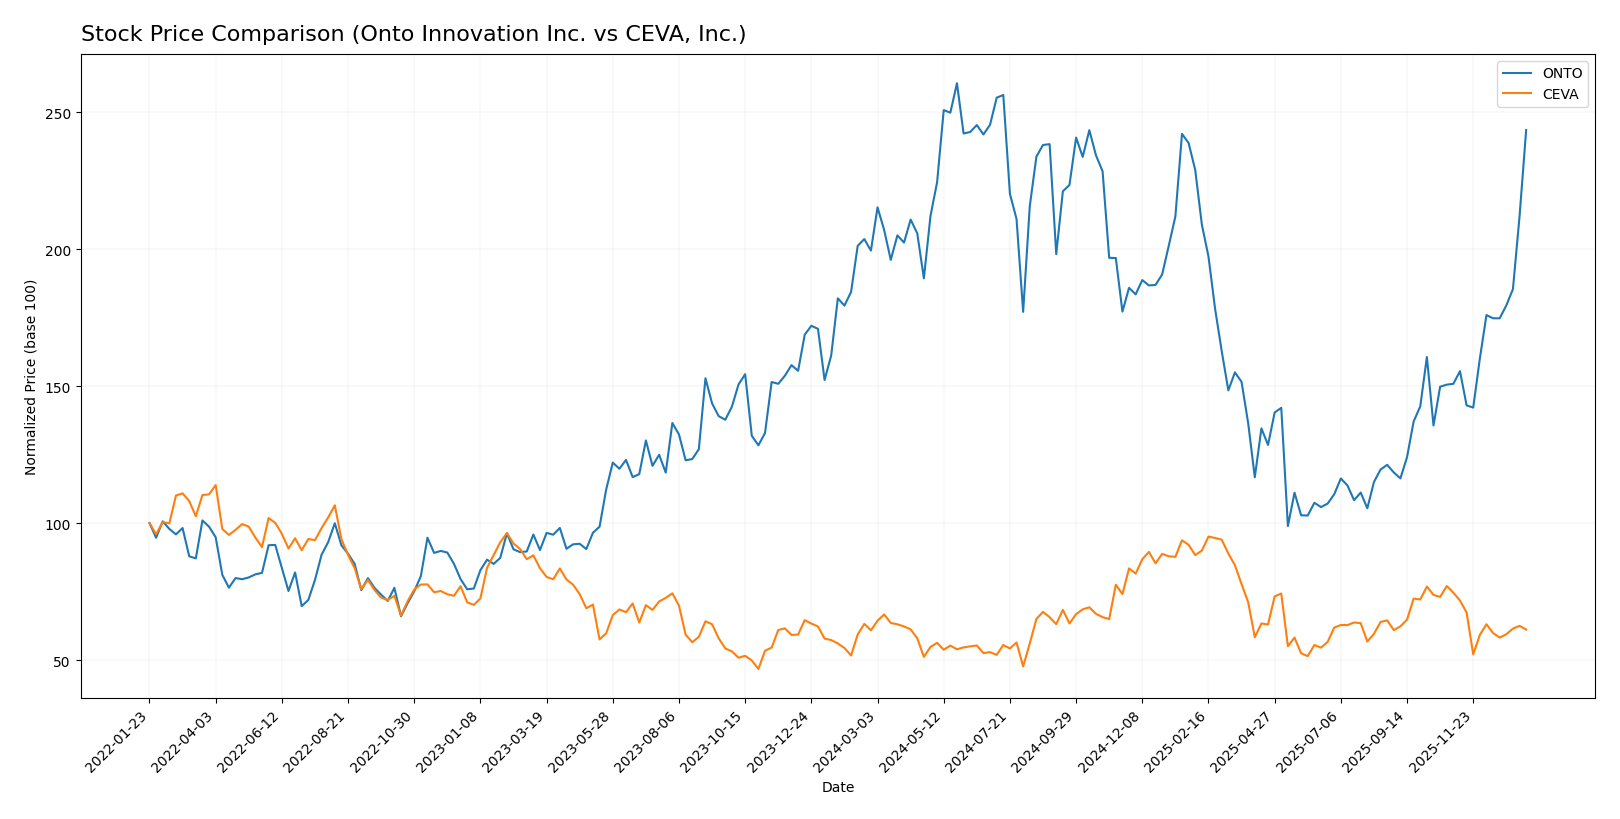
The stock price movements over the past 12 months reveal distinct trends for Onto Innovation Inc. and CEVA, Inc., highlighting Onto Innovation’s strong bullish momentum contrasted with CEVA’s near-neutral performance amid changing trading dynamics.
Trend Analysis
Onto Innovation Inc. experienced a robust bullish trend over the past year with a 22.07% price increase, showing acceleration and significant volatility, reaching a high of 233.14 and a low of 88.5. Recent months intensified this uptrend with a 61.42% rise.
CEVA, Inc. posted a marginal 0.45% price increase over the same period, indicating a neutral trend with decelerating momentum and low volatility. The recent period saw a -18.04% decline, reflecting a short-term bearish phase.
Comparing both, Onto Innovation delivered the highest market performance with a clear bullish acceleration, whereas CEVA remained largely flat overall and faced recent downward pressure.
Target Prices
The current target price consensus for these semiconductor companies reflects moderate upside potential relative to their latest market prices.
| Company | Target High | Target Low | Consensus |
|---|---|---|---|
| Onto Innovation Inc. | 200 | 160 | 178 |
| CEVA, Inc. | 28 | 28 | 28 |
Analysts expect Onto Innovation’s stock to trade below its current price of 217.85 USD, indicating potential overvaluation. CEVA’s target price of 28 USD suggests upside from its current 22.3 USD market price.
Analyst Opinions Comparison
This section compares analysts’ ratings and grades for Onto Innovation Inc. and CEVA, Inc.:
Rating Comparison
ONTO Rating
- Rating: B+, classified as Very Favorable
- Discounted Cash Flow Score: 3, indicating moderate value
- ROE Score: 3, reflecting moderate efficiency
- ROA Score: 4, showing favorable asset utilization
- Debt To Equity Score: 4, indicating favorable financial risk
- Overall Score: 3, considered moderate
CEVA Rating
- Rating: C+, classified as Very Favorable
- Discounted Cash Flow Score: 3, indicating moderate value
- ROE Score: 1, reflecting very unfavorable efficiency
- ROA Score: 1, showing very unfavorable asset utilization
- Debt To Equity Score: 4, indicating favorable financial risk
- Overall Score: 2, considered moderate
Which one is the best rated?
Based strictly on the data, Onto Innovation Inc. holds a higher rating (B+) and scores better in ROE, ROA, and overall evaluation compared to CEVA, Inc., which has lower scores except for debt management.
Scores Comparison
The comparison of Onto Innovation Inc. and CEVA, Inc. scores is as follows:
ONTO Scores
- Altman Z-Score: 34.16, indicating a safe zone, very low bankruptcy risk.
- Piotroski Score: 4, reflecting average financial strength.
CEVA Scores
- Altman Z-Score: 9.99, indicating a safe zone, low bankruptcy risk.
- Piotroski Score: 4, reflecting average financial strength.
Which company has the best scores?
Both Onto and CEVA are in the safe zone for Altman Z-Score, but Onto has a significantly higher score. Both companies share the same average Piotroski Score of 4. Onto shows a stronger Altman Z-Score based on the data.
Grades Comparison
Here is a comparison of the latest grades assigned to Onto Innovation Inc. and CEVA, Inc.:
Onto Innovation Inc. Grades
This table summarizes recent grades and actions from recognized grading companies for Onto Innovation Inc.:
| Grading Company | Action | New Grade | Date |
|---|---|---|---|
| Stifel | Maintain | Hold | 2026-01-14 |
| Needham | Maintain | Buy | 2026-01-06 |
| Jefferies | Maintain | Buy | 2025-12-15 |
| B. Riley Securities | Maintain | Buy | 2025-11-18 |
| Needham | Maintain | Buy | 2025-11-18 |
| Evercore ISI Group | Maintain | Outperform | 2025-11-05 |
| Oppenheimer | Maintain | Outperform | 2025-10-14 |
| Stifel | Maintain | Hold | 2025-10-13 |
| B. Riley Securities | Maintain | Buy | 2025-10-10 |
| Jefferies | Upgrade | Buy | 2025-09-23 |
The grades for Onto Innovation Inc. generally indicate a positive outlook, with most firms maintaining Buy or Outperform ratings and a few Hold ratings.
CEVA, Inc. Grades
This table presents the latest grades and actions from established grading companies for CEVA, Inc.:
| Grading Company | Action | New Grade | Date |
|---|---|---|---|
| Barclays | Maintain | Overweight | 2025-11-12 |
| Rosenblatt | Maintain | Buy | 2025-11-11 |
| Rosenblatt | Maintain | Buy | 2025-08-14 |
| Oppenheimer | Maintain | Outperform | 2025-05-09 |
| Rosenblatt | Maintain | Buy | 2025-05-08 |
| Barclays | Maintain | Overweight | 2025-05-08 |
| Rosenblatt | Maintain | Buy | 2025-04-23 |
| Barclays | Maintain | Overweight | 2025-02-14 |
| Rosenblatt | Maintain | Buy | 2025-02-14 |
| Rosenblatt | Maintain | Buy | 2025-02-11 |
CEVA, Inc. consistently receives Buy and Overweight ratings, reflecting steady confidence from analysts without recent grade changes.
Which company has the best grades?
Both Onto Innovation Inc. and CEVA, Inc. carry predominantly positive grades, with Onto Innovation showing a mix of Buy and Outperform ratings and some Hold grades, while CEVA maintains mostly Buy and Overweight ratings. Investors might view Onto Innovation’s occasional Hold ratings as slightly more cautious compared to CEVA’s stable Buy consensus.
Strengths and Weaknesses
Below is a comparison of key strengths and weaknesses between Onto Innovation Inc. (ONTO) and CEVA, Inc. based on the most recent data available.
| Criterion | Onto Innovation Inc. (ONTO) | CEVA, Inc. |
|---|---|---|
| Diversification | Strong product segmentation with Parts, Services, and Systems & Software revenues exceeding $900M in total (2024) | Focused on License and Royalty revenues (~$107M in 2024), less diversified product base |
| Profitability | Positive net margin (20.43%) and neutral ROIC (8.77%), but WACC higher than ROIC indicating slight value destruction | Negative net margin (-8.22%) and declining ROIC (-2.68%), signaling value destruction with worsening profitability |
| Innovation | High fixed asset turnover (7.16) and growing ROIC trend suggest innovation driving efficiency | High fixed asset turnover (8.43) but declining ROIC trend indicates innovation may not be translating into profitability |
| Global presence | Substantial Systems & Software revenue growth globally, diversified customers | Primarily License and Royalty revenue streams, possibly limited geographic expansion |
| Market Share | Large and growing revenue base in Systems & Software segment (~$850M in 2024) | Smaller revenue base with License and Royalty around $107M total, indicating smaller market share |
Key takeaways: Onto Innovation shows stronger diversification and improving profitability trends despite slight value destruction, while CEVA faces significant profitability challenges and shrinking value with less diversified revenue streams. Onto’s growing ROIC and large Systems & Software segment make it more attractive for cautious investors.
Risk Analysis
The table below compares key risks for Onto Innovation Inc. and CEVA, Inc. based on their most recent financial and market data from 2024.
| Metric | Onto Innovation Inc. | CEVA, Inc. |
|---|---|---|
| Market Risk | Beta 1.46, moderate volatility due to tech industry exposure | Beta 1.44, similar moderate volatility tied to semiconductor licensing markets |
| Debt Level | Very low debt-to-equity 0.01, strong balance sheet | Low debt-to-equity 0.02, manageable financial risk |
| Regulatory Risk | Moderate, standard semiconductor industry regulations | Moderate, exposure to wireless tech licensing compliance |
| Operational Risk | Medium, relies on advanced manufacturing and software integration | Medium-high, depends on licensing agreements and tech innovation |
| Environmental Risk | Low, limited direct environmental impact | Low, primarily IP licensor with minimal physical footprint |
| Geopolitical Risk | Moderate, global supply chain dependencies in semiconductors | Moderate, sensitive to international trade policies affecting OEM partners |
The most impactful risks are market volatility and operational dependencies. Onto Innovation benefits from a very low debt level and robust liquidity, reducing financial distress risk. CEVA shows weaker profitability and financial metrics, increasing operational risk and financial vulnerability despite low debt. Both face moderate regulatory and geopolitical challenges inherent in semiconductor and technology sectors.
Which Stock to Choose?
Onto Innovation Inc. shows a strong income evolution with a 77% revenue growth over five years and a favorable net margin of 20.43%. Its financial ratios are mixed with some favorable debt metrics but high valuation multiples. Profitability is solid with ROE at 10.47%, and debt remains low. The company holds a very favorable B+ rating.
CEVA, Inc. presents modest revenue growth of 6.6% over five years but suffers from negative net margin (-8.22%) and declining profitability metrics. Financial ratios reveal several unfavorable indicators, including high debt impact and weak returns. Its rating is lower at C+, reflecting these challenges despite some favorable liquidity ratios.
Investors prioritizing growth and improving profitability might find Onto Innovation’s profile more aligned with their objectives, given its favorable rating and strong income statement. Conversely, those with a tolerance for higher risk and potential turnaround scenarios may view CEVA’s current valuation and liquidity as areas of interest, albeit with caution due to its unfavorable rating and declining returns.
Disclaimer: Investment carries a risk of loss of initial capital. The past performance is not a reliable indicator of future results. Be sure to understand risks before making an investment decision.
Go Further
I encourage you to read the complete analyses of Onto Innovation Inc. and CEVA, Inc. to enhance your investment decisions: