In the fast-evolving semiconductor industry, ON Semiconductor Corporation and CEVA, Inc. stand out with distinct yet overlapping focuses. ON Semiconductor leads in intelligent power and sensing solutions, driving innovations in electric vehicles and sustainable energy. CEVA specializes in licensing advanced wireless connectivity and AI processors, powering next-gen mobile and IoT devices. This comparison will help investors identify which company offers the most compelling growth and innovation potential in this critical tech sector.
Table of contents
Companies Overview
I will begin the comparison between ON Semiconductor Corporation and CEVA, Inc. by providing an overview of these two companies and their main differences.
ON Semiconductor Corporation Overview
ON Semiconductor Corporation focuses on providing intelligent sensing and power solutions globally, targeting the electrification of the automotive industry and sustainable energy. It operates through three segments: Power Solutions, Advanced Solutions, and Intelligent Sensing, delivering analog, discrete, and integrated semiconductor products. The company supports diverse applications, including electric vehicles, fast-charging systems, and industrial power, positioning itself as a key player in semiconductor technology.
CEVA, Inc. Overview
CEVA, Inc. licenses wireless connectivity and smart sensing technologies to semiconductor and OEM companies worldwide. Its portfolio includes digital signal processors, AI processors, and platforms for 5G, imaging, computer vision, and IoT applications. CEVA provides hardware definitions and development tools that aid system design and software development. The company targets markets such as mobile, automotive, robotics, and industrial sectors through a licensing business model.
Key similarities and differences
Both ON Semiconductor and CEVA operate in the semiconductor industry and emphasize advanced technology solutions. ON focuses on manufacturing integrated semiconductor products for power and sensing applications, while CEVA operates primarily as a technology licensor specializing in wireless and AI processing IP. ON serves end-users directly with hardware products, whereas CEVA licenses its technologies to other semiconductor and OEM companies for integration into their products.
Income Statement Comparison
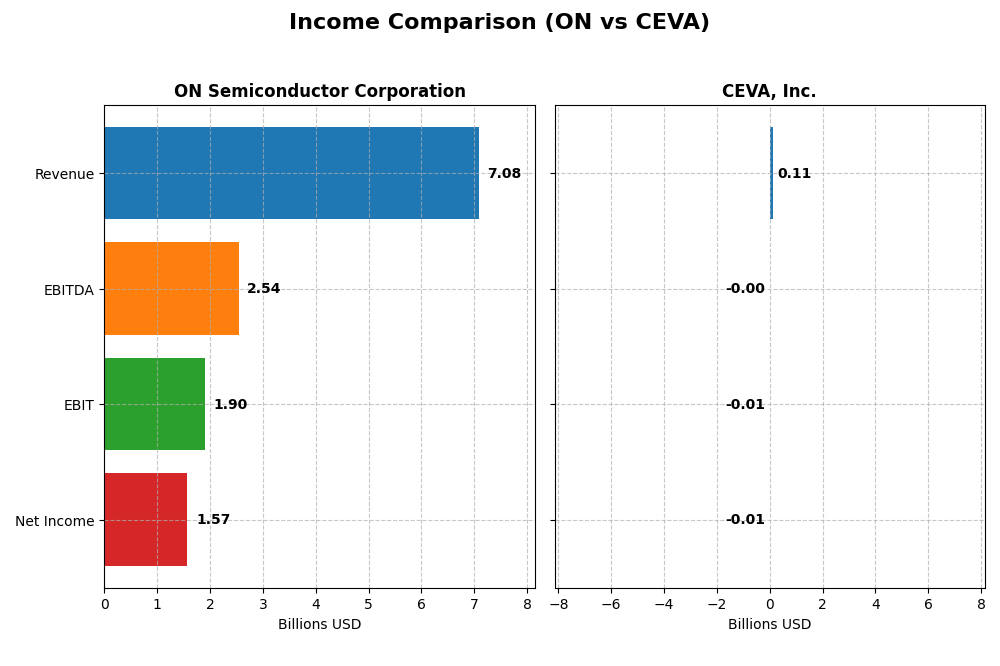
The table below compares the key income statement metrics for ON Semiconductor Corporation and CEVA, Inc. for the fiscal year 2024, providing a snapshot of their financial performance.
| Metric | ON Semiconductor Corporation | CEVA, Inc. |
|---|---|---|
| Market Cap | 24.7B | 536M |
| Revenue | 7.08B | 107M |
| EBITDA | 2.54B | -3.41M |
| EBIT | 1.90B | -7.55M |
| Net Income | 1.57B | -8.79M |
| EPS | 3.68 | -0.37 |
| Fiscal Year | 2024 | 2024 |
Income Statement Interpretations
ON Semiconductor Corporation
ON Semiconductor showed substantial growth from 2020 to 2024, with revenue rising 34.8% and net income surging over 570%. Margins remain strong and favorable, with a gross margin of 45.4% and a net margin of 22.2%. However, in 2024, revenue and net income declined sharply, signaling a recent slowdown despite historically solid profitability.
CEVA, Inc.
CEVA’s revenue exhibited modest growth of 6.6% over the period, but its net income deteriorated significantly, declining by 269%. The company maintains a very high gross margin of 88.1%, yet suffers from negative EBIT and net margins, reflecting persistent operating losses. In 2024, CEVA improved growth rates and margins, though net income remained negative.
Which one has the stronger fundamentals?
ON Semiconductor stands out with robust overall growth, positive and stable margins, and strong profitability despite recent year declines. CEVA shows favorable revenue and margin improvements recently but struggles with sustained net losses and weaker overall income growth. ON’s fundamentals appear stronger based on sustained profitability and margin stability.
Financial Ratios Comparison
This table presents the most recent key financial ratios for ON Semiconductor Corporation and CEVA, Inc., providing a side-by-side comparison for fiscal year 2024.
| Ratios | ON Semiconductor Corporation | CEVA, Inc. |
|---|---|---|
| ROE | 17.9% | -3.3% |
| ROIC | 11.9% | -2.7% |
| P/E | 17.1 | -84.8 |
| P/B | 3.1 | 2.8 |
| Current Ratio | 5.06 | 7.09 |
| Quick Ratio | 3.38 | 7.09 |
| D/E | 0.38 | 0.02 |
| Debt-to-Assets | 23.9% | 1.8% |
| Interest Coverage | 28.4 | 0 |
| Asset Turnover | 0.50 | 0.35 |
| Fixed Asset Turnover | 1.61 | 8.43 |
| Payout Ratio | 0 | 0 |
| Dividend Yield | 0% | 0% |
Interpretation of the Ratios
ON Semiconductor Corporation
ON Semiconductor exhibits a generally favorable profile with strong net margin (22.21%), ROE (17.88%), and ROIC (11.88%), indicating efficient profitability and capital use. However, elevated WACC and high current ratio suggest some financial structure concerns. The company does not pay dividends, likely reinvesting earnings to support growth and innovation in semiconductors.
CEVA, Inc.
CEVA shows several unfavorable metrics, including negative net margin (-8.22%) and ROE (-3.3%), reflecting operational challenges. While it maintains low debt and a strong quick ratio, the zero interest coverage and weak asset turnover raise concerns. CEVA also pays no dividends, possibly due to losses and a focus on R&D and licensing expansion.
Which one has the best ratios?
ON Semiconductor holds the advantage with a more balanced set of favorable profitability and leverage ratios, despite some issues with capital costs and liquidity. CEVA’s ratios are predominantly unfavorable, highlighting operational inefficiencies and financial risks. Overall, ON’s ratios present a comparatively stronger financial position in 2024.
Strategic Positioning
This section compares the strategic positioning of ON and CEVA, including market position, key segments, and exposure to technological disruption:
ON
- Large market cap with significant competitive pressure in semiconductors industry.
- Diverse business segments: Power Solutions, Analog Solutions, Intelligent Sensing.
- Moderate exposure through advanced semiconductor product innovation and foundry services.
CEVA
- Small market cap with competitive pressure as a licensor in wireless connectivity and DSP IP.
- Focused on licensing DSP cores and AI processors for wireless and smart sensing technologies.
- High exposure due to licensing cutting-edge DSP and AI technologies in connectivity and sensing.
ON vs CEVA Positioning
ON follows a diversified strategy across multiple semiconductor product groups providing broad end-market coverage, while CEVA concentrates on licensing IP in wireless and AI processors. ON’s scale offers resilience; CEVA’s specialization targets niche technology licensing but with increased risk from market shifts.
Which has the best competitive advantage?
ON’s slightly favorable MOAT indicates improving profitability and better capital efficiency, whereas CEVA’s very unfavorable MOAT shows declining returns and value destruction, suggesting ON currently holds a stronger competitive advantage.
Stock Comparison
The stock price movements of ON Semiconductor Corporation and CEVA, Inc. over the past year reveal contrasting trends, with ON showing a pronounced bearish pattern overall but recent bullish momentum, while CEVA exhibits a near-neutral long-term trend with recent bearish pressure.

Trend Analysis
ON Semiconductor Corporation’s stock experienced a -20.88% decline over the past 12 months, indicating a bearish trend with accelerating downward pressure. The price ranged widely from 33.7 to 81.14, reflecting high volatility (std deviation 11.97). Recent weeks saw a 20.37% price recovery.
CEVA, Inc. recorded a modest 0.45% overall price increase, classifying its 12-month trend as bullish but decelerating. Its price fluctuated between 17.39 and 34.67 with moderate volatility (std deviation 4.4). Recent trading showed an 18.04% decline, indicating short-term bearishness.
Comparing both, ON Semiconductor’s stock had a more significant price decline overall but showed a stronger recent rebound. CEVA’s stock maintained relative stability with minimal long-term gains but faced recent selling pressure. ON’s stock delivered the highest market performance in the latest period.
Target Prices
The current analyst target consensus for ON Semiconductor Corporation and CEVA, Inc. reflects moderate optimism.
| Company | Target High | Target Low | Consensus |
|---|---|---|---|
| ON Semiconductor Corporation | 64 | 51 | 58.33 |
| CEVA, Inc. | 28 | 28 | 28 |
Analysts expect ON Semiconductor’s price to hover slightly below or near current levels, with a consensus target of 58.33 versus a current price of 60.28 USD. CEVA’s consensus target of 28 USD is notably above its current 22.3 USD, indicating potential upside.
Analyst Opinions Comparison
This section compares analysts’ ratings and grades for ON Semiconductor Corporation and CEVA, Inc.:
Rating Comparison
ON Rating
- Rating: B-, considered Very Favorable.
- Discounted Cash Flow Score: 3, indicating moderate valuation.
- ROE Score: 2, reflecting moderate efficiency in generating profit.
- ROA Score: 3, showing moderate asset utilization.
- Debt To Equity Score: 2, moderate financial risk.
- Overall Score: 2, moderate overall financial standing.
CEVA Rating
- Rating: C+, considered Very Favorable.
- Discounted Cash Flow Score: 3, indicating moderate valuation.
- ROE Score: 1, reflecting very unfavorable profit generation efficiency.
- ROA Score: 1, showing very unfavorable asset utilization.
- Debt To Equity Score: 4, favorable low financial risk.
- Overall Score: 2, moderate overall financial standing.
Which one is the best rated?
ON Semiconductor has higher scores in return on equity and assets, suggesting better operational efficiency, while CEVA holds a stronger debt-to-equity position. Both have the same overall score and discounted cash flow rating.
Scores Comparison
The scores comparison of ON Semiconductor Corporation and CEVA, Inc. highlights their financial stability and strength as follows:
ON Scores
- Altman Z-Score: 4.84, indicating a safe zone status
- Piotroski Score: 6, reflecting average financial strength
CEVA Scores
- Altman Z-Score: 9.99, indicating a safe zone status
- Piotroski Score: 4, reflecting average financial strength
Which company has the best scores?
Based on the provided data, CEVA has a higher Altman Z-Score than ON, suggesting stronger financial stability. However, ON holds a higher Piotroski Score, indicating comparatively better financial strength. Both companies are in the safe zone with average Piotroski scores.
Grades Comparison
Here is a comparison of the latest available grades for ON Semiconductor Corporation and CEVA, Inc.:
ON Semiconductor Corporation Grades
The table below summarizes recent grades assigned by reputable grading companies for ON Semiconductor Corporation:
| Grading Company | Action | New Grade | Date |
|---|---|---|---|
| Piper Sandler | Maintain | Overweight | 2026-01-07 |
| Truist Securities | Maintain | Hold | 2025-12-19 |
| Morgan Stanley | Maintain | Equal Weight | 2025-11-24 |
| Truist Securities | Maintain | Hold | 2025-11-04 |
| Baird | Maintain | Neutral | 2025-11-04 |
| Rosenblatt | Maintain | Neutral | 2025-11-04 |
| Morgan Stanley | Maintain | Equal Weight | 2025-11-04 |
| TD Cowen | Maintain | Buy | 2025-11-04 |
| UBS | Maintain | Neutral | 2025-10-27 |
| B of A Securities | Maintain | Neutral | 2025-09-05 |
Overall, ON Semiconductor shows a balanced range of grades with a leaning toward Hold and Neutral ratings, mixed with a few Buy and Overweight opinions.
CEVA, Inc. Grades
The table below shows recent grades assigned by recognized grading firms for CEVA, Inc.:
| Grading Company | Action | New Grade | Date |
|---|---|---|---|
| Barclays | Maintain | Overweight | 2025-11-12 |
| Rosenblatt | Maintain | Buy | 2025-11-11 |
| Rosenblatt | Maintain | Buy | 2025-08-14 |
| Oppenheimer | Maintain | Outperform | 2025-05-09 |
| Rosenblatt | Maintain | Buy | 2025-05-08 |
| Barclays | Maintain | Overweight | 2025-05-08 |
| Rosenblatt | Maintain | Buy | 2025-04-23 |
| Barclays | Maintain | Overweight | 2025-02-14 |
| Rosenblatt | Maintain | Buy | 2025-02-14 |
| Rosenblatt | Maintain | Buy | 2025-02-11 |
CEVA, Inc. consistently receives Buy and Overweight ratings, with an Outperform grade from Oppenheimer, indicating a generally positive outlook.
Which company has the best grades?
CEVA, Inc. has received more consistently positive grades, mainly Buy and Overweight, compared to ON Semiconductor’s more mixed Hold and Neutral ratings. This suggests CEVA may currently enjoy stronger analyst confidence, which can influence investor sentiment and portfolio decisions.
Strengths and Weaknesses
Below is a comparative overview of key strengths and weaknesses for ON Semiconductor Corporation (ON) and CEVA, Inc. based on the latest financial and operational data.
| Criterion | ON Semiconductor Corporation (ON) | CEVA, Inc. |
|---|---|---|
| Diversification | Strong diversification with three major segments: Power Solutions (3.35B), Analog Solutions (2.61B), Intelligent Sensing (1.13B) | Limited diversification; mainly License (60M) and Royalty (47M) revenue streams |
| Profitability | Favorable profitability: net margin 22.21%, ROE 17.88%, ROIC 11.88%, growing ROIC trend | Unfavorable profitability: net margin -8.22%, ROE -3.3%, ROIC -2.68%, declining ROIC trend |
| Innovation | Moderate innovation reflected in consistent growth in ROIC and expanding product groups | Innovation challenged by declining profitability and value destruction |
| Global presence | Well-established global presence supported by large-scale product segments | Smaller scale with niche licensing and royalty business globally |
| Market Share | Significant market share in semiconductor analog and power solutions | Smaller market share focused on IP licensing in connectivity and sensing |
Key takeaways: ON Semiconductor shows solid diversification and improving profitability, signaling a slightly favorable investment outlook. CEVA, however, struggles with declining returns and limited diversification, indicating higher risk and unfavorable financial health. Investors should weigh ON’s growth potential against CEVA’s volatility and value erosion.
Risk Analysis
Below is a comparative table outlining key risks for ON Semiconductor Corporation (ON) and CEVA, Inc. as of 2024:
| Metric | ON Semiconductor Corporation (ON) | CEVA, Inc. |
|---|---|---|
| Market Risk | Beta 1.543 (high volatility) | Beta 1.436 (high volatility) |
| Debt level | Debt-to-Equity 0.38 (favorable) | Debt-to-Equity 0.02 (favorable, very low) |
| Regulatory Risk | Moderate (semiconductor regulations) | Moderate (IP licensing and tech regulations) |
| Operational Risk | Medium (complex manufacturing) | High (dependency on licensing model and partners) |
| Environmental Risk | Moderate (manufacturing footprint) | Low (software/IP focus) |
| Geopolitical Risk | Moderate (global supply chain exposure) | Moderate (global tech licensing exposure) |
ON Semiconductor faces significant market risk with a beta of 1.543, indicating higher stock price volatility. However, its manageable debt level and strong interest coverage ratio (30.49) reduce financial risk. CEVA, while having minimal debt, shows unfavorable profitability and operational risks due to reliance on licensing revenues and lower asset turnover. Both companies operate in a regulated and geopolitically sensitive semiconductor industry, but ON’s manufacturing footprint adds environmental risk compared to CEVA’s software-centric model. The most impactful risks remain market volatility and operational execution for both firms.
Which Stock to Choose?
ON Semiconductor Corporation shows a favorable global income statement with strong profitability, a solid return on equity at 17.88%, low debt levels, and a slightly favorable financial ratios profile. Its rating is very favorable with a B- score.
CEVA, Inc. presents a challenging financial picture with negative profitability metrics, unfavorable return on equity and invested capital, low debt, but an overall unfavorable financial ratios evaluation. Its rating is very favorable with a C+ score despite operational difficulties.
Investors focused on growth and improving profitability might find ON Semiconductor’s metrics and upward ROIC trend more appealing, while those with a higher risk tolerance aware of CEVA’s volatility and recent revenue growth might interpret its profile differently. The choice depends on the investor’s risk appetite and strategy.
Disclaimer: Investment carries a risk of loss of initial capital. The past performance is not a reliable indicator of future results. Be sure to understand risks before making an investment decision.
Go Further
I encourage you to read the complete analyses of ON Semiconductor Corporation and CEVA, Inc. to enhance your investment decisions: