Home > Comparison > Technology > NXPI vs CEVA
The strategic rivalry between NXP Semiconductors N.V. and CEVA, Inc. shapes the semiconductor industry’s evolution. NXP operates as a capital-intensive semiconductor manufacturer, delivering diverse microcontrollers and connectivity solutions. CEVA, by contrast, focuses on high-margin intellectual property licensing, specializing in wireless connectivity and AI processors. This head-to-head contrasts tangible asset scale with scalable licensing growth. This analysis will identify which model offers a superior risk-adjusted return for diversified portfolios amid ongoing technological disruption.
Table of contents
Companies Overview
NXP Semiconductors and CEVA, Inc. both play pivotal roles in the semiconductor industry, shaping key technological advances worldwide.
NXP Semiconductors N.V.: Global Semiconductor Powerhouse
NXP Semiconductors dominates the semiconductor sector with a vast portfolio including microcontrollers, application processors, and wireless connectivity solutions. Its core revenue engine stems from supplying advanced chips to automotive, industrial, mobile, and communication infrastructure markets. In 2026, NXP’s strategic focus centers on expanding its automotive and IoT segments to capitalize on growing demand for connected devices.
CEVA, Inc.: Specialist in Wireless Licensing
CEVA, Inc. operates as a licensor of digital signal processors and AI processors, generating revenue through intellectual property licensing to semiconductor and OEM firms. The company’s competitive advantage lies in its wireless connectivity and smart sensing technologies for 5G, IoT, and AI-driven applications. CEVA’s 2026 strategy prioritizes expanding its 5G and AI platform licenses to capture emerging market opportunities.
Strategic Collision: Similarities & Divergences
NXP and CEVA share a focus on semiconductors but diverge in business models—NXP builds and sells physical chips, while CEVA licenses IP cores and software. Their primary battleground is the wireless and IoT ecosystem, where hardware integration meets software sophistication. NXP offers a capital-intensive, product-driven investment profile; CEVA provides a nimble, licensing-based model with scalable margins.
Income Statement Comparison
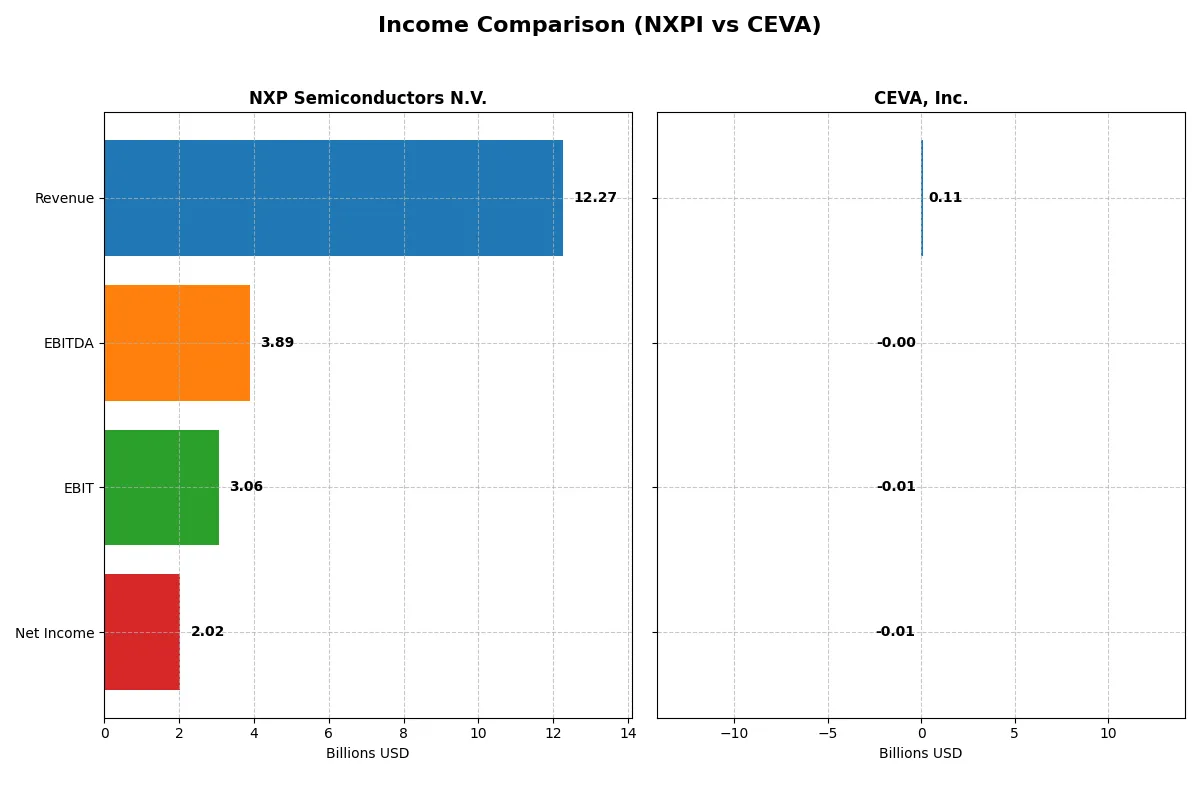
The following data dissects the core profitability and scalability of both corporate engines to reveal who dominates the bottom line:
| Metric | NXP Semiconductors N.V. (NXPI) | CEVA, Inc. (CEVA) |
|---|---|---|
| Revenue | 12.27B | 107M |
| Cost of Revenue | 5.59B | 13M |
| Operating Expenses | 3.37B | 102M |
| Gross Profit | 6.68B | 94M |
| EBITDA | 3.89B | -3.41M |
| EBIT | 3.06B | -7.55M |
| Interest Expense | 384M | 0 |
| Net Income | 2.02B | -8.79M |
| EPS | 8.00 | -0.37 |
| Fiscal Year | 2025 | 2024 |
Income Statement Analysis: The Bottom-Line Duel
This income statement comparison reveals which company runs a more efficient and profitable business engine in their latest fiscal years.
NXP Semiconductors N.V. Analysis
NXP’s revenue grew 11% over five years but dipped 2.7% in 2025 to $12.3B. Net income rose 8% overall despite a 17% decline last year, finishing at $2B. Gross margin remains robust at 54.4%, while net margin holds a healthy 16.5%. Recent results show some margin compression but sustained profit strength.
CEVA, Inc. Analysis
CEVA’s revenue advanced nearly 10% in 2024 to $107M, with gross margins soaring above 88%. However, net income remains negative at -$8.8M, although improving from prior years. EBIT margin stayed negative at -7.1%, reflecting ongoing operating losses despite revenue and EPS momentum. The firm’s profitability challenges persist amid growth.
Margin Power vs. Revenue Scale
NXP delivers scale with solid profitability, maintaining double-digit net margins and positive earnings growth. CEVA shows strong revenue and gross margin growth but struggles to convert scale into profits, posting losses. For investors, NXP’s proven earnings track record stands out, while CEVA’s profile suits those focused on growth potential despite ongoing losses.
Financial Ratios Comparison
These vital ratios act as a diagnostic tool to expose the underlying fiscal health, valuation premiums, and capital efficiency of the companies compared below:
| Ratios | NXP Semiconductors N.V. (NXPI) | CEVA, Inc. (CEVA) |
|---|---|---|
| ROE | 20.1% | -3.3% |
| ROIC | 11.0% | -2.7% |
| P/E | 27.1 | -84.8 |
| P/B | 5.45 | 2.79 |
| Current Ratio | 2.05 | 7.09 |
| Quick Ratio | 1.38 | 7.09 |
| D/E (Debt-to-Equity) | 1.22 | 0.02 |
| Debt-to-Assets | 46.0% | 1.8% |
| Interest Coverage | 8.62 | 0 |
| Asset Turnover | 0.46 | 0.35 |
| Fixed Asset Turnover | 4.12 | 8.43 |
| Payout Ratio | 50.7% | 0% |
| Dividend Yield | 1.87% | 0% |
| Fiscal Year | 2025 | 2024 |
Efficiency & Valuation Duel: The Vital Signs
Ratios serve as a company’s financial DNA, uncovering hidden risks and revealing operational strengths that numbers alone cannot show.
NXP Semiconductors N.V.
NXP Semiconductors exhibits robust profitability with a 20.1% ROE and healthy 16.47% net margin, signaling operational efficiency. Despite a stretched P/E of 27.14 and P/B of 5.45, the stock remains slightly favorable overall. It supports shareholder returns via a 1.87% dividend yield, balancing growth with income.
CEVA, Inc.
CEVA struggles with negative profitability, reporting a -3.3% ROE and -8.22% net margin, indicating operational challenges. Its P/E ratio is negative but considered favorable due to losses, while a low debt-to-equity ratio of 0.02 reflects cautious leverage. CEVA pays no dividends, focusing heavily on R&D with 67% of revenue invested in growth.
Profitability Strength vs. Growth Struggles
NXP Semiconductors offers a stronger profitability profile but trades at a premium valuation, while CEVA’s negative returns and high R&D push signal growth risk. Investors seeking operational stability may prefer NXP’s balanced risk-reward, whereas growth-oriented profiles might consider CEVA’s early-stage investment appeal.
Which one offers the Superior Shareholder Reward?
I find NXP Semiconductors (NXPI) offers a superior shareholder reward compared to CEVA, Inc. NXPI delivers a consistent 1.9% dividend yield with a sustainable payout ratio near 50%. Its free cash flow coverage suggests dividends are well-supported. NXPI also executes substantial buybacks, enhancing total returns. CEVA pays no dividends and shows weak profitability with negative margins. Its minuscule free cash flow and modest buyback activity limit shareholder rewards. NXPI’s balanced distribution via dividends and buybacks provides a more reliable and attractive total return profile for 2026 investors.
Comparative Score Analysis: The Strategic Profile
The radar chart reveals the fundamental DNA and trade-offs of both firms, highlighting their core financial strengths and vulnerabilities:
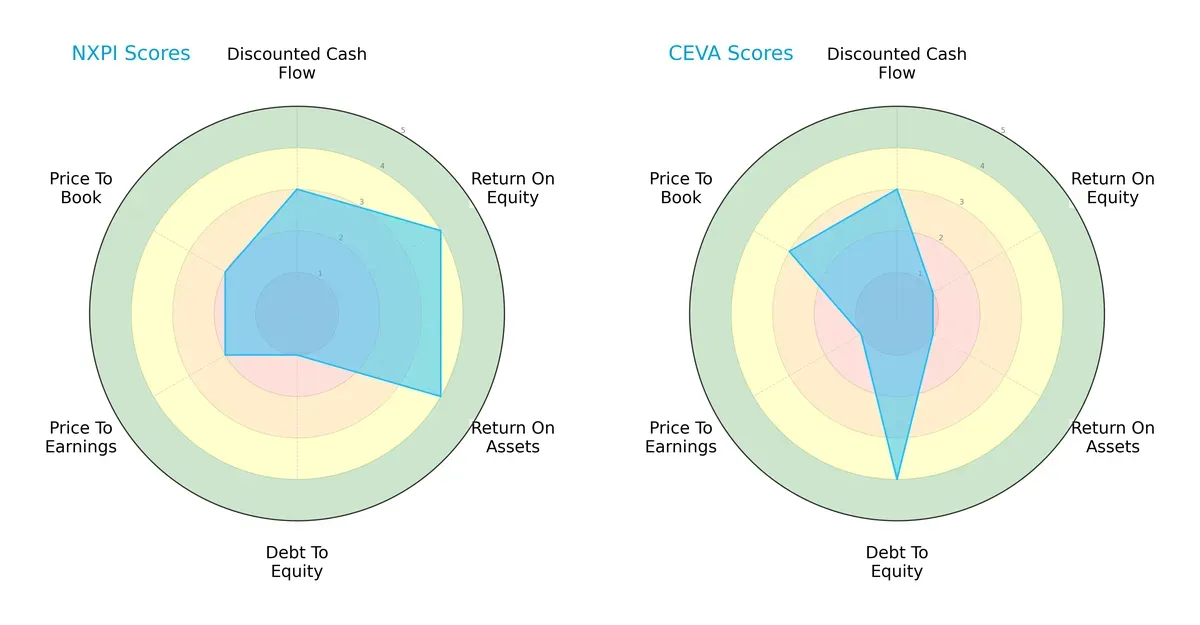
NXP Semiconductors exhibits balanced strength in ROE (4) and ROA (4), signaling efficient profit generation and asset use. However, it carries a significant debt risk (Debt/Equity score 1) and unfavorable valuation metrics (P/E and P/B scores at 2). CEVA, by contrast, leverages a low debt burden (Debt/Equity 4) but suffers from weak profitability (ROE and ROA scores at 1) and poor valuation (P/E 1). NXP’s profile is more balanced, while CEVA relies heavily on conservative leverage as its edge.
Bankruptcy Risk: Solvency Showdown
The Altman Z-Score difference favors CEVA, which scores a robust 9.99 versus NXP’s 3.10, both safely above distress thresholds but reflecting distinct financial resilience patterns:
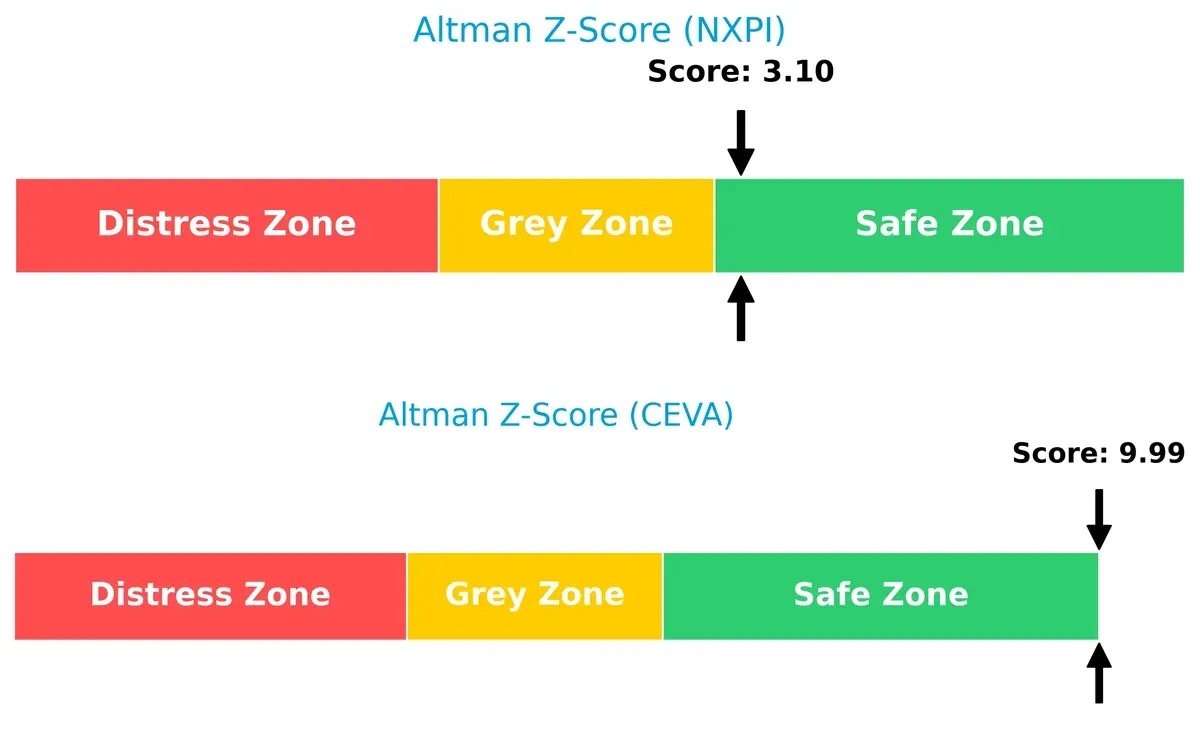
CEVA’s exceptionally high Z-Score signals very strong solvency, reducing bankruptcy risk sharply in volatile market cycles. NXP remains in the safe zone yet faces greater pressure from its debt load, suggesting more caution is warranted for long-term survival.
Financial Health: Quality of Operations
Both firms sit at an average Piotroski F-Score level, with NXP at 5 and CEVA at 4, indicating moderate operational quality and some internal risk signals:
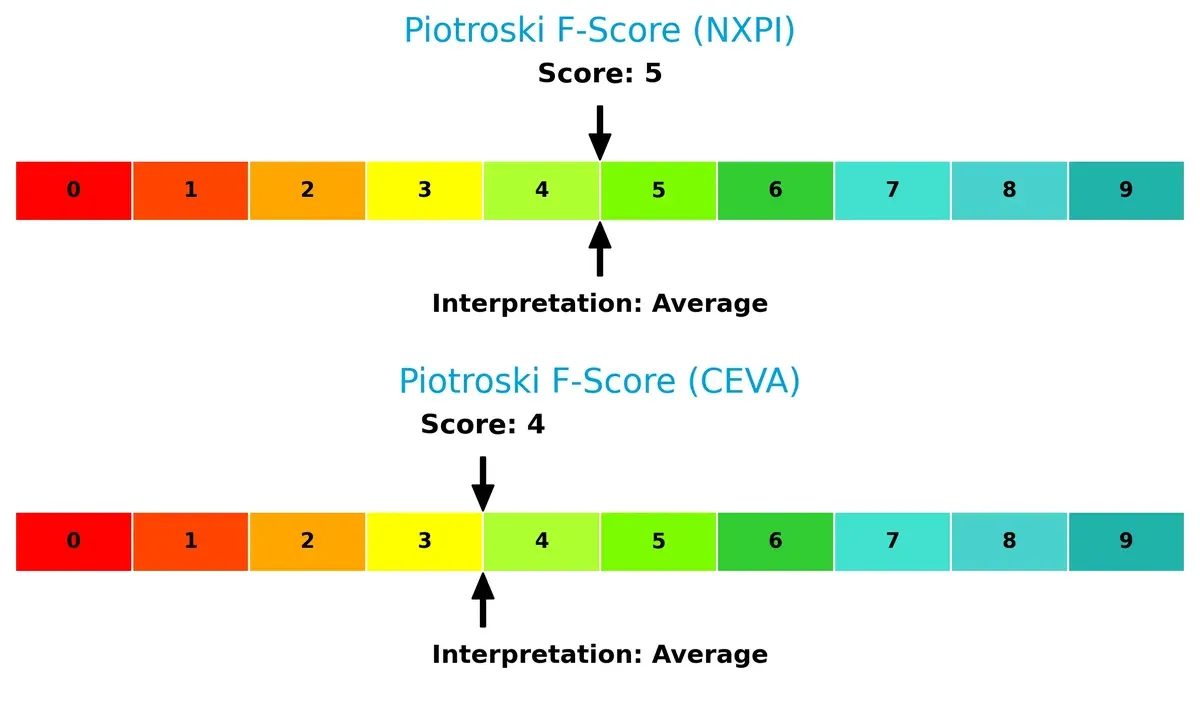
Neither company demonstrates peak financial health. NXP’s slightly higher score reflects better profitability and efficiency metrics. CEVA’s score points to modest red flags in operational consistency, requiring vigilant monitoring before positioning as a value investment.
How are the two companies positioned?
This section dissects the operational DNA of NXP and CEVA by comparing their revenue distribution and internal dynamics. The goal is to confront their economic moats and identify which model offers the most resilient, sustainable competitive advantage today.
Revenue Segmentation: The Strategic Mix
The following visual comparison dissects how NXP Semiconductors and CEVA diversify their income streams and where their primary sector bets lie:
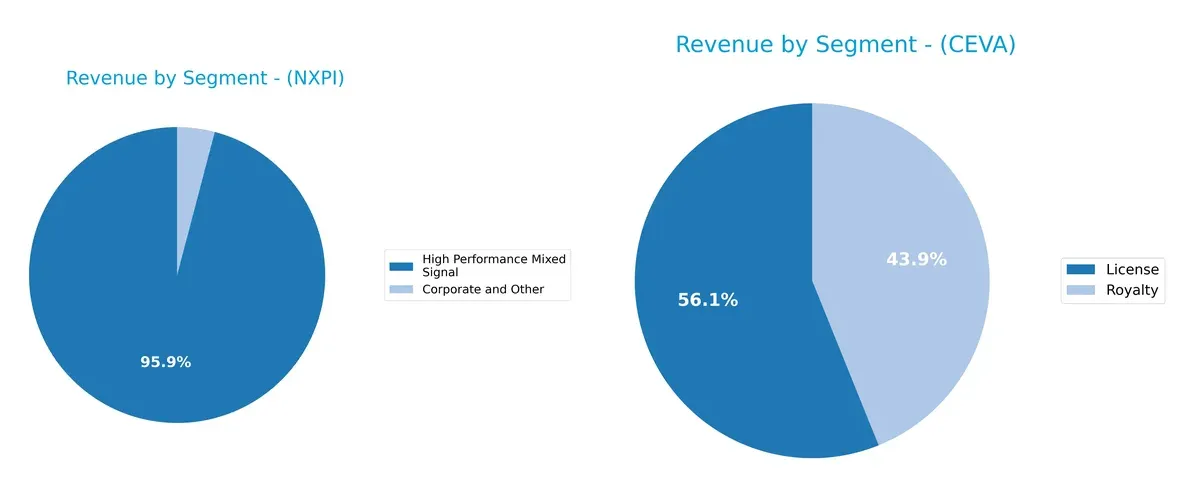
NXP Semiconductors anchors its revenues in High Performance Mixed Signal, generating $9B in 2018, dwarfing its Corporate and Other segment at $385M. CEVA displays a more balanced portfolio with License revenues near $60M and Royalty at $47M in 2024. NXP’s concentration signals infrastructure dominance but exposes it to segment-specific risks. CEVA’s diversified streams indicate strategic flexibility and ecosystem integration, reducing dependency on any single revenue source.
Strengths and Weaknesses Comparison
This table compares the Strengths and Weaknesses of NXP Semiconductors N.V. and CEVA, Inc.:
NXP Semiconductors N.V. Strengths
- High profitability with net margin of 16.47%
- Strong ROE at 20.1%
- Favorable liquidity ratios with current ratio 2.05
- Global presence including China, US, and Europe
- Solid innovation in High Performance Mixed Signal products
CEVA, Inc. Strengths
- Low debt-to-equity ratio at 0.02
- Favorable quick ratio at 7.09
- High fixed asset turnover at 8.43
- Diverse revenue from licenses and royalties
- Presence in Asia Pacific and US markets
NXP Semiconductors N.V. Weaknesses
- Unfavorable valuation metrics with PE 27.14 and PB 5.45
- Moderate leverage with debt-to-assets at 46%
- Unfavorable asset turnover at 0.46
- Dividend yield only neutral at 1.87%
CEVA, Inc. Weaknesses
- Negative profitability with net margin -8.22% and ROE -3.3%
- Unfavorable WACC at 10.73%
- Interest coverage at zero signals financial stress
- Unfavorable current ratio despite strong quick ratio
- No dividend yield
NXP demonstrates robust profitability and geographic diversification but faces valuation and leverage concerns. CEVA shows financial fragility with negative returns despite strong liquidity and asset efficiency. These factors suggest contrasting strategic priorities for each firm.
The Moat Duel: Analyzing Competitive Defensibility
A structural moat is the sole protector of long-term profits against relentless competitive pressure. Let’s dissect the moats of two semiconductor players:
NXP Semiconductors N.V.: Broad Product Portfolio with Market Penetration
NXP’s moat stems from its diversified semiconductor offerings and established OEM relationships. It delivers solid gross margins (54%) and EBIT margins (25%), though ROIC trends downward, signaling margin pressure in 2026 amid intensifying competition.
CEVA, Inc.: IP Licensing with High Gross Margins but Profitability Challenges
CEVA’s moat relies on intellectual property licensing for wireless and AI DSPs, evident in its exceptional gross margin (88%). Yet, negative net margins and steep ROIC decline highlight value destruction risks, despite recent revenue growth and expanding market niches.
Verdict: Product Breadth vs. IP Licensing Resilience
NXP’s diversified product base offers a wider moat than CEVA’s narrow IP licensing model, which suffers from profitability erosion. I see NXP better positioned to defend market share through scale and integration.
Which stock offers better returns?
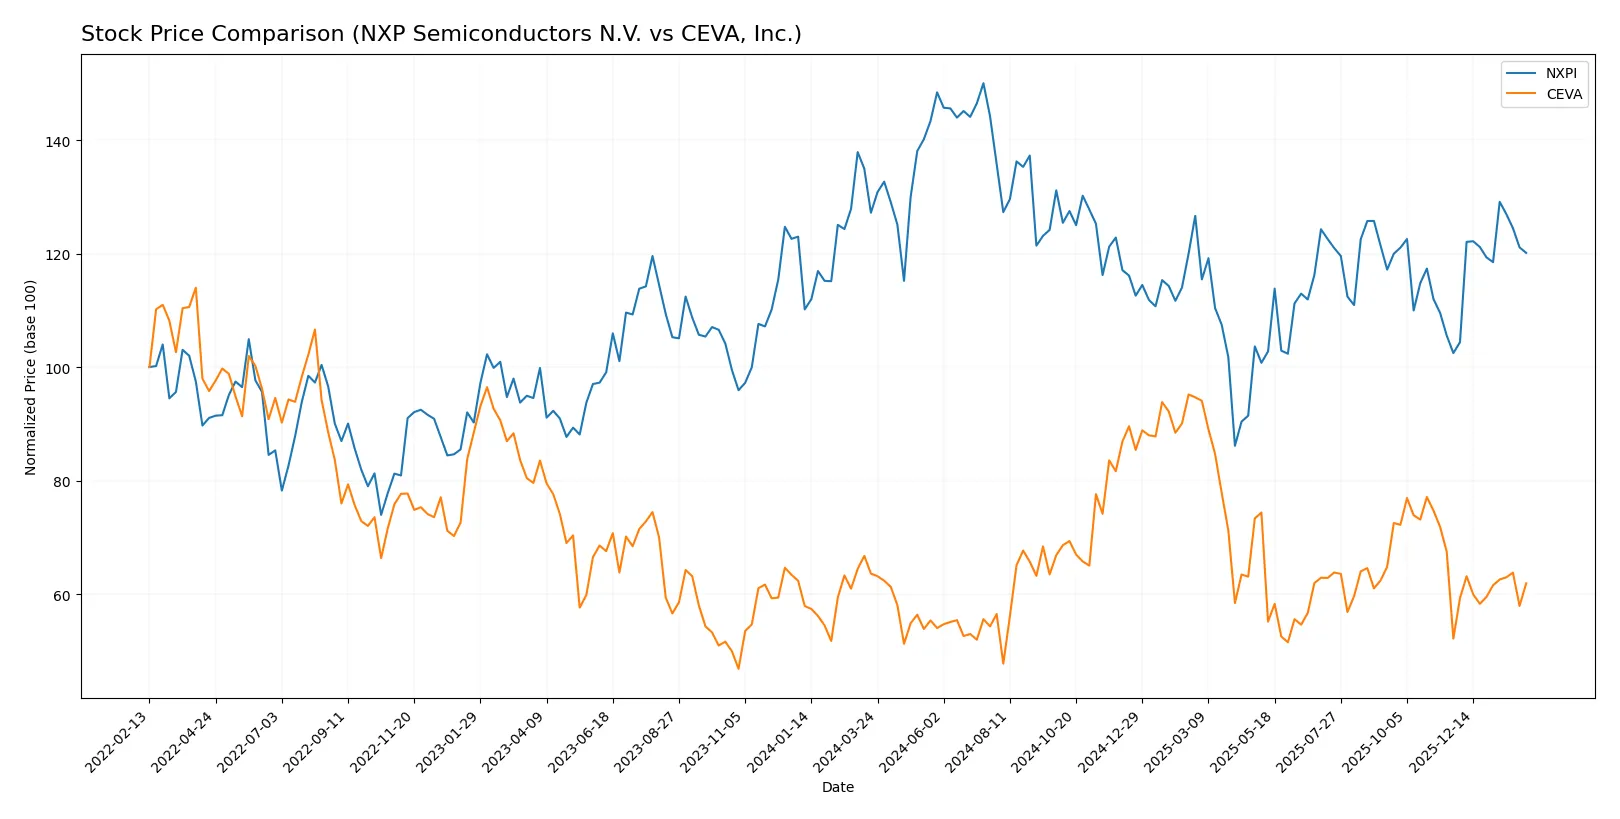
Over the past 12 months, both NXP Semiconductors N.V. and CEVA, Inc. experienced bearish trends with accelerating declines, followed by notable recent rebounds in price performance.
Trend Comparison
NXP Semiconductors N.V. posted a 5.57% price decline over 12 months, marking a bearish trend with accelerating losses and high volatility (24.1 std deviation). Recent months showed a 17.23% rebound.
CEVA, Inc. recorded a 2.72% price decline over the same period, also bearish with accelerating losses but lower volatility (4.41 std deviation). Its recent rebound stands at 18.63%.
NXP’s larger decline contrasts with CEVA’s smaller loss, though both showed strong recent recoveries. CEVA delivered the highest overall market performance with less pronounced volatility.
Target Prices
Analysts show a positive outlook with clear target price consensus for both NXP Semiconductors N.V. and CEVA, Inc.
| Company | Target Low | Target High | Consensus |
|---|---|---|---|
| NXP Semiconductors N.V. | 215 | 280 | 250 |
| CEVA, Inc. | 28 | 28 | 28 |
NXP’s consensus target of 250 sits about 11% above its current 224 price, signaling moderate upside. CEVA’s single target at 28 implies a 24% gain potential versus its 22.54 price.

Don’t Let Luck Decide Your Entry Point
Optimize your entry points with our advanced ProRealTime indicators. You’ll get efficient buy signals with precise price targets for maximum performance. Start outperforming now!
How do institutions grade them?
NXP Semiconductors N.V. Grades
The table below summarizes recent institutional grades for NXP Semiconductors N.V.:
| Grading Company | Action | New Grade | Date |
|---|---|---|---|
| B of A Securities | Maintain | Buy | 2026-02-04 |
| Truist Securities | Maintain | Buy | 2026-02-04 |
| Citigroup | Maintain | Buy | 2026-02-04 |
| Evercore ISI Group | Maintain | Outperform | 2026-02-04 |
| Mizuho | Maintain | Outperform | 2026-02-04 |
| JP Morgan | Maintain | Neutral | 2026-02-04 |
| Needham | Maintain | Buy | 2026-02-03 |
| Citigroup | Maintain | Buy | 2026-01-15 |
| Wells Fargo | Maintain | Overweight | 2026-01-15 |
| Truist Securities | Maintain | Buy | 2025-12-19 |
CEVA, Inc. Grades
Below is a summary of the most recent institutional grades for CEVA, Inc.:
| Grading Company | Action | New Grade | Date |
|---|---|---|---|
| Barclays | Maintain | Overweight | 2025-11-12 |
| Rosenblatt | Maintain | Buy | 2025-11-11 |
| Rosenblatt | Maintain | Buy | 2025-08-14 |
| Oppenheimer | Maintain | Outperform | 2025-05-09 |
| Rosenblatt | Maintain | Buy | 2025-05-08 |
| Barclays | Maintain | Overweight | 2025-05-08 |
| Rosenblatt | Maintain | Buy | 2025-04-23 |
| Barclays | Maintain | Overweight | 2025-02-14 |
| Rosenblatt | Maintain | Buy | 2025-02-14 |
| Rosenblatt | Maintain | Buy | 2025-02-11 |
Which company has the best grades?
NXP Semiconductors N.V. has consistently received strong Buy and Outperform ratings from multiple top-tier institutions. CEVA, Inc. also holds positive Buy and Overweight grades but with slightly less recent activity. Investors might view NXP’s grades as reflecting stronger analyst confidence.
Risks specific to each company
The following categories identify critical pressure points and systemic threats facing both firms in the 2026 market environment:
1. Market & Competition
NXP Semiconductors N.V.
- Dominates in automotive and IoT semiconductors with broad product portfolio.
CEVA, Inc.
- Faces intense competition as a licensor in wireless and AI DSP technologies, with smaller scale.
2. Capital Structure & Debt
NXP Semiconductors N.V.
- High debt-to-equity ratio (1.22) poses leverage risk despite strong interest coverage.
CEVA, Inc.
- Minimal debt (D/E 0.02) offers financial flexibility and low leverage risk.
3. Stock Volatility
NXP Semiconductors N.V.
- Beta 1.46 indicates above-market volatility; price range wide at $148–255.
CEVA, Inc.
- Higher beta 1.50 suggests even greater sensitivity to market swings; price range $18–39.
4. Regulatory & Legal
NXP Semiconductors N.V.
- Global footprint exposes it to complex trade regulations and export controls.
CEVA, Inc.
- Licensing model reduces direct regulatory risks but depends on partners’ compliance.
5. Supply Chain & Operations
NXP Semiconductors N.V.
- Complex global supply chain vulnerable to geopolitical disruptions and component shortages.
CEVA, Inc.
- Less exposed to physical supply chain risks due to IP licensing business model.
6. ESG & Climate Transition
NXP Semiconductors N.V.
- Larger operational footprint demands aggressive ESG compliance and climate risk management.
CEVA, Inc.
- Smaller scale eases ESG burden but limits influence on broader sustainability trends.
7. Geopolitical Exposure
NXP Semiconductors N.V.
- Operations in China, Europe, US increase exposure to US-China tensions and trade wars.
CEVA, Inc.
- Primarily US-based, less directly affected by international geopolitical conflicts.
Which company shows a better risk-adjusted profile?
NXP’s greatest risk is leverage amid a capital-intensive global semiconductor market, increasing vulnerability in downturns. CEVA’s primary risk is persistent unprofitability and weak coverage, threatening long-term viability. Despite higher volatility, NXP’s scale and financial strength grant it a superior risk-adjusted profile. Notably, CEVA’s negative net margin and zero interest coverage highlight urgent financial stress.
Final Verdict: Which stock to choose?
NXP Semiconductors N.V. (NXPI) stands out for its operational strength and robust profitability, demonstrating an ability to generate solid returns despite recent margin pressures. Its point of vigilance lies in a declining ROIC trend and elevated leverage, which could signal challenges in capital efficiency. NXPI suits investors focused on aggressive growth with a tolerance for moderate risk.
CEVA, Inc. (CEVA) leverages a niche in semiconductor IP with a strategic moat built on high R&D intensity and a lightweight balance sheet. Compared to NXPI, CEVA offers a safer financial profile with minimal debt but struggles with consistent profitability and value creation. It appeals more to investors seeking growth at a reasonable price, accepting uncertainty for potential turnaround gains.
If you prioritize operational scale and proven profitability dynamics, NXPI is the compelling choice due to its established market presence and cash flow generation. However, if you seek a smaller-cap, lower-leverage play with upside from innovation and restructuring, CEVA offers better stability in capital structure, albeit with higher execution risk.
Disclaimer: Investment carries a risk of loss of initial capital. The past performance is not a reliable indicator of future results. Be sure to understand risks before making an investment decision.
Go Further
I encourage you to read the complete analyses of NXP Semiconductors N.V. and CEVA, Inc. to enhance your investment decisions: