Home > Comparison > Technology > CEVA vs NVEC
The strategic rivalry between CEVA, Inc. and NVE Corporation defines the current trajectory of the semiconductor industry. CEVA operates as a technology licensor specializing in wireless connectivity and AI processors, while NVE manufactures spintronic sensors and couplers for industrial and medical applications. This analysis pits CEVA’s platform licensing model against NVE’s niche manufacturing focus to determine which offers superior risk-adjusted returns for a diversified portfolio.
Table of contents
Companies Overview
Two niche players in the semiconductor sector drive innovation through advanced sensor and connectivity technologies.
CEVA, Inc.: Leader in Wireless Connectivity Licensing
CEVA, Inc. commands a strong position as a licensor of wireless connectivity and smart sensing IP. It generates revenue by licensing DSP cores, AI processors, and wireless platforms to semiconductor and OEM companies globally. In 2026, CEVA sharpens its focus on integrated IP solutions for 5G, AI, and IoT markets, targeting mobile, automotive, and industrial applications.
NVE Corporation: Pioneer in Spintronic Sensor Technology
NVE Corporation specializes in spintronic devices that leverage electron spin to enable advanced sensing and data transmission. Its core revenue derives from manufacturing magnetic sensors and couplers for factory automation, medical, and industrial IoT markets. NVE’s 2026 strategy emphasizes expanding custom sensors and licensing spintronic MRAM technology to capture emerging industrial and medical applications.
Strategic Collision: Similarities & Divergences
Both firms innovate within the semiconductor niche but diverge in approach: CEVA operates a licensing model for broad connectivity IP, while NVE develops proprietary hardware spintronic sensors. They primarily compete in IoT and industrial automation, yet CEVA targets a diverse OEM base, whereas NVE focuses on specialized sensor markets. Their investment profiles reflect this contrast between scalable IP licensing and focused device manufacturing.
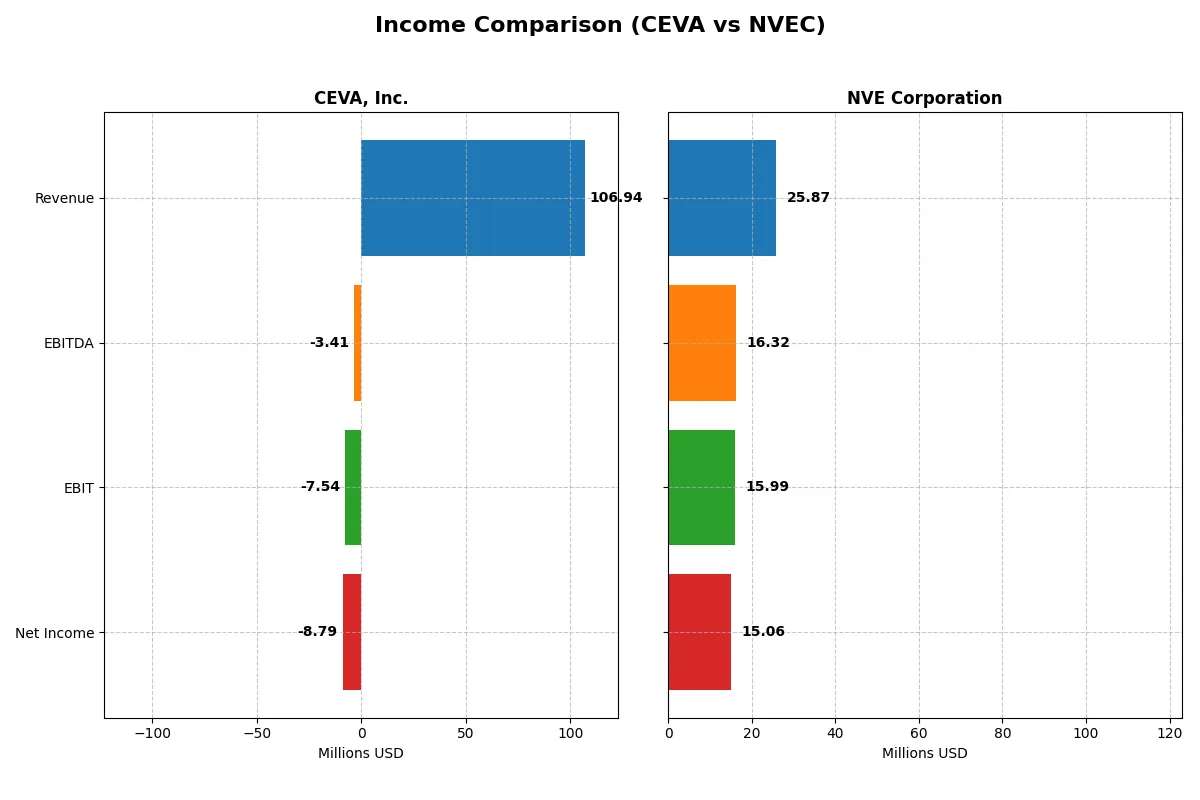
Income Statement Comparison
This data dissects the core profitability and scalability of both corporate engines to reveal who dominates the bottom line:
| Metric | CEVA, Inc. (CEVA) | NVE Corporation (NVEC) |
|---|---|---|
| Revenue | 107M | 26M |
| Cost of Revenue | 13M | 4.2M |
| Operating Expenses | 102M | 5.6M |
| Gross Profit | 94M | 22M |
| EBITDA | -3.4M | 16M |
| EBIT | -7.5M | 16M |
| Interest Expense | 0 | 0 |
| Net Income | -8.8M | 15M |
| EPS | -0.37 | 3.12 |
| Fiscal Year | 2024 | 2025 |
Income Statement Analysis: The Bottom-Line Duel
This income statement comparison reveals which company runs a more efficient and profitable corporate engine in the current market environment.
CEVA, Inc. Analysis
CEVA’s revenue edged up 9.8% in 2024, reaching $107M, but it still posted a net loss of $8.8M. Its gross margin remains strong at 88%, reflecting solid cost control. However, the negative EBIT margin of -7.1% highlights ongoing operational inefficiencies, though recent margin improvements signal early signs of recovery.
NVE Corporation Analysis
NVE’s revenue slipped 13.2% to $26M in fiscal 2025, yet it sustained a robust net income of $15.1M and a stellar net margin of 58%. The company maintains healthy gross margins above 83%, and despite recent revenue softness, it delivers strong EBIT margins near 62%, underscoring operational excellence and capital efficiency.
Margin Strength vs. Revenue Momentum
NVE clearly dominates on profitability and margins, posting consistent net income growth and high returns on revenue despite recent sales declines. CEVA shows promising revenue growth and margin recovery but remains unprofitable, weighed down by high operating expenses. Investors seeking steady profits should watch NVE; those favoring turnaround potential might track CEVA’s improving margins.
Financial Ratios Comparison
These vital ratios act as a diagnostic tool to expose the underlying fiscal health, valuation premiums, and capital efficiency of the companies compared below:
| Ratios | CEVA, Inc. (CEVA) | NVE Corporation (NVEC) |
|---|---|---|
| ROE | -3.3% (2024) | 24.2% (2025) |
| ROIC | -2.7% (2024) | 21.1% (2025) |
| P/E | -84.8 (2024) | 20.5 (2025) |
| P/B | 2.79 (2024) | 4.95 (2025) |
| Current Ratio | 7.09 (2024) | 28.40 (2025) |
| Quick Ratio | 7.09 (2024) | 22.03 (2025) |
| D/E | 0.021 (2024) | 0.015 (2025) |
| Debt-to-Assets | 1.8% (2024) | 1.4% (2025) |
| Interest Coverage | 0 (2024) | 0 (2025) |
| Asset Turnover | 0.35 (2024) | 0.40 (2025) |
| Fixed Asset Turnover | 8.43 (2024) | 8.91 (2025) |
| Payout ratio | 0% (2024) | 128% (2025) |
| Dividend yield | 0% (2024) | 6.28% (2025) |
| Fiscal Year | 2024 | 2025 |
Efficiency & Valuation Duel: The Vital Signs
Financial ratios serve as a company’s DNA, unveiling operational strengths and hidden risks that guide prudent investment decisions.
CEVA, Inc.
CEVA displays weak profitability with a negative ROE of -3.3% and operating margins under pressure, signaling operational challenges. Its valuation appears attractive with a negative P/E, yet the high EV/Sales ratio of 6.85 suggests premium pricing. The firm lacks dividends, instead reinvesting heavily in R&D, which accounts for 67% of revenue, aiming for future growth despite current losses.
NVE Corporation
NVE demonstrates robust profitability, posting a strong ROE of 24.2% and a net margin exceeding 58%, reflecting operational efficiency. Its P/E ratio near 20.5 reflects a neutral valuation, though the price-to-book at 4.95 is stretched. NVE returns value via a 6.3% dividend yield and maintains solid cash flow, balancing growth with shareholder income effectively.
Operational Efficiency vs. Valuation Discipline
NVE leads with superior profitability and a balanced shareholder return profile, despite a higher valuation multiple. CEVA’s undervalued stock masks persistent operational losses and no dividend, relying on extensive R&D investment. Investors seeking reliable returns may prefer NVE’s profile, while those accepting higher risk might consider CEVA’s growth focus.
Which one offers the Superior Shareholder Reward?
I compare CEVA, Inc. and NVE Corporation’s shareholder rewards through dividend yields, payout ratios, and buyback intensity. CEVA pays no dividends and has negligible buybacks, focusing on reinvestment amid persistent net losses. NVE offers a solid 4.5%-6.3% dividend yield with payout ratios around 85%-165%, supported by robust free cash flow of ~3B per year. NVE’s consistent buybacks complement dividends, bolstering total returns. CEVA’s lack of distributions and negative profits raise sustainability concerns. I conclude NVE Corporation delivers superior, sustainable shareholder rewards in 2026.
Comparative Score Analysis: The Strategic Profile
The radar chart reveals the fundamental DNA and trade-offs of CEVA, Inc. and NVE Corporation, highlighting their core financial strengths and weaknesses:
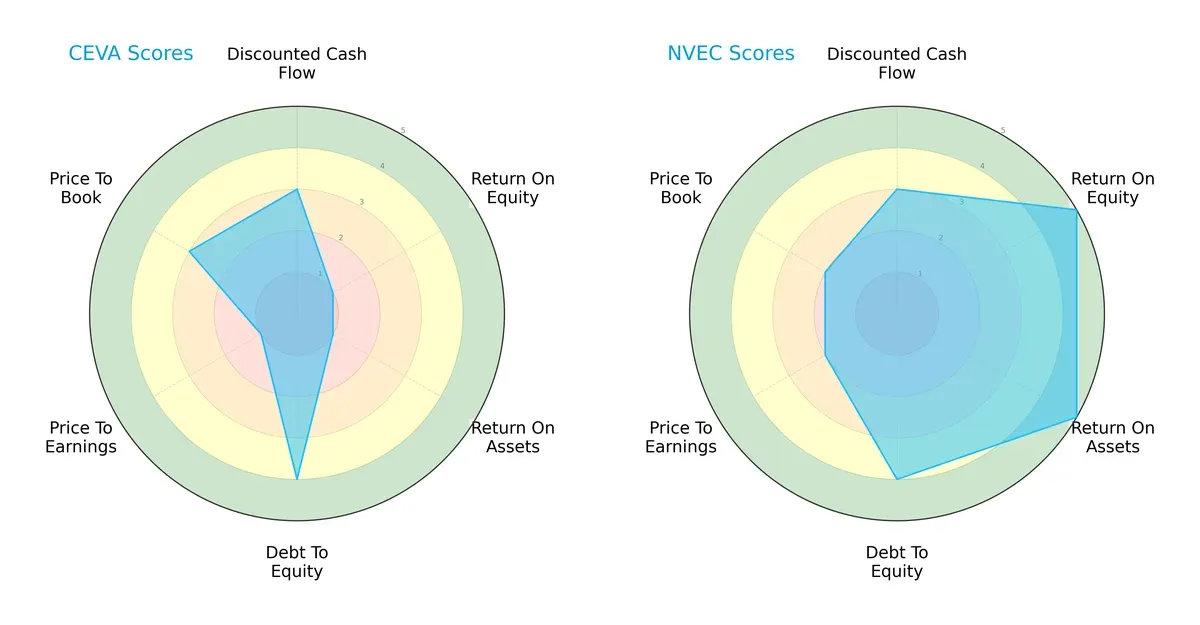
NVE Corporation demonstrates a notably balanced profile with very favorable ROE and ROA scores of 5, indicating superior profitability and asset efficiency. CEVA lags with very unfavorable returns (scores 1), but it maintains a favorable debt-to-equity score of 4, matching NVE’s financial leverage discipline. CEVA’s valuation metrics (PE score 1) signal potential overvaluation risks, contrasting with NVE’s moderate valuation scores. Overall, NVE dominates through operational excellence, while CEVA relies heavily on prudent leverage management.
Bankruptcy Risk: Solvency Showdown
The Altman Z-Score gap strongly favors NVE, with a robust 120.4 versus CEVA’s 10.8, both well within the safe zone but reflecting vastly different financial fortitudes in this cycle:
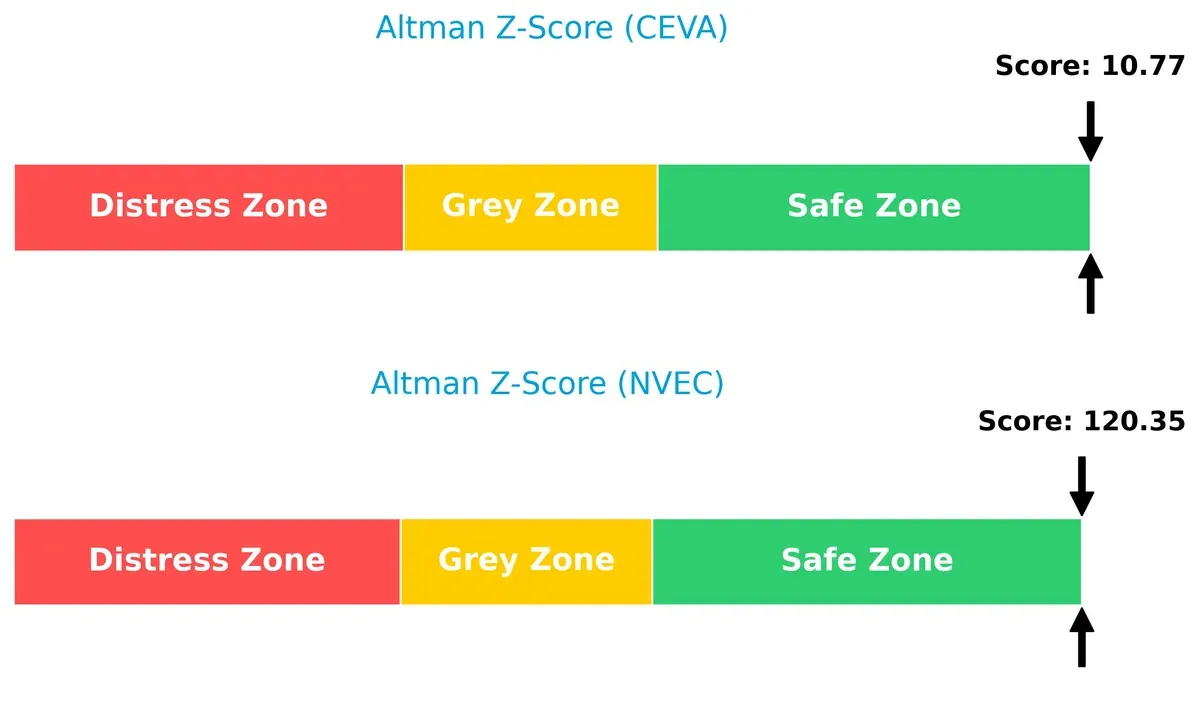
NVE’s extraordinary score underscores rock-solid solvency and minimal bankruptcy risk over the long term. CEVA’s score, while safe, is significantly lower, suggesting more modest resilience to economic shocks.
Financial Health: Quality of Operations
Both companies score in the average range on the Piotroski F-Score, with NVE slightly ahead at 5 versus CEVA’s 4, reflecting comparable but moderate internal financial health:
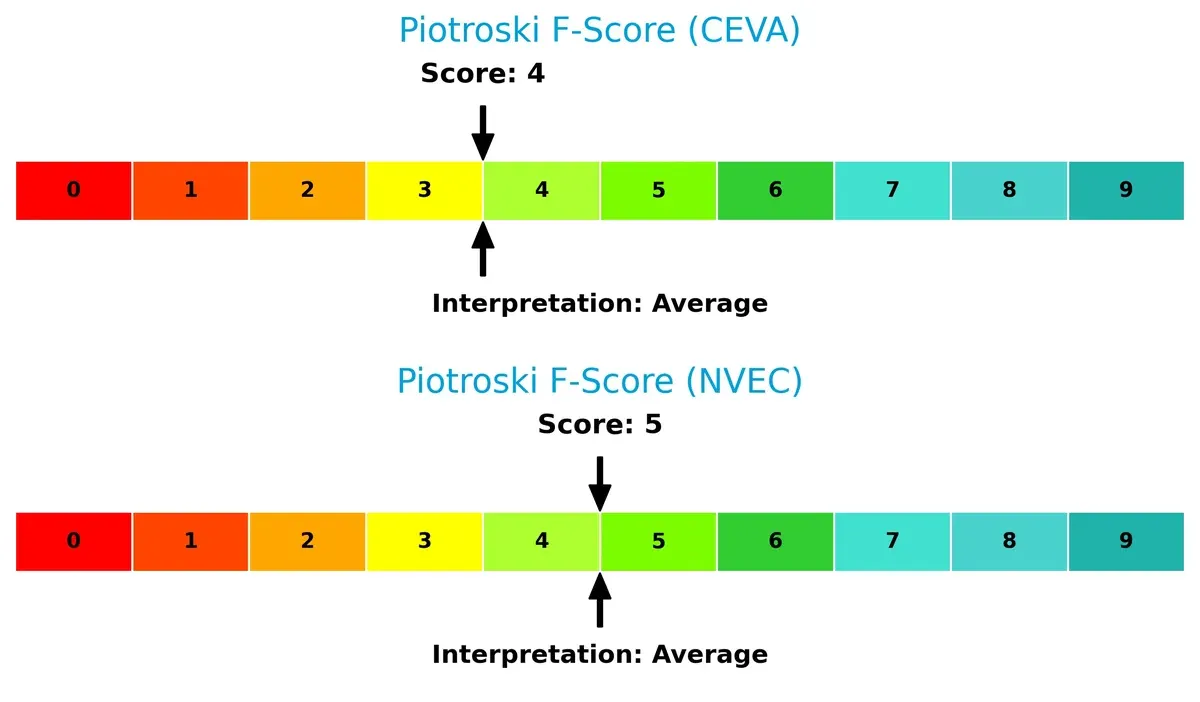
Neither company exhibits peak financial health. However, CEVA’s lower score flags potential red flags in profitability or liquidity relative to NVE, which maintains steadier operational quality. Investors should monitor these metrics closely for signs of improvement or deterioration.
How are the two companies positioned?
This section dissects CEVA and NVEC’s operational DNA by comparing revenue distribution and internal dynamics. We confront their economic moats to identify which model offers the most resilient, sustainable advantage today.
Revenue Segmentation: The Strategic Mix
This visual comparison dissects how CEVA, Inc. and NVE Corporation diversify their income streams and reveals where their primary sector bets lie:
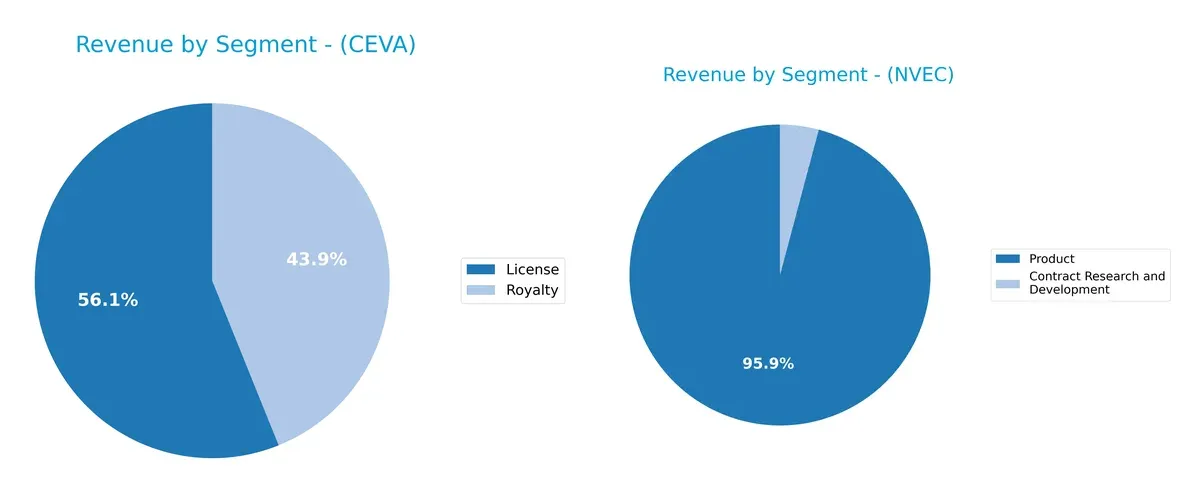
CEVA pivots between licensing and royalties, with $60M in License and $47M in Royalty revenues in 2024, showing a dual income stream. NVE leans heavily on its Product segment, $26B in 2022, dwarfing its smaller $1.1M Contract Research revenue. CEVA’s balanced model reduces concentration risk, while NVE’s Product dominance suggests infrastructure focus but potential vulnerability to market shifts in product demand.
Strengths and Weaknesses Comparison
This table compares the strengths and weaknesses of CEVA, Inc. and NVE Corporation:
CEVA Strengths
- Diverse product segments including Licensing and Royalty revenue streams
- Strong presence in Asia Pacific and China markets
- Low debt-to-assets ratio at 1.8%
- Favorable quick ratio of 7.09
- High fixed asset turnover of 8.43
NVEC Strengths
- High profitability with net margin of 58.22% and ROE of 24.19%
- Strong return on invested capital at 21.14%
- Favorable debt metrics and infinite interest coverage
- Diverse revenue from Products and Contract R&D
- Wide geographic reach including U.S. and Europe
CEVA Weaknesses
- Negative profitability metrics including net margin (-8.22%) and ROIC (-2.68%)
- Unfavorable asset turnover at 0.35
- Zero dividend yield
- Unfavorable interest coverage at 0
- High current ratio at 7.09 indicating possible inefficient asset use
NVEC Weaknesses
- Unfavorable price-to-book ratio of 4.95
- Very high current ratio at 28.4 suggesting over-liquid balance sheet
- Unfavorable asset turnover at 0.4
- Neutral dividend yield of 6.28% may limit income focus
CEVA shows strength in geographic diversification and low leverage but struggles with profitability and operational efficiency. NVEC exhibits robust profitability and financial health but faces concerns over asset utilization and valuation metrics. These profiles suggest contrasting strategic priorities for each company.
The Moat Duel: Analyzing Competitive Defensibility
A structural moat alone protects long-term profits from relentless competition and market pressures. Here’s how CEVA, Inc. and NVE Corporation defend their turf:
CEVA, Inc.: Licensing Power with Narrow Margins
CEVA’s moat stems from intangible assets—its patented DSP and AI processor IP licensing. This shows up in strong gross margins (88%) but weak EBIT (-7%) and net margins (-8%). The 2024 data reveals value destruction with declining ROIC versus WACC. New AI and IoT platforms could deepen the moat if profitability improves, but current trends warn caution.
NVE Corporation: Spintronics Innovation with Solid Returns
NVE’s moat rests on proprietary spintronic technology—a rare and complex innovation unlike CEVA’s licensing model. It commands high profitability with EBIT margins over 61% and net margins above 58%. ROIC comfortably exceeds WACC and grows steadily. While recent revenue slipped, long-term growth and niche medical and industrial IoT markets offer expansion opportunities.
Verdict: Proprietary Innovation vs. Licensing Model
NVE’s moat is deeper and more durable, driven by proprietary spintronic tech yielding high returns and consistent value creation. CEVA’s moat is narrower, challenged by negative profitability and eroding capital efficiency. NVE stands better positioned to defend and expand its market share in 2026.
Which stock offers better returns?
The past year reveals contrasting stock trajectories, with both CEVA, Inc. and NVE Corporation experiencing significant price shifts and evolving trading dynamics.
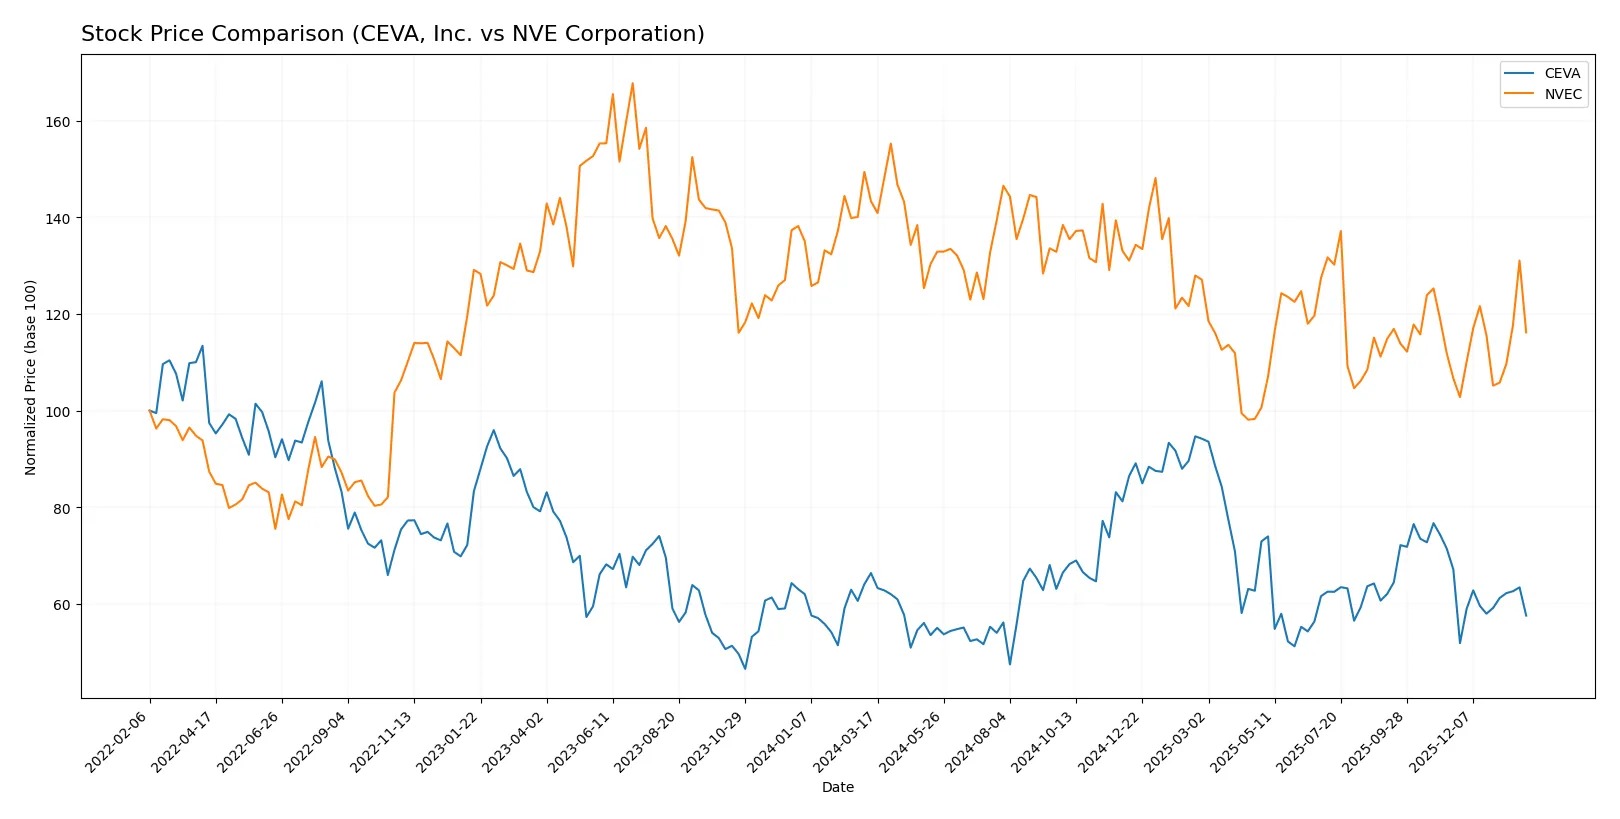
Trend Comparison
CEVA, Inc. shows a bearish trend with a -13.25% price decline over the past 12 months. The trend accelerates downward despite a recent -14.16% drop, reflecting sustained selling pressure and a high volatility of 4.4%.
NVE Corporation recorded a steeper bearish trend, falling -18.93% over the same period. However, recent trading indicates an 8.94% rebound with accelerating upward momentum and higher volatility at 7.6%, suggesting potential recovery signs.
Comparatively, CEVA’s larger overall price stability contrasts with NVEC’s sharper decline and recent turnaround. NVEC’s recent positive momentum surpasses CEVA’s continued weakness, delivering the higher market performance in the latest months.
Target Prices
CEVA, Inc. shows a clear target consensus from analysts, indicating strong conviction on its valuation.
| Company | Target Low | Target High | Consensus |
|---|---|---|---|
| CEVA, Inc. | 28 | 28 | 28 |
Analysts expect CEVA’s stock to rise from its current $21.09 price to $28, signaling roughly 33% upside potential. No verified target price data is available from recognized analysts for NVE Corporation.

Don’t Let Luck Decide Your Entry Point
Optimize your entry points with our advanced ProRealTime indicators. You’ll get efficient buy signals with precise price targets for maximum performance. Start outperforming now!
How do institutions grade them?
Institutional grades provide insight into analyst sentiment for each company:
CEVA, Inc. Grades
The table below summarizes recent grades from credible institutional analysts for CEVA, Inc.:
| Grading Company | Action | New Grade | Date |
|---|---|---|---|
| Barclays | Maintain | Overweight | 2025-11-12 |
| Rosenblatt | Maintain | Buy | 2025-11-11 |
| Rosenblatt | Maintain | Buy | 2025-08-14 |
| Oppenheimer | Maintain | Outperform | 2025-05-09 |
| Rosenblatt | Maintain | Buy | 2025-05-08 |
| Barclays | Maintain | Overweight | 2025-05-08 |
| Rosenblatt | Maintain | Buy | 2025-04-23 |
| Barclays | Maintain | Overweight | 2025-02-14 |
| Rosenblatt | Maintain | Buy | 2025-02-14 |
| Rosenblatt | Maintain | Buy | 2025-02-11 |
Which company has the best grades?
CEVA, Inc. holds consistent Buy and Overweight ratings from reputable firms, while NVE Corporation lacks institutional grades. This suggests stronger analyst conviction and may influence investor confidence.
Risks specific to each company
The following categories identify the critical pressure points and systemic threats facing both firms in the 2026 market environment:
1. Market & Competition
CEVA, Inc.
- Faces intense competition in wireless connectivity and AI processors, with pressure from larger semiconductor licensors.
NVE Corporation
- Operates in niche spintronics market, limiting direct competition but facing challenges scaling industrial IoT adoption.
2. Capital Structure & Debt
CEVA, Inc.
- Extremely low debt (D/E 0.02) reduces financial risk, but interest coverage at zero signals vulnerability in earnings to cover interest.
NVE Corporation
- Maintains minimal debt (D/E 0.01) and infinite interest coverage, reflecting strong financial stability and low leverage risk.
3. Stock Volatility
CEVA, Inc.
- Beta of 1.44 indicates higher volatility than market average, increasing investment risk during economic downturns.
NVE Corporation
- Beta of 1.20 shows moderate volatility, more resilient to market swings compared to CEVA.
4. Regulatory & Legal
CEVA, Inc.
- Subject to evolving tech licensing laws and export controls affecting semiconductor IP dissemination globally.
NVE Corporation
- Faces regulatory scrutiny in medical device sensor markets and industrial IoT, with potential for compliance costs.
5. Supply Chain & Operations
CEVA, Inc.
- Relies on global semiconductor supply chains vulnerable to geopolitical disruptions and component shortages.
NVE Corporation
- Smaller scale and specialized product line reduce supply chain complexity but limit operational flexibility.
6. ESG & Climate Transition
CEVA, Inc.
- Needs to enhance ESG disclosures and climate risk management amid rising investor pressure in tech sector.
NVE Corporation
- Faces moderate ESG risks; smaller footprint but must address sustainability in industrial IoT and medical applications.
7. Geopolitical Exposure
CEVA, Inc.
- Significant exposure to US-China tech tensions affecting licensing and sales in major markets.
NVE Corporation
- Limited direct exposure but vulnerable to broader trade policies impacting US manufacturing and exports.
Which company shows a better risk-adjusted profile?
CEVA’s primary risk lies in weak profitability and earnings coverage despite low debt, making it vulnerable in downturns. NVE’s main risk is its niche market scale, but it boasts strong profitability and financial stability. NVE’s moderate volatility and solid debt metrics yield a superior risk-adjusted profile. The stark contrast in net margin—CEVA’s negative versus NVE’s 58%+—justifies concern over CEVA’s operational resilience.
Final Verdict: Which stock to choose?
CEVA, Inc. impresses with its relentless investment in R&D, fueling innovation that could reshape its market niche. However, its declining profitability and value destruction are points of vigilance. CEVA might suit aggressive growth portfolios willing to endure volatility for potential turnaround gains.
NVE Corporation’s strategic moat lies in its strong capital efficiency and durable competitive advantage, reflected in robust returns and cash flow quality. It offers better financial stability than CEVA, fitting well within GARP portfolios that balance growth prospects with reasonable risk.
If you prioritize dynamic innovation and potential rebound, CEVA could be compelling despite its current financial strain. However, if you seek sustainable profitability and a proven value creator, NVE outshines with superior stability and a durable economic moat. Each scenario demands prudent risk tolerance aligned with your investment strategy.
Disclaimer: Investment carries a risk of loss of initial capital. The past performance is not a reliable indicator of future results. Be sure to understand risks before making an investment decision.
Go Further
I encourage you to read the complete analyses of CEVA, Inc. and NVE Corporation to enhance your investment decisions: