In the fast-evolving semiconductor sector, Nova Ltd. and CEVA, Inc. stand out as key players driving innovation and technological advancement. While Nova focuses on advanced process control systems essential for semiconductor manufacturing, CEVA specializes in licensing cutting-edge wireless connectivity and AI processing technologies. Their overlapping industry and distinct innovation strategies make them compelling candidates for investors seeking growth in tech. Let’s explore which company offers the more promising investment opportunity.

Table of contents
Companies Overview
I will begin the comparison between Nova Ltd. and CEVA, Inc. by providing an overview of these two companies and their main differences.
Nova Ltd. Overview
Nova Ltd. specializes in designing and manufacturing process control systems for semiconductor fabrication, operating globally including in Israel, Taiwan, the US, China, and Korea. Its offerings cover metrology platforms for various semiconductor process steps, serving sectors such as logic, foundries, and memory manufacturers. Founded in 1993 and based in Rehovot, Israel, Nova is a key player in semiconductor process control with a market cap of approximately 12.9B USD.
CEVA, Inc. Overview
CEVA, Inc. licenses wireless connectivity and smart sensing IP, including DSPs, AI processors, and software for applications across mobile, IoT, automotive, and industrial sectors. Headquartered in Rockville, Maryland, and founded in 1999, CEVA focuses on licensing technology to chip manufacturers and OEMs globally. It has a market cap near 536M USD and enables integration of advanced wireless and sensing solutions via direct sales.
Key similarities and differences
Both companies operate in the semiconductor sector but occupy different niches: Nova focuses on process control hardware for semiconductor manufacturing, while CEVA provides intellectual property licensing for wireless and sensing technologies. Nova’s business model emphasizes product sales and manufacturing equipment, whereas CEVA primarily generates revenue through licensing its IP and software to semiconductor and OEM clients. Their geographic footprints and scale also differ significantly, with Nova being larger and more manufacturing-oriented.
Income Statement Comparison
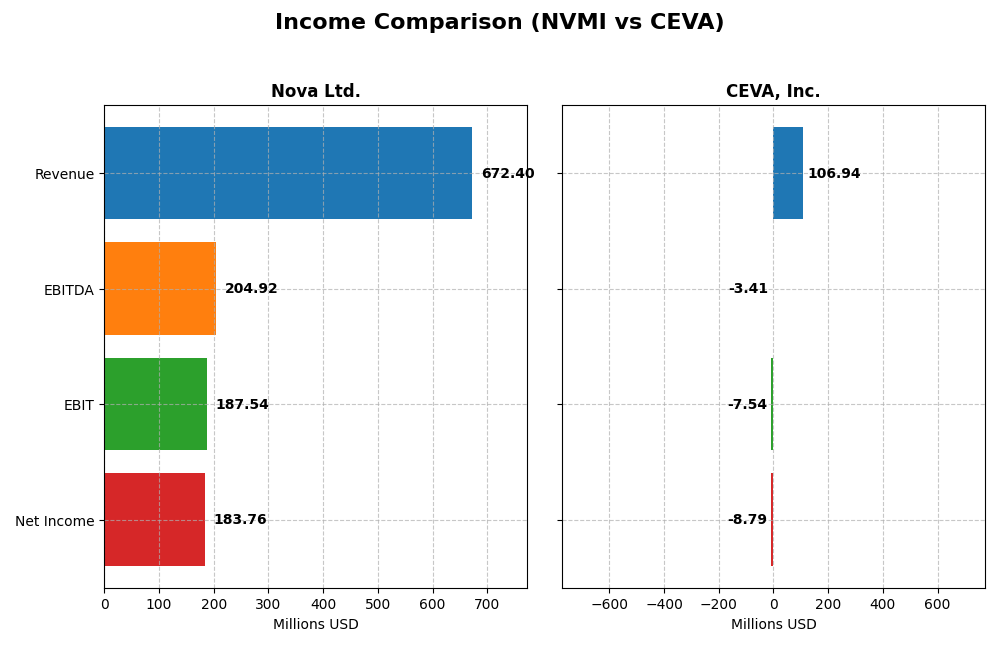
This table compares key income statement metrics for Nova Ltd. and CEVA, Inc. for the fiscal year 2024, highlighting their financial performance in the semiconductor industry.
| Metric | Nova Ltd. (NVMI) | CEVA, Inc. (CEVA) |
|---|---|---|
| Market Cap | 12.9B | 536M |
| Revenue | 672M | 107M |
| EBITDA | 205M | -3.4M |
| EBIT | 188M | -7.5M |
| Net Income | 184.9M | -8.8M |
| EPS | 6.31 | -0.37 |
| Fiscal Year | 2024 | 2024 |
Income Statement Interpretations
Nova Ltd.
Nova Ltd. exhibited strong growth in revenue and net income from 2020 to 2024, with revenue surging nearly 150% and net income nearly tripling. Margins remained robust, with a gross margin around 57.6% and a net margin exceeding 27% in 2024. The latest fiscal year showed continued revenue growth of 29.8% and stable margin improvements, reflecting solid operational efficiency.
CEVA, Inc.
CEVA, Inc. showed modest revenue growth of 6.6% over the 2020–2024 period but experienced a significant decline in net income, turning negative. While gross margins remained high at 88%, EBIT and net margins were negative in 2024, indicating ongoing profitability challenges. The most recent year saw a 9.8% revenue increase and improvements in EBIT and net margin, though overall profitability remains weak.
Which one has the stronger fundamentals?
Comparing fundamentals, Nova Ltd. demonstrates stronger and more consistent profitability with favorable growth and margin metrics. CEVA, despite favorable gross margin and recent revenue growth, struggles with negative net income and margins, reflecting weaker earnings quality. Thus, Nova Ltd. presents a more solid income statement profile based on the available data.
Financial Ratios Comparison
This table presents a side-by-side comparison of key financial ratios for Nova Ltd. (NVMI) and CEVA, Inc. (CEVA) based on their most recent full fiscal year data for 2024.
| Ratios | Nova Ltd. (NVMI) | CEVA, Inc. (CEVA) |
|---|---|---|
| ROE | 19.81% | -3.30% |
| ROIC | 13.39% | -2.68% |
| P/E | 31.20 | -84.79 |
| P/B | 6.18 | 2.79 |
| Current Ratio | 2.32 | 7.09 |
| Quick Ratio | 1.92 | 7.09 |
| D/E (Debt-to-Equity) | 0.25 | 0.02 |
| Debt-to-Assets | 17.0% | 1.8% |
| Interest Coverage | 116.20 | 0 |
| Asset Turnover | 0.48 | 0.35 |
| Fixed Asset Turnover | 5.06 | 8.43 |
| Payout Ratio | 0 | 0 |
| Dividend Yield | 0 | 0 |
Interpretation of the Ratios
Nova Ltd.
Nova Ltd. shows a generally strong financial profile with favorable net margin at 27.33%, ROE at 19.81%, and ROIC at 13.39%, though its WACC, P/E, and P/B ratios are less favorable. Liquidity and solvency ratios are robust, including a current ratio of 2.32 and low debt levels. The company does not pay dividends, likely due to a reinvestment strategy focused on growth and R&D.
CEVA, Inc.
CEVA, Inc. presents a challenging financial situation with unfavorable net margin (-8.22%), ROE (-3.3%), and ROIC (-2.68%), indicating profitability issues. The company maintains low debt and a strong quick ratio but suffers from zero interest coverage and a negative earnings yield. CEVA does not pay dividends, possibly reflecting its negative net income and prioritization of R&D investment.
Which one has the best ratios?
Based on the evaluation, Nova Ltd. holds the advantage with a favorable overall ratio profile, including strong profitability, liquidity, and capital management metrics. CEVA, Inc. faces significant headwinds with mostly unfavorable profitability and coverage ratios, which impact its overall financial health negatively compared to Nova Ltd.
Strategic Positioning
This section compares the strategic positioning of Nova Ltd. and CEVA, Inc. in terms of Market position, Key segments, and Exposure to technological disruption:
Nova Ltd.
- Leading in semiconductor process control systems with global presence and competitive pressure.
- Focused on metrology platforms for semiconductor manufacturing steps serving logic, foundries, memory, and equipment makers.
- Operates in a specialized semiconductor equipment niche with limited exposure to rapid tech disruptions.
CEVA, Inc.
- Licensor of wireless connectivity and smart sensing IP, facing moderate competition in semiconductor licensing.
- Licenses DSPs, AI processors, wireless platforms for mobile, IoT, automotive, and consumer electronics.
- Exposure to disruption through evolving wireless standards and AI technology in connected devices.
Nova Ltd. vs CEVA, Inc. Positioning
Nova Ltd. pursues a concentrated approach focused on semiconductor manufacturing equipment, benefiting from specialized industrial segments. CEVA adopts a diversified licensing model across wireless and sensing technologies, exposing it to broader markets but also more varied risks.
Which has the best competitive advantage?
Nova Ltd. exhibits a slightly favorable moat with growing profitability, indicating improving competitive strength. CEVA shows a very unfavorable moat with declining returns, reflecting challenges in sustaining value creation.
Stock Comparison
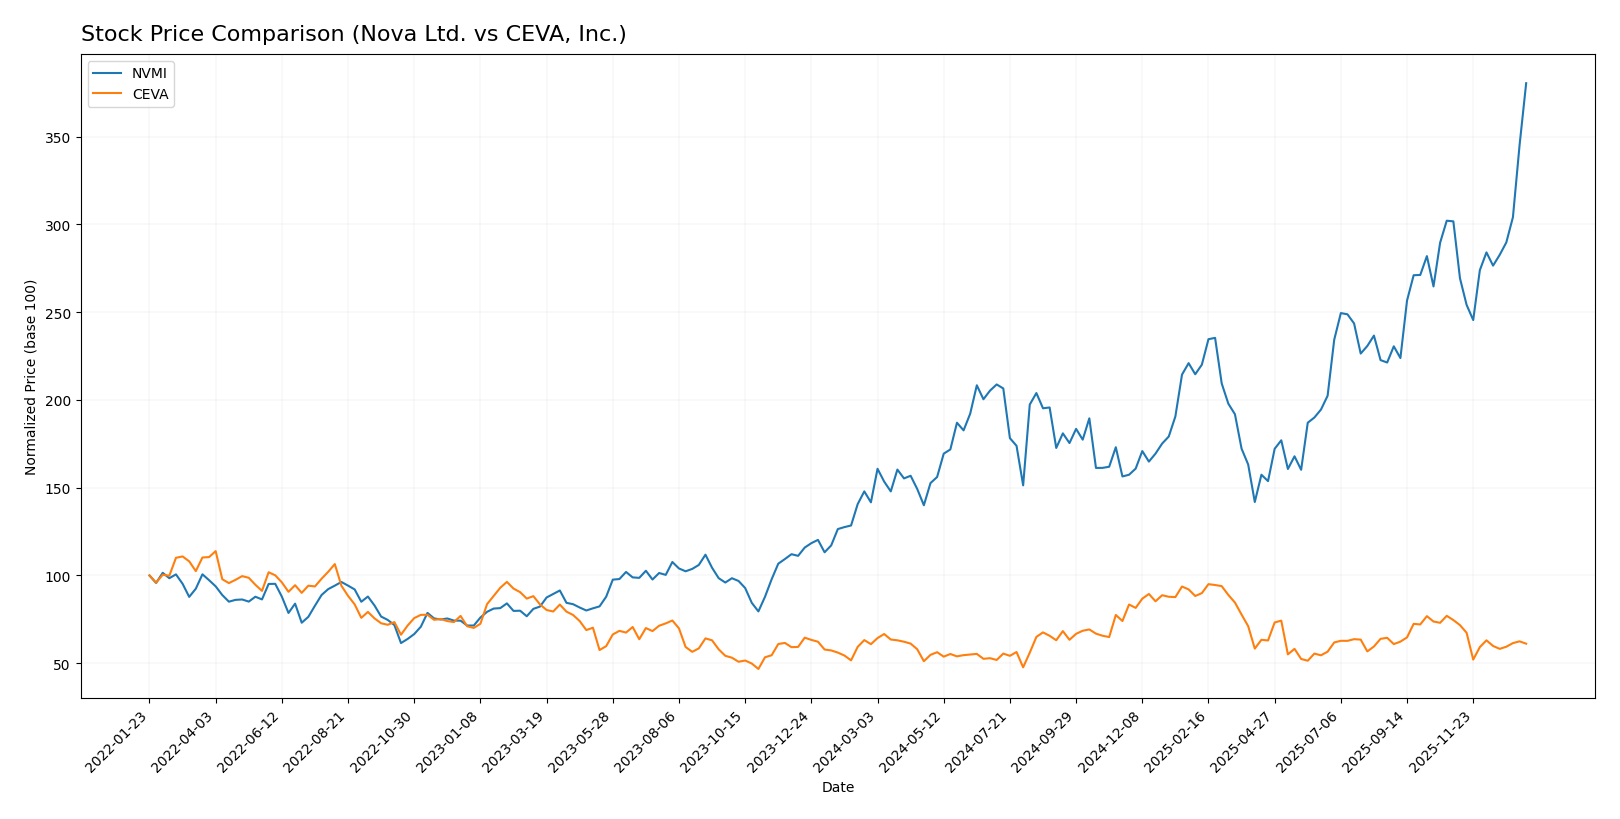
The past year revealed starkly contrasting price movements between Nova Ltd. and CEVA, Inc., highlighting a strong bullish acceleration for Nova Ltd. versus a near-neutral annual trend for CEVA amid shifting trading volumes.
Trend Analysis
Nova Ltd. (NVMI) experienced a pronounced bullish trend over the past 12 months with a 168.54% price increase and accelerating momentum, reaching a high of 434.55 and displaying significant volatility with a standard deviation of 55.86.
CEVA, Inc. (CEVA) showed a marginal 0.45% price increase over the past year, indicating a neutral trend with decelerating momentum and low volatility (std deviation 4.4), despite a recent short-term decline of -18.04%.
Comparatively, Nova Ltd. delivered the highest market performance with a clearly bullish and accelerating trend, while CEVA’s stock remained largely flat over the analyzed period.
Target Prices
Here is the current consensus of analyst target prices for selected semiconductor companies:
| Company | Target High | Target Low | Consensus |
|---|---|---|---|
| Nova Ltd. | 390 | 335 | 362.5 |
| CEVA, Inc. | 28 | 28 | 28 |
Analysts expect Nova Ltd.’s stock to trade below its current price of $434.55, indicating potential overvaluation. CEVA, Inc.’s target consensus of $28 suggests upside from its current $22.30 price, reflecting moderate growth expectations.
Analyst Opinions Comparison
This section compares analysts’ ratings and financial grades for Nova Ltd. and CEVA, Inc.:
Rating Comparison
Nova Ltd. Rating
- Rating: B-, considered very favorable by analysts.
- Discounted Cash Flow Score: Moderate at 3, indicating average valuation outlook.
- ROE Score: Favorable at 4, showing efficient profit generation from equity.
- ROA Score: Very favorable at 5, signaling excellent asset utilization.
- Debt To Equity Score: Very unfavorable at 1, reflecting higher financial risk.
- Overall Score: Moderate at 3, reflecting balanced performance with some weaknesses.
CEVA, Inc. Rating
- Rating: C+, also considered very favorable by analysts.
- Discounted Cash Flow Score: Moderate at 3, indicating average valuation outlook.
- ROE Score: Very unfavorable at 1, indicating poor profit generation efficiency.
- ROA Score: Very unfavorable at 1, signaling weak asset utilization.
- Debt To Equity Score: Favorable at 4, indicating lower financial risk.
- Overall Score: Moderate at 2, reflecting weaker overall financial performance.
Which one is the best rated?
Based strictly on the provided data, Nova Ltd. holds a higher rating (B-) and better profitability metrics (ROE and ROA) than CEVA, Inc., despite its higher financial risk indicated by a weak debt-to-equity score.
Scores Comparison
Here is a comparison of the Altman Z-Score and Piotroski Score for Nova Ltd. and CEVA, Inc.:
NVMI Scores
- Altman Z-Score: 7.76, indicating a safe zone
- Piotroski Score: 7, classified as strong
CEVA Scores
- Altman Z-Score: 9.99, indicating a safe zone
- Piotroski Score: 4, classified as average
Which company has the best scores?
Based on the provided data, CEVA shows a higher Altman Z-Score, suggesting stronger bankruptcy safety. However, Nova Ltd. has a better Piotroski Score, indicating stronger financial health. Each company excels in a different score category.
Grades Comparison
Here is the detailed comparison of recent grades assigned to Nova Ltd. and CEVA, Inc.:
Nova Ltd. Grades
The following table presents recent analyst grades for Nova Ltd.:
| Grading Company | Action | New Grade | Date |
|---|---|---|---|
| B of A Securities | Maintain | Buy | 2026-01-13 |
| Jefferies | Maintain | Buy | 2025-12-15 |
| Evercore ISI Group | Maintain | Outperform | 2025-11-07 |
| Benchmark | Maintain | Buy | 2025-11-07 |
| Cantor Fitzgerald | Maintain | Overweight | 2025-06-24 |
| B of A Securities | Maintain | Buy | 2025-06-24 |
| Benchmark | Maintain | Buy | 2025-05-09 |
| Citigroup | Maintain | Buy | 2025-05-09 |
| B of A Securities | Maintain | Buy | 2025-04-16 |
| Cantor Fitzgerald | Maintain | Overweight | 2025-03-14 |
Nova Ltd. has consistently received positive grades, predominantly Buy and Overweight, reflecting a stable favorable outlook from multiple reputable firms.
CEVA, Inc. Grades
The following table shows recent analyst grades for CEVA, Inc.:
| Grading Company | Action | New Grade | Date |
|---|---|---|---|
| Barclays | Maintain | Overweight | 2025-11-12 |
| Rosenblatt | Maintain | Buy | 2025-11-11 |
| Rosenblatt | Maintain | Buy | 2025-08-14 |
| Oppenheimer | Maintain | Outperform | 2025-05-09 |
| Rosenblatt | Maintain | Buy | 2025-05-08 |
| Barclays | Maintain | Overweight | 2025-05-08 |
| Rosenblatt | Maintain | Buy | 2025-04-23 |
| Barclays | Maintain | Overweight | 2025-02-14 |
| Rosenblatt | Maintain | Buy | 2025-02-14 |
| Rosenblatt | Maintain | Buy | 2025-02-11 |
CEVA, Inc. also shows a strong consensus with predominantly Buy and Overweight ratings, indicating a generally positive analyst sentiment.
Which company has the best grades?
Both Nova Ltd. and CEVA, Inc. have strong, consistent Buy and Overweight grades from credible firms. CEVA, Inc. has a slightly higher number of Buy ratings, potentially signaling broader analyst confidence, which may influence investor perception positively.
Strengths and Weaknesses
Below is a comparative overview of the strengths and weaknesses of Nova Ltd. (NVMI) and CEVA, Inc. (CEVA) based on recent financial and operational metrics.
| Criterion | Nova Ltd. (NVMI) | CEVA, Inc. (CEVA) |
|---|---|---|
| Diversification | Revenue mainly from Products (~538M in 2024); focused portfolio | Revenue from Licenses & Royalties (~107M in 2024); moderate diversification within IP licensing |
| Profitability | Strong net margin (27.33%), ROIC (13.39%), and ROE (19.81%) | Negative net margin (-8.22%), negative ROIC (-2.68%), and ROE (-3.3%) |
| Innovation | Growing ROIC trend (70% increase over 5 years); favorable fixed asset turnover (5.06) | Declining ROIC trend (-1156% over 5 years); high fixed asset turnover (8.43) but overall value destruction |
| Global presence | Solid financial ratios with favorable liquidity and low debt | High current and quick ratios but weak interest coverage; limited value creation globally |
| Market Share | Strong product sales growth (405M in 2023 to 538M in 2024) | License and royalty revenue growing but from a smaller base; shedding value |
Key takeaways: Nova Ltd. demonstrates improving profitability and efficient capital use, signaling a growing competitive position despite some valuation concerns. CEVA, however, struggles with negative profitability and declining returns, indicating high risk and value destruction. Investors should weigh Nova’s upward momentum against CEVA’s financial challenges carefully.
Risk Analysis
Below is a comparative table of key risks for Nova Ltd. (NVMI) and CEVA, Inc. (CEVA) based on their most recent 2024 data:
| Metric | Nova Ltd. (NVMI) | CEVA, Inc. (CEVA) |
|---|---|---|
| Market Risk | High beta at 1.83 indicates higher volatility | Moderate beta at 1.44 suggests moderate volatility |
| Debt level | Low debt-to-equity of 0.25, favorable leverage | Very low debt-to-equity of 0.02, low financial risk |
| Regulatory Risk | Exposure to global semiconductor regulations | Exposure to US and international tech licensing regulations |
| Operational Risk | Complex manufacturing process control systems | Reliance on IP licensing and R&D for wireless tech |
| Environmental Risk | Moderate, with manufacturing footprint in multiple countries | Moderate, mainly linked to technology lifecycle and product use |
| Geopolitical Risk | Exposure in Israel, Taiwan, China, Korea – sensitive regions | US-based but with global licensing, less direct exposure |
In synthesis, Nova Ltd. faces significant market volatility and geopolitical risks due to its broad international manufacturing footprint, particularly in sensitive Asian markets. CEVA’s risks are more operational, tied to its licensing model and innovation pace, though it benefits from very low debt and moderate market risk. Investors should weigh Nova’s higher growth potential against its geopolitical exposure, while CEVA’s operational challenges and weaker profitability metrics increase investment risk.
Which Stock to Choose?
Nova Ltd. (NVMI) shows strong income growth with a 29.83% revenue increase in 2024 and a favorable net margin of 27.33%. Its financial ratios are largely positive, including a 19.81% ROE and low debt levels, supported by a “Very Favorable” rating and a “Slightly Favorable” MOAT indicating improving profitability.
CEVA, Inc. (CEVA) reports moderate revenue growth of 9.77% in 2024 but suffers from a negative net margin of -8.22%. Financial ratios reveal challenges with negative returns on equity and assets, offset by low debt and a “Very Favorable” rating despite a “Very Unfavorable” MOAT reflecting declining profitability and value destruction.
For investors, NVMI’s favorable rating and consistent income and profitability growth may appear suited for those seeking quality and growth. Conversely, CEVA’s profile might appeal more to risk-tolerant investors exploring potential turnaround opportunities despite current financial weaknesses.
Disclaimer: Investment carries a risk of loss of initial capital. The past performance is not a reliable indicator of future results. Be sure to understand risks before making an investment decision.
Go Further
I encourage you to read the complete analyses of Nova Ltd. and CEVA, Inc. to enhance your investment decisions: