In the rapidly evolving semiconductor industry, Micron Technology, Inc. (MU) and CEVA, Inc. (CEVA) stand out for their distinctive approaches to innovation and market reach. While Micron focuses on manufacturing memory and storage solutions, CEVA specializes in licensing cutting-edge wireless connectivity and AI processor technologies. This comparison highlights their strategic differences and growth potential, helping you decide which company offers the most compelling investment opportunity.
Table of contents
Companies Overview
I will begin the comparison between Micron Technology, Inc. and CEVA, Inc. by providing an overview of these two companies and their main differences.
Micron Technology, Inc. Overview
Micron Technology, Inc. is a global leader in designing, manufacturing, and selling memory and storage products. Its offerings include DRAM, NAND, and NOR memory technologies used in cloud servers, mobile devices, automotive, and industrial markets. Founded in 1978 and headquartered in Boise, Idaho, Micron operates through four segments and serves a broad range of technology sectors with a workforce of 48,000 employees.
CEVA, Inc. Overview
CEVA, Inc. specializes in licensing wireless connectivity and smart sensing technologies to semiconductor and OEM companies worldwide. Its portfolio includes digital signal processors, AI processors, and platforms for 5G, imaging, computer vision, and IoT applications. Founded in 1999 and based in Rockville, Maryland, CEVA focuses on licensing its technologies to companies designing integrated circuits for diverse markets such as automotive, consumer electronics, and aerospace.
Key similarities and differences
Both Micron and CEVA operate in the semiconductor industry and serve technology-driven markets globally. Micron mainly manufactures memory and storage hardware products, while CEVA focuses on licensing intellectual property related to digital signal processing and wireless technologies. Micron’s business is product-centric with a large workforce, whereas CEVA’s model emphasizes licensing and software development with a smaller team, highlighting a fundamental distinction in their business approaches.
Income Statement Comparison
The table below compares the most recent full fiscal year income statement figures for Micron Technology, Inc. and CEVA, Inc., providing key financial metrics for investors.

| Metric | Micron Technology, Inc. (MU) | CEVA, Inc. (CEVA) |
|---|---|---|
| Market Cap | 373B | 544M |
| Revenue | 37.4B | 107M |
| EBITDA | 18.5B | -3.4M |
| EBIT | 10.1B | -7.5M |
| Net Income | 8.54B | -8.8M |
| EPS | 7.65 | -0.37 |
| Fiscal Year | 2025 | 2024 |
Income Statement Interpretations
Micron Technology, Inc.
From 2021 to 2025, Micron Technology showed a strong upward trajectory in revenue and net income, with revenue growing from $27.7B to $37.4B and net income recovering from a $5.8B loss in 2023 to $8.5B in 2025. Margins improved significantly, with the latest fiscal year showing a gross margin near 40% and net margin at 22.8%, reflecting robust profitability and operational efficiency improvements.
CEVA, Inc.
CEVA’s revenue experienced modest growth from $100M in 2020 to $107M in 2024, but net income remained negative, despite narrowing losses from -$23.2M in 2022 to -$8.8M in 2024. While the gross margin was strong at 88%, EBIT and net margins remained unfavorable, indicating persistent challenges in controlling operating expenses and achieving profitability despite steady top-line growth.
Which one has the stronger fundamentals?
Micron Technology demonstrates stronger fundamentals with consistent revenue and net income growth and favorable margins across the period. CEVA, despite favorable gross margins and recent improvements in earnings growth rates, continues to report net losses and negative margins overall. The broader scale of Micron’s financial improvements and profitability indicates a more solid financial foundation.
Financial Ratios Comparison
This table presents the most recent financial ratios for Micron Technology, Inc. (MU) and CEVA, Inc. (CEVA), providing a snapshot of their key financial metrics for the fiscal year 2025 and 2024 respectively.
| Ratios | Micron Technology, Inc. (MU) 2025 | CEVA, Inc. (CEVA) 2024 |
|---|---|---|
| ROE | 15.8% | -3.3% |
| ROIC | 12.1% | -2.7% |
| P/E | 15.9 | -84.8 |
| P/B | 2.51 | 2.79 |
| Current Ratio | 2.52 | 7.09 |
| Quick Ratio | 1.79 | 7.09 |
| D/E (Debt-to-Equity) | 0.28 | 0.02 |
| Debt-to-Assets | 18.5% | 1.8% |
| Interest Coverage | 20.7 | 0 |
| Asset Turnover | 0.45 | 0.35 |
| Fixed Asset Turnover | 0.79 | 8.43 |
| Payout ratio | 6.1% | 0% |
| Dividend yield | 0.38% | 0% |
Interpretation of the Ratios
Micron Technology, Inc.
Micron Technology shows mostly favorable financial ratios, with a strong net margin of 22.84% and a solid return on equity at 15.76%. Its current and quick ratios indicate good liquidity, while debt levels remain well controlled. However, asset turnover ratios are weaker, and the dividend yield is low at 0.38%. The company pays dividends, but the yield and payout may suggest cautious distribution.
CEVA, Inc.
CEVA demonstrates several unfavorable ratios, including a negative net margin of -8.22% and negative returns on equity and invested capital. The current ratio is unusually high but flagged as unfavorable, possibly indicating inefficient asset use. The company does not pay dividends, likely due to negative profitability and a focus on reinvestment and R&D, as reflected in high research expenses and no dividend yield.
Which one has the best ratios?
Micron Technology’s ratios are globally favorable, reflecting better profitability, liquidity, and financial health compared to CEVA, whose ratios indicate ongoing operational and profitability challenges. While Micron shows some concerns on asset turnover, its overall financial profile is stronger than CEVA’s, which has a predominance of unfavorable metrics.
Strategic Positioning
This section compares the strategic positioning of Micron Technology, Inc. and CEVA, Inc. including Market position, Key segments, and disruption:
Micron Technology, Inc.
- Large market cap of 373B with strong industry presence; faces competitive pressure in semiconductors
- Diverse segments: DRAM, NAND, embedded, mobile, storage products driving revenue growth
- Exposure to technological disruption via memory and storage innovation, cloud, mobile markets
CEVA, Inc.
- Small market cap of 544M; niche licensor in wireless and smart sensing technologies
- Focused on licensing DSPs, AI processors, wireless platforms, and complementary software
- High exposure to disruption in wireless, AI, IoT, and sensing technologies licensing
Micron Technology, Inc. vs CEVA, Inc. Positioning
Micron offers a diversified product portfolio across memory and storage units, providing broad market coverage but facing intense competition. CEVA concentrates on licensing advanced connectivity and sensing IP, limiting scale but focusing on innovation in niche segments.
Which has the best competitive advantage?
Micron shows a slightly favorable moat with growing ROIC but currently shedding value, indicating improving profitability. CEVA’s declining ROIC and very unfavorable moat suggest it is destroying value and lacks sustainable competitive advantage.
Stock Comparison
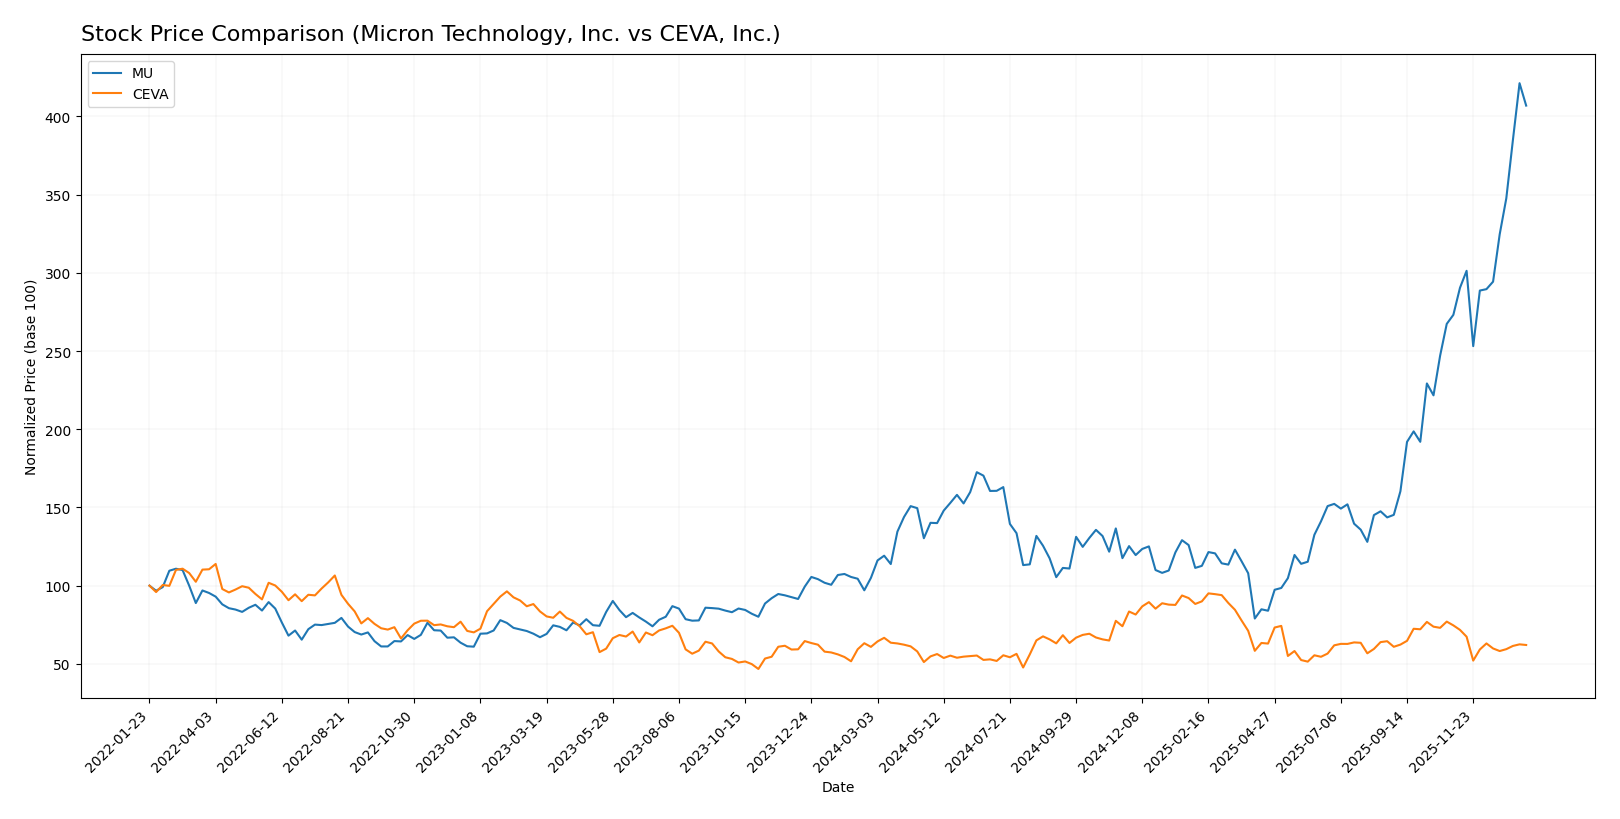
The stock price movements over the past year reveal contrasting dynamics, with Micron Technology, Inc. showing strong upward acceleration and CEVA, Inc. experiencing a near-neutral overall trend coupled with recent declines.
Trend Analysis
Micron Technology, Inc. (MU) demonstrated a bullish trend with a 287.62% price increase over the past 12 months, accompanied by acceleration and high volatility (std deviation 57.56). The stock reached a high of 345.09 and a low of 64.72.
CEVA, Inc. (CEVA) recorded a minimal 1.98% price increase, indicating a neutral overall trend with deceleration and low volatility (std deviation 4.4). However, recent months show a bearish shift with a -16.8% decline.
Comparing the two, Micron Technology clearly delivered the highest market performance with substantial price gains and acceleration, while CEVA remained largely flat with recent weakening.
Target Prices
Analysts present a clear target price consensus for both Micron Technology, Inc. and CEVA, Inc.
| Company | Target High | Target Low | Consensus |
|---|---|---|---|
| Micron Technology, Inc. | 450 | 190 | 328.22 |
| CEVA, Inc. | 28 | 28 | 28 |
The target consensus for Micron suggests moderate upside potential compared to its current price of 333.35 USD, while CEVA’s consensus target of 28 USD indicates a possible price increase from its current 22.64 USD. Analysts expect growth but with varied confidence levels.
Analyst Opinions Comparison
This section compares analysts’ ratings and grades for Micron Technology, Inc. (MU) and CEVA, Inc. (CEVA):
Rating Comparison
MU Rating
- Rating: B, considered Very Favorable overall.
- Discounted Cash Flow Score: 1, rated Very Unfavorable for valuation.
- ROE Score: 4, indicating a Favorable efficiency in generating equity profit.
- ROA Score: 5, Very Favorable asset utilization in earnings generation.
- Debt To Equity Score: 3, Moderate financial risk.
- Overall Score: 3, reflecting a Moderate overall financial standing.
CEVA Rating
- Rating: C+, also noted as Very Favorable overall.
- Discounted Cash Flow Score: 3, rated Moderate for valuation.
- ROE Score: 1, considered Very Unfavorable for equity profit generation.
- ROA Score: 1, Very Unfavorable asset utilization.
- Debt To Equity Score: 4, Favorable financial risk profile.
- Overall Score: 2, also Moderate but lower than MU’s score.
Which one is the best rated?
Based strictly on the provided data, MU is better rated overall with a B rating versus CEVA’s C+. MU shows stronger profitability metrics (ROE and ROA) but lower scores in discounted cash flow and debt management compared to CEVA.
Scores Comparison
Here is a comparison of the Altman Z-Score and Piotroski Score for both companies:
MU Scores
- Altman Z-Score: 10.50, indicating a safe zone with low bankruptcy risk.
- Piotroski Score: 7, classified as strong financial health.
CEVA Scores
- Altman Z-Score: 9.99, indicating a safe zone with low bankruptcy risk.
- Piotroski Score: 4, classified as average financial health.
Which company has the best scores?
MU has a higher Piotroski Score of 7 compared to CEVA’s 4, indicating stronger financial health. Both companies have similar Altman Z-Scores, placing them safely above bankruptcy risk.
Grades Comparison
Here is the detailed grades comparison for Micron Technology, Inc. and CEVA, Inc.:
Micron Technology, Inc. Grades
The following table summarizes recent grades from major financial institutions for Micron Technology, Inc.:
| Grading Company | Action | New Grade | Date |
|---|---|---|---|
| Keybanc | Maintain | Overweight | 2026-01-13 |
| B of A Securities | Maintain | Buy | 2026-01-13 |
| Lynx Global | Maintain | Buy | 2026-01-12 |
| Mizuho | Maintain | Outperform | 2026-01-09 |
| UBS | Maintain | Buy | 2026-01-07 |
| Piper Sandler | Maintain | Overweight | 2026-01-07 |
| Piper Sandler | Maintain | Overweight | 2025-12-18 |
| Barclays | Maintain | Overweight | 2025-12-18 |
| Keybanc | Maintain | Overweight | 2025-12-18 |
| Wolfe Research | Maintain | Outperform | 2025-12-18 |
Micron Technology has consistently maintained positive grades, predominantly “Buy,” “Overweight,” and “Outperform,” reflecting broad analyst confidence.
CEVA, Inc. Grades
The following table summarizes recent grades from major financial institutions for CEVA, Inc.:
| Grading Company | Action | New Grade | Date |
|---|---|---|---|
| Barclays | Maintain | Overweight | 2025-11-12 |
| Rosenblatt | Maintain | Buy | 2025-11-11 |
| Rosenblatt | Maintain | Buy | 2025-08-14 |
| Oppenheimer | Maintain | Outperform | 2025-05-09 |
| Rosenblatt | Maintain | Buy | 2025-05-08 |
| Barclays | Maintain | Overweight | 2025-05-08 |
| Rosenblatt | Maintain | Buy | 2025-04-23 |
| Barclays | Maintain | Overweight | 2025-02-14 |
| Rosenblatt | Maintain | Buy | 2025-02-14 |
| Rosenblatt | Maintain | Buy | 2025-02-11 |
CEVA, Inc. also shows a consistent pattern of positive grades, mostly “Buy,” “Overweight,” and “Outperform,” signaling sustained analyst support.
Which company has the best grades?
Both Micron Technology, Inc. and CEVA, Inc. have received strong and consistent grades from reputable firms, with no downgrade actions reported. Micron shows a larger volume of recent ratings with repeated “Buy” and “Overweight” grades, possibly indicating broader analyst coverage, while CEVA maintains a solid “Buy” and “Overweight” consensus. For investors, this suggests both stocks are viewed favorably but with varying degrees of analyst attention.
Strengths and Weaknesses
Below is a comparison of key strengths and weaknesses of Micron Technology, Inc. (MU) and CEVA, Inc. (CEVA) based on recent financial and operational data.
| Criterion | Micron Technology, Inc. (MU) | CEVA, Inc. (CEVA) |
|---|---|---|
| Diversification | High diversification across DRAM, NAND, and business segments | Focused on licensing and royalties, limited product diversification |
| Profitability | Favorable margins and ROIC (12.12%), steadily growing profitability | Negative margins and ROIC (-2.68%), declining profitability |
| Innovation | Consistent investment in memory technology with growing ROIC trend | Innovation challenged by declining returns and value destruction |
| Global presence | Strong global market with significant share in memory products | Smaller scale, niche market in connectivity and sensing IP |
| Market Share | Large market share in DRAM and NAND memory segments | Smaller market share, dependent on licensing agreements |
Key takeaway: Micron Technology demonstrates stronger diversification, robust profitability, and a favorable growth trajectory, making it a more stable investment option. CEVA faces challenges with declining profitability and limited diversification, increasing investment risk.
Risk Analysis
Below is a risk comparison table for Micron Technology, Inc. (MU) and CEVA, Inc. as of the most recent fiscal years:
| Metric | Micron Technology, Inc. (MU) | CEVA, Inc. (CEVA) |
|---|---|---|
| Market Risk | High beta 1.503; sensitive to semiconductor cycle fluctuations | High beta 1.436; exposed to licensing market volatility |
| Debt level | Low debt-to-equity 0.28; interest coverage strong at 21.26 | Very low debt 0.02; no interest coverage (zero) |
| Regulatory Risk | Moderate; US tech regulations and export controls impact | Moderate; IP and licensing regulatory environment |
| Operational Risk | Moderate; global supply chain and manufacturing complexity | Moderate; dependency on licensees and tech innovation |
| Environmental Risk | Standard for semiconductor manufacturing; moderate exposure | Low; primarily IP licensing business, limited manufacturing |
| Geopolitical Risk | Significant due to global semiconductor supply chain and US-China tensions | Moderate; less exposed but affected by global tech policies |
Micron faces substantial market and geopolitical risks amplified by its global manufacturing footprint and US-China tensions. CEVA’s main risks stem from its weak profitability and reliance on licensing market stability, despite a very low debt burden. Both require cautious monitoring of semiconductor sector trends and geopolitical developments.
Which Stock to Choose?
Micron Technology, Inc. (MU) shows strong income growth with a 48.85% revenue increase in 2025 and consistent profitability, reflected in a 22.84% net margin and favorable financial ratios. Its debt levels are moderate with a net debt to EBITDA of 0.30, and the company holds a very favorable overall rating of B.
CEVA, Inc. (CEVA) presents moderate revenue growth of 9.77% in 2024 but struggles with negative net margin (-8.22%) and returns on equity (-3.3%). Despite low debt levels, its financial ratios are largely unfavorable, and it carries a very favorable rating of C+ mainly due to specific metrics, though its profitability and capital efficiency remain weak.
Investors prioritizing stable profitability and strong financial health might find Micron’s profile more aligned with their goals, whereas those with a tolerance for higher risk and interest in growth potential could interpret CEVA’s situation differently, given its volatile returns and weaker income statement.
Disclaimer: Investment carries a risk of loss of initial capital. The past performance is not a reliable indicator of future results. Be sure to understand risks before making an investment decision.
Go Further
I encourage you to read the complete analyses of Micron Technology, Inc. and CEVA, Inc. to enhance your investment decisions: