Home > Comparison > Technology > MXL vs CEVA
The strategic rivalry between MaxLinear, Inc. and CEVA, Inc. defines the current trajectory of the semiconductor sector. MaxLinear operates as a capital-intensive provider of integrated communication system chips, while CEVA excels as a high-margin licensor of wireless connectivity and AI processing technologies. This analysis pits MaxLinear’s hardware-driven model against CEVA’s IP licensing approach to identify which offers superior risk-adjusted returns for a diversified portfolio.
Table of contents
Companies Overview
MaxLinear and CEVA stand as pivotal players in the semiconductor sector, shaping communication and connectivity technologies globally.
MaxLinear, Inc.: Integrated SoC Innovator
MaxLinear leads in radiofrequency (RF) and mixed-signal system-on-chip (SoC) solutions for wired and wireless communications. Its revenue comes from selling integrated communication platform chips used in DOCSIS modems, fiber, Wi-Fi routers, and 4G/5G infrastructure. In 2026, MaxLinear’s strategic focus centers on expanding its footprint in broadband and industrial multi-market applications through high-performance, end-to-end communication technology.
CEVA, Inc.: Wireless IP Licensing Specialist
CEVA operates as a licensor of wireless connectivity and smart sensing IP, developing DSP cores and AI processors for 5G, IoT, and imaging markets. Its core revenue engine is licensing its digital signal processing technology to semiconductor and OEM companies globally. CEVA’s 2026 strategy emphasizes broadening its IP portfolio for AI-driven sensing and wireless IoT, targeting diverse consumer and industrial applications.
Strategic Collision: Similarities & Divergences
Both companies thrive in semiconductors but diverge sharply in business models: MaxLinear integrates chips for direct sale, while CEVA licenses IP to chipmakers. They compete primarily in wireless infrastructure and IoT connectivity. MaxLinear bets on hardware innovation, whereas CEVA focuses on software-enabled platform licensing. This contrast shapes distinct investment profiles—tangible product development versus scalable technology licensing.
Income Statement Comparison
The following data dissects the core profitability and scalability of both corporate engines to reveal who dominates the bottom line:
| Metric | MaxLinear, Inc. (MXL) | CEVA, Inc. (CEVA) |
|---|---|---|
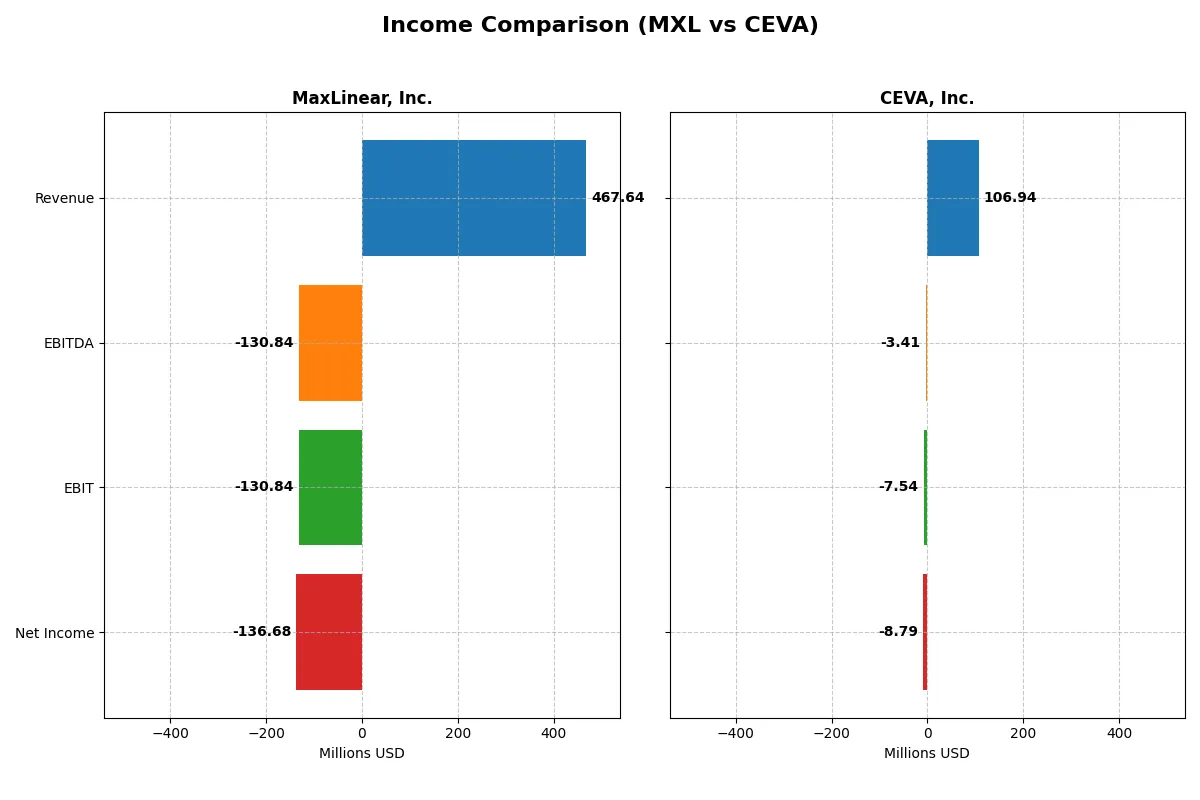
| Revenue | 468M | 107M |
| Cost of Revenue | 202M | 13M |
| Operating Expenses | 393M | 102M |
| Gross Profit | 266M | 94M |
| EBITDA | -131M | -3.4M |
| EBIT | -131M | -7.5M |
| Interest Expense | 10M | 0 |
| Net Income | -137M | -8.8M |
| EPS | -1.58 | -0.37 |
| Fiscal Year | 2025 | 2024 |
Income Statement Analysis: The Bottom-Line Duel
This income statement comparison reveals which company drives stronger profitability and operational efficiency through recent market cycles.
MaxLinear, Inc. Analysis
MaxLinear’s revenue fell sharply from 1.12B in 2022 to 468M in 2025, with net income swinging from 125M profit to a 137M loss in 2025. Despite a strong 56.8% gross margin, its net margin plunged to -29.2%. The 2025 improvement in revenue and net margin signals early momentum but overall profitability remains challenged.
CEVA, Inc. Analysis
CEVA’s revenue grew modestly to 107M in 2024 from 100M in 2020, while net income stayed negative, narrowing losses to -8.8M in 2024. Its impressive 88% gross margin contrasts with an -8.2% net margin. The improving EBIT and net margin in 2024 reflect operational strides toward efficiency, though profitability is still elusive.
Margin Strength vs. Profit Recovery
MaxLinear endures a steep revenue decline but shows signs of margin recovery and narrowing losses in 2025. CEVA exhibits stable revenue growth with superior gross margins but continues to struggle converting sales into profits. MaxLinear’s volatile earnings profile contrasts with CEVA’s gradual operational progress. Investors may prefer CEVA’s consistent margin discipline over MaxLinear’s uneven profit trajectory.
Financial Ratios Comparison
These vital ratios act as a diagnostic tool to expose the underlying fiscal health, valuation premiums, and capital efficiency of the companies analyzed:
| Ratios | MaxLinear, Inc. (MXL) | CEVA, Inc. (CEVA) |
|---|---|---|
| ROE | -47.49% | -3.30% |
| ROIC | -24.31% | -2.68% |
| P/E | -6.74 | -84.79 |
| P/B | 3.20 | 2.79 |
| Current Ratio | 1.77 | 7.09 |
| Quick Ratio | 1.28 | 7.09 |
| D/E | 0.29 | 0.02 |
| Debt-to-Assets | 17.23% | 1.80% |
| Interest Coverage | -15.52 | 0 |
| Asset Turnover | 0.42 | 0.35 |
| Fixed Asset Turnover | 4.65 | 8.43 |
| Payout ratio | 0 | 0 |
| Dividend yield | 0 | 0 |
| Fiscal Year | 2024 | 2024 |
Efficiency & Valuation Duel: The Vital Signs
Ratios act as a company’s DNA, uncovering hidden risks and operational strengths that raw numbers alone cannot reveal.
MaxLinear, Inc.
MaxLinear posts deeply negative profitability with a -47.5% ROE and a -68% net margin, signaling operational struggles. Yet, its P/E ratio at -6.74 appears favorable, suggesting the market prices in significant challenges. The company pays no dividend, instead reinvesting heavily in R&D, which accounts for over 62% of revenue, aiming for future growth.
CEVA, Inc.
CEVA delivers less severe losses with a -3.3% ROE and an -8.2% net margin, reflecting a less dire profit outlook. Its P/E ratio, though negative, is far more stretched at -84.8, implying high valuation risk. Like MaxLinear, CEVA does not distribute dividends, allocating substantial funds to R&D—near 67% of revenue—to fuel innovation and expansion.
Profitability Woes vs. Valuation Stretches
Both companies exhibit unfavorable profitability and risk profiles, with similar shares of unfavorable ratios. MaxLinear’s lower valuation multiple offers a relatively better risk-reward balance, appealing to investors focused on deep-value turnaround potential. CEVA suits those seeking exposure to a smaller loss but at a premium valuation and higher operational uncertainty.
Which one offers the Superior Shareholder Reward?
MaxLinear, Inc. (MXL) and CEVA, Inc. both forgo dividends, focusing on reinvestment and buybacks for shareholder returns. MXL’s buyback activity is limited, reflecting negative free cash flow in 2024 (-$0.75 per share). CEVA’s buyback intensity is also modest, with minimal free cash flow ($0.02 per share) and a conservative capital structure (debt/assets 1.8%). MXL’s higher asset turnover (0.42 vs. 0.35) suggests operational efficiency, but persistent losses and negative EBIT margin (-63%) undermine sustainability. CEVA’s stronger gross margin (88%) and robust cash reserves ($6.93 per share) support long-term value creation despite recent losses. I conclude CEVA offers the more sustainable total return profile in 2026 due to better capital discipline and reinvestment potential.
Comparative Score Analysis: The Strategic Profile
The radar chart reveals the fundamental DNA and trade-offs between MaxLinear, Inc. and CEVA, Inc., highlighting their distinct financial strengths and weaknesses:
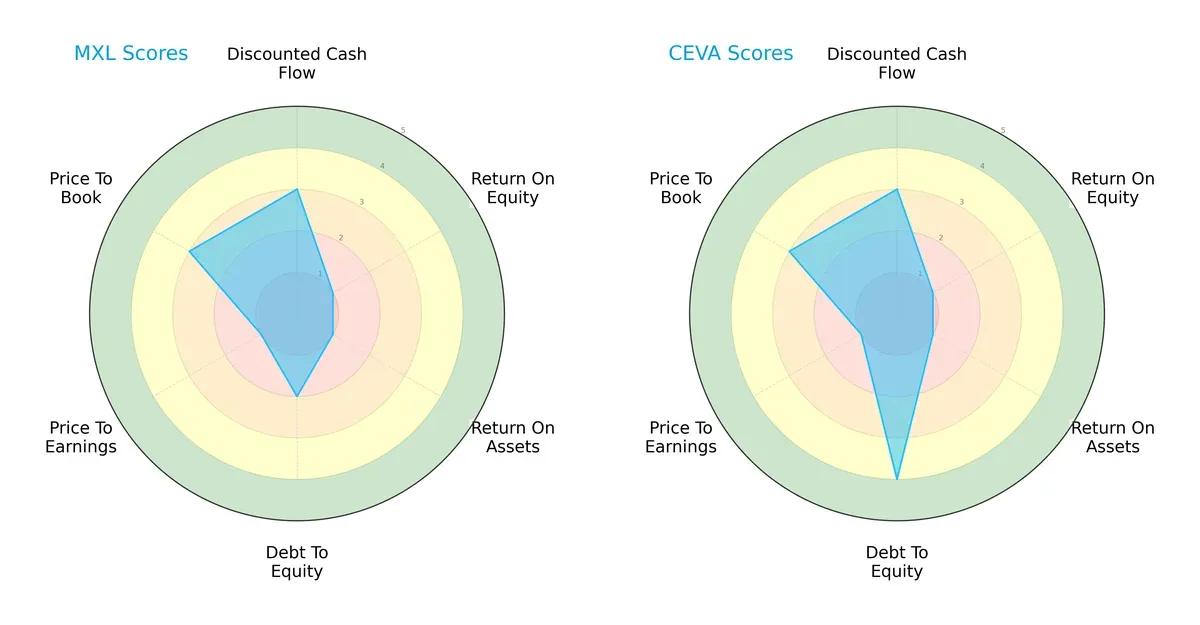
Both firms share moderate DCF scores, reflecting similar discounted cash flow valuations. Each suffers from very unfavorable ROE and ROA scores, signaling challenges in generating returns on equity and assets. CEVA, however, boasts a much stronger debt-to-equity score (4 vs. 2), indicating a healthier balance sheet and lower financial risk. MaxLinear’s price-to-book valuation edges slightly higher, suggesting relative undervaluation. Overall, CEVA presents a more balanced profile with superior financial stability, while MaxLinear depends more on valuation metrics to attract investors.
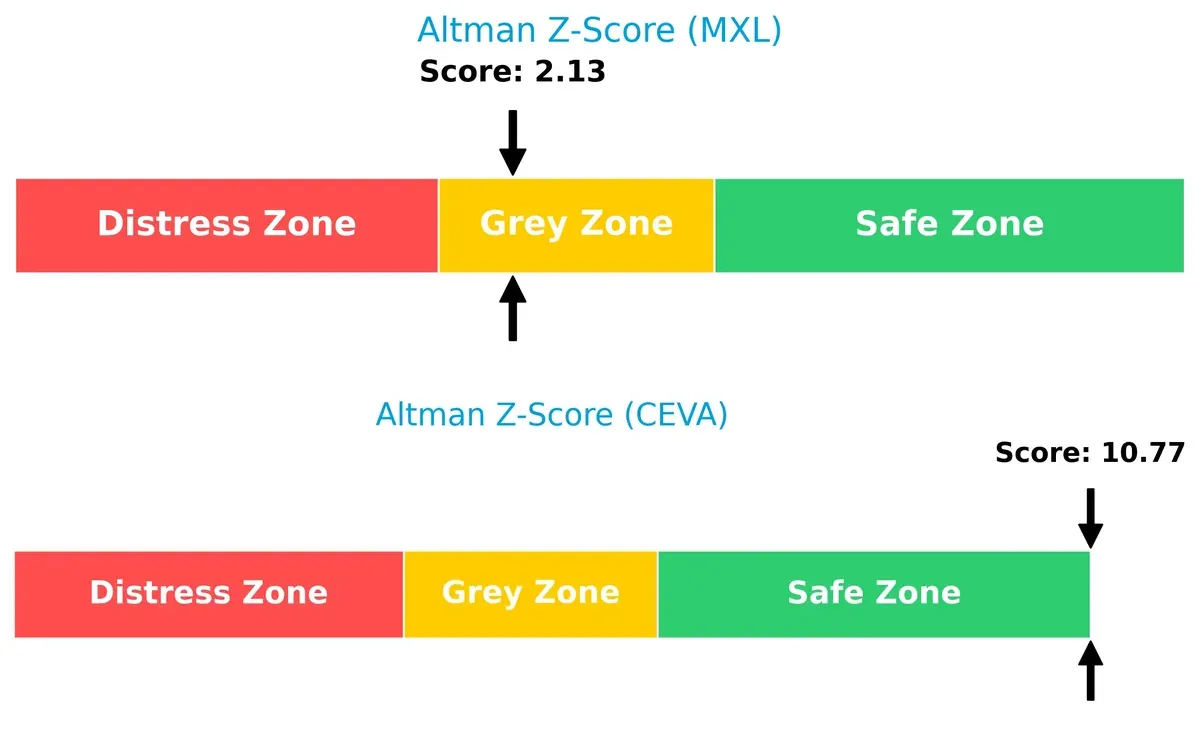
Bankruptcy Risk: Solvency Showdown
CEVA’s Altman Z-Score of 10.77 firmly places it in the safe zone, indicating robust solvency and a low bankruptcy risk. MaxLinear’s 2.13 score situates it in the grey zone, signaling moderate financial distress risks in this cycle:
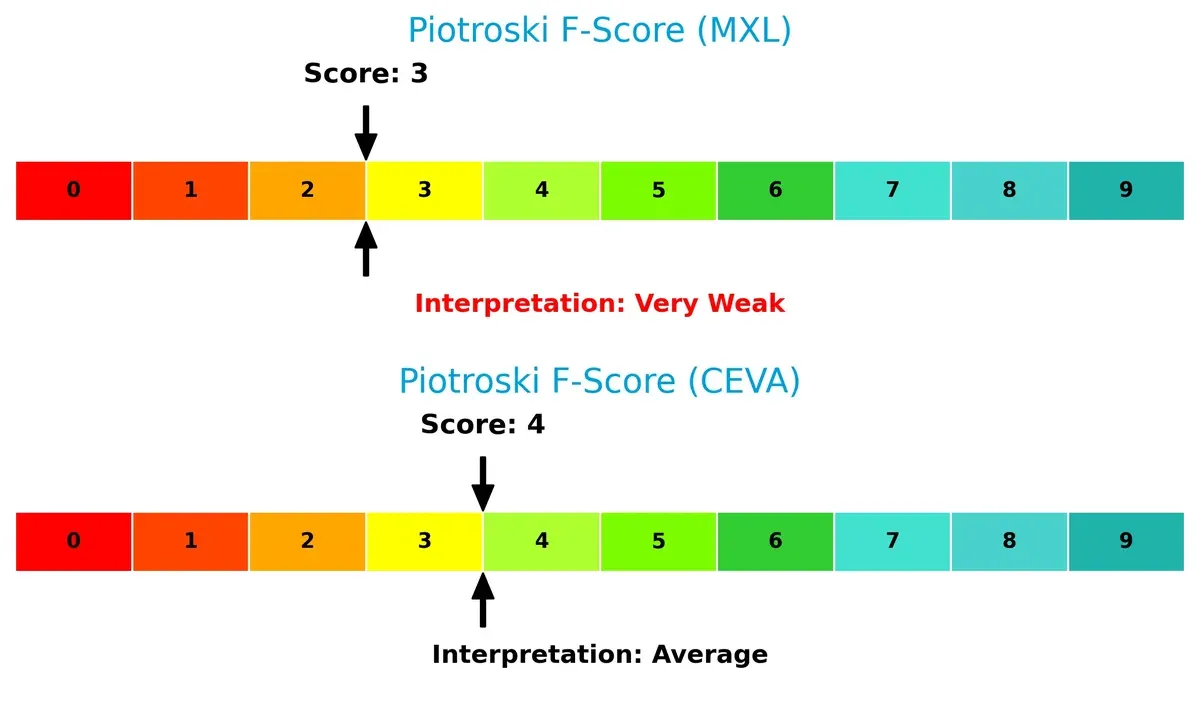
Financial Health: Quality of Operations
CEVA’s Piotroski F-Score of 4 reflects average financial health, while MaxLinear’s score of 3 signals very weak operational quality. This gap highlights potential red flags for MaxLinear in profitability and efficiency metrics:
How are the two companies positioned?
This section dissects MaxLinear and CEVA’s operational DNA by comparing their revenue distribution and internal strengths and weaknesses. The goal is to confront their economic moats and identify which business model holds a more resilient, sustainable competitive advantage today.
Revenue Segmentation: The Strategic Mix
This comparison dissects how MaxLinear, Inc. and CEVA, Inc. diversify their income streams and reveals their primary sector bets in recent fiscal years:
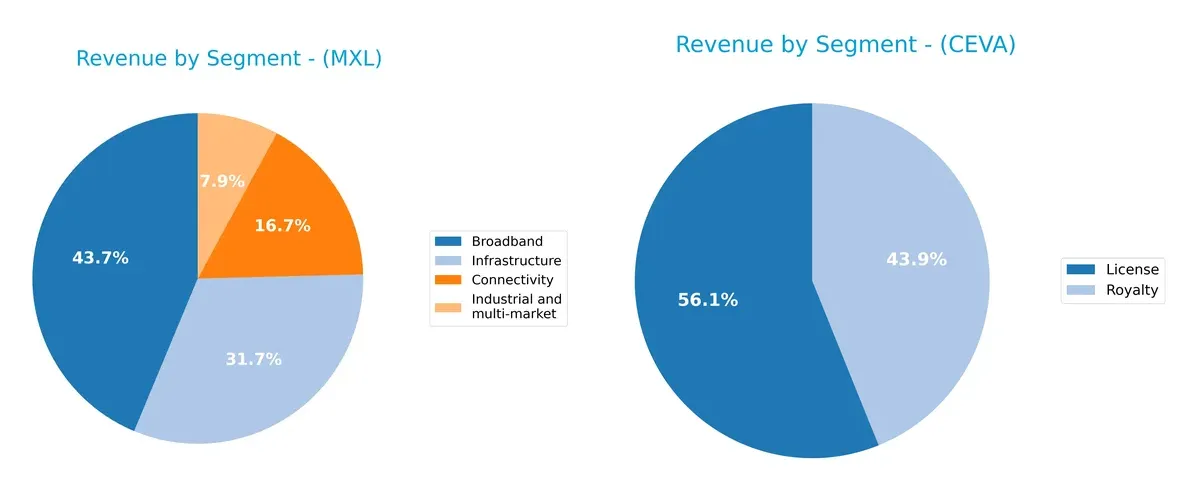
MaxLinear leans heavily on Broadband ($204M in 2025) and Infrastructure ($148M), anchoring its revenue in core connectivity and network segments. CEVA’s 2024 revenue splits mainly between License ($60M) and Royalty ($47M), showing a focused licensing model. MaxLinear’s broader mix reduces concentration risk, while CEVA’s reliance on two segments indicates strategic specialization but potential vulnerability if licensing demand wanes.
Strengths and Weaknesses Comparison
This table compares the Strengths and Weaknesses of MaxLinear, Inc. and CEVA, Inc.:
MaxLinear Strengths
- Diverse revenue streams across Broadband, Connectivity, Industrial, Infrastructure segments
- Favorable current and quick ratios reflect liquidity management
- Low debt-to-equity and debt-to-assets ratios indicate conservative leverage
- Strong fixed asset turnover signals efficient use of property
CEVA Strengths
- Revenue diversification through License and Royalty income streams
- Favorable quick ratio and low debt-to-equity support financial stability
- Very low debt-to-assets ratio limits financial risk
- High fixed asset turnover shows asset efficiency
MaxLinear Weaknesses
- Negative net margin, ROE, and ROIC highlight profitability challenges
- High WACC increases capital cost burden
- Unfavorable interest coverage ratio signals risk in meeting interest expenses
- Asset turnover below ideal benchmarks implies lower operational efficiency
- Unfavorable price-to-book ratio may concern value investors
CEVA Weaknesses
- Negative profitability metrics with net margin, ROE, and ROIC below zero
- WACC remains high relative to returns, pressuring capital costs
- Interest coverage ratio at zero raises solvency concerns
- Current ratio unusually high, potentially indicating inefficient asset use
- Price-to-earnings negative but extremely volatile
Both companies face profitability and capital efficiency challenges despite sound leverage and asset use metrics. MaxLinear shows stronger liquidity ratios, while CEVA’s revenue model is more focused on intellectual property licensing. These financial contrasts suggest differing strategic priorities and operational constraints.
The Moat Duel: Analyzing Competitive Defensibility
A structural moat is the only true shield preventing long-term profits from relentless competitive erosion. Let’s dissect two semiconductor firms’ moats:
MaxLinear, Inc.: Cost Advantage with Broad Integration
MaxLinear’s moat rests on cost advantage through integrated SoCs combining RF, analog, and digital functions. Its high gross margin of 57% contrasts with weak EBIT margins, signaling margin pressure. Expansion in 5G and fiber infrastructure could deepen its moat if profitability recovers in 2026.
CEVA, Inc.: Intangible Assets in IP Licensing
CEVA leverages intangible assets via patented DSP and AI processor IP licensing. Its gross margin exceeds 88%, far outpacing MaxLinear, but EBIT remains negative. CEVA’s licensing model scales efficiently, and growth in AI and IoT markets offers strong moat expansion potential.
Cost Integration vs. IP Licensing: Who Defends Better?
Both companies destroy value with declining ROIC below WACC, flagging weak moats. Yet, CEVA’s intangible asset moat is structurally wider due to scalable IP licensing and superior margin profile. I see CEVA better positioned to defend and grow market share amid technological shifts in 2026.
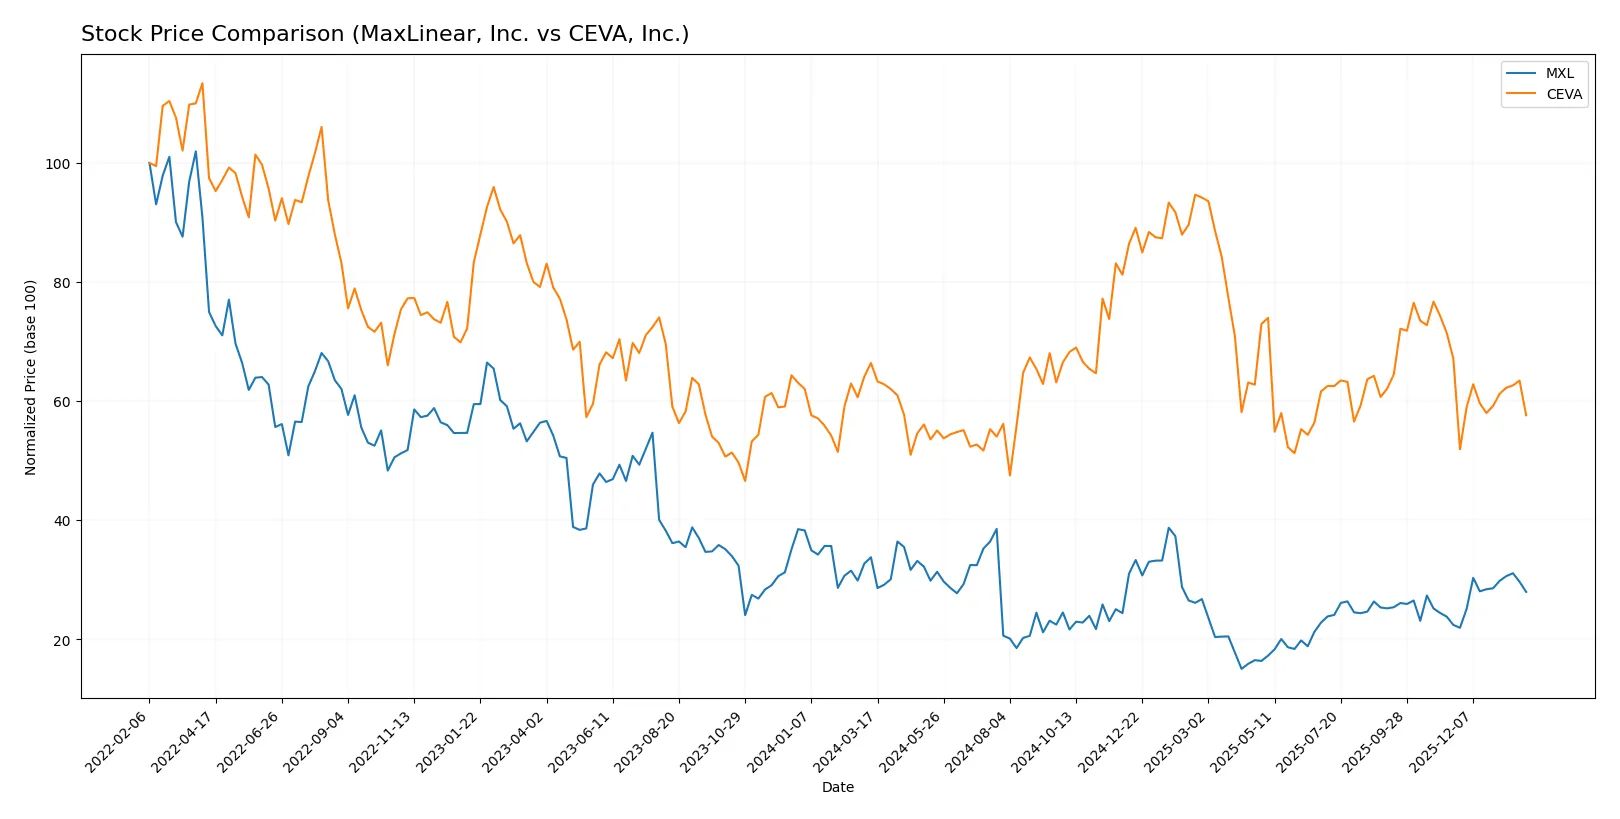
Which stock offers better returns?
The stock prices of MaxLinear, Inc. and CEVA, Inc. show distinct dynamics over the past year, with MaxLinear exhibiting a sharper overall decline but recent strong recovery, while CEVA maintains a consistent downward trajectory.
Trend Comparison
MaxLinear, Inc. experienced a bearish trend over the past 12 months with a -17.26% price change, marked by accelerating decline and significant volatility between $24.05 and $9.31. However, recent weeks show a bullish 24.82% rebound.
CEVA, Inc. also followed a bearish trend with a -13.25% price change over the year, accelerating downward with higher volatility. Its recent performance remains negative, falling another -14.16% with low upward momentum.
MaxLinear’s recent strong recovery contrasts with CEVA’s continued decline, giving MaxLinear the higher market performance over the analyzed period despite both stocks’ negative yearly trends.
Target Prices
Analysts provide a clear bullish consensus for MaxLinear, Inc. and CEVA, Inc., reflecting solid growth expectations.
| Company | Target Low | Target High | Consensus |
|---|---|---|---|
| MaxLinear, Inc. | 15 | 25 | 21 |
| CEVA, Inc. | 28 | 28 | 28 |
MaxLinear’s consensus target of 21 exceeds its current price of 17.35, indicating upside potential. CEVA’s firm target at 28 well surpasses its current 21.09 price, suggesting strong growth confidence.

Don’t Let Luck Decide Your Entry Point
Optimize your entry points with our advanced ProRealTime indicators. You’ll get efficient buy signals with precise price targets for maximum performance. Start outperforming now!
How do institutions grade them?
MaxLinear, Inc. Grades
The following table summarizes recent grades from established grading firms for MaxLinear, Inc.:
| Grading Company | Action | New Grade | Date |
|---|---|---|---|
| Wells Fargo | Maintain | Equal Weight | 2026-01-30 |
| Benchmark | Maintain | Buy | 2026-01-16 |
| Benchmark | Maintain | Buy | 2025-10-24 |
| Benchmark | Maintain | Buy | 2025-10-17 |
| Benchmark | Maintain | Buy | 2025-09-02 |
| Loop Capital | Maintain | Hold | 2025-08-04 |
| Wells Fargo | Maintain | Equal Weight | 2025-07-24 |
| Benchmark | Maintain | Buy | 2025-07-24 |
| Susquehanna | Maintain | Neutral | 2025-07-24 |
| Susquehanna | Maintain | Neutral | 2025-07-22 |
CEVA, Inc. Grades
Below is a summary of recent grades from recognized grading companies for CEVA, Inc.:
| Grading Company | Action | New Grade | Date |
|---|---|---|---|
| Barclays | Maintain | Overweight | 2025-11-12 |
| Rosenblatt | Maintain | Buy | 2025-11-11 |
| Rosenblatt | Maintain | Buy | 2025-08-14 |
| Oppenheimer | Maintain | Outperform | 2025-05-09 |
| Rosenblatt | Maintain | Buy | 2025-05-08 |
| Barclays | Maintain | Overweight | 2025-05-08 |
| Rosenblatt | Maintain | Buy | 2025-04-23 |
| Barclays | Maintain | Overweight | 2025-02-14 |
| Rosenblatt | Maintain | Buy | 2025-02-14 |
| Rosenblatt | Maintain | Buy | 2025-02-11 |
Which company has the best grades?
CEVA, Inc. consistently receives higher ratings such as Overweight and Outperform from multiple reputable firms. MaxLinear, Inc. generally holds Buy and Equal Weight grades. Investors might view CEVA as more favorably positioned based on these institutional assessments.
Risks specific to each company
The following categories identify critical pressure points and systemic threats confronting MaxLinear, Inc. and CEVA, Inc. in the 2026 market environment:
1. Market & Competition
MaxLinear, Inc.
- Faces intense competition in semiconductor communications, pressured by rapid tech shifts and innovation cycles.
CEVA, Inc.
- Competes in licensing wireless and AI tech; market demand volatility and technology adoption are key risks.
2. Capital Structure & Debt
MaxLinear, Inc.
- Moderate leverage with a debt-to-equity ratio of 0.29; interest coverage is negative, signaling stress servicing debt.
CEVA, Inc.
- Very low leverage (debt-to-equity 0.02) with zero interest coverage, indicating limited earnings to cover interest expenses.
3. Stock Volatility
MaxLinear, Inc.
- Beta of 1.77 shows higher volatility than the market, increasing investment risk amid market turbulence.
CEVA, Inc.
- Beta of 1.44 indicates elevated but relatively lower volatility than MaxLinear, reflecting moderate risk.
4. Regulatory & Legal
MaxLinear, Inc.
- Subject to semiconductor export controls and IP litigation risks in a global trade-sensitive sector.
CEVA, Inc.
- Faces regulatory risks tied to IP licensing, antitrust scrutiny, and compliance with evolving wireless standards.
5. Supply Chain & Operations
MaxLinear, Inc.
- Dependent on component suppliers amid global semiconductor shortages, affecting production and delivery.
CEVA, Inc.
- Relies on licensees’ operational stability; supply chain risk is indirect but linked to licensees’ manufacturing constraints.
6. ESG & Climate Transition
MaxLinear, Inc.
- ESG risks include energy-intensive manufacturing and regulatory pressure on sustainable practices.
CEVA, Inc.
- Faces ESG and climate risks primarily through licensees’ environmental compliance impacting demand and reputation.
7. Geopolitical Exposure
MaxLinear, Inc.
- High exposure to US-China trade tensions and global supply chain disruptions in semiconductor markets.
CEVA, Inc.
- Geopolitical risk stems from global licensing operations and dependency on international tech ecosystems.
Which company shows a better risk-adjusted profile?
MaxLinear’s greatest risk lies in its negative interest coverage, signaling financial strain in servicing debt. CEVA’s principal risk is its limited earnings, reflected in zero interest coverage and reliance on licensees. CEVA’s very low leverage and strong Altman Z-Score place it in a safer financial zone. Although MaxLinear has a higher beta and operational supply chain risks, CEVA’s moderate stock volatility and better capital structure give it a superior risk-adjusted profile in 2026. The marked negative net margin (-68%) for MaxLinear versus CEVA’s less severe loss (-8%) underscores MaxLinear’s acute profitability challenge, justifying caution.
Final Verdict: Which stock to choose?
MaxLinear’s superpower lies in its strong R&D commitment, fueling innovation despite current profitability struggles. Its main point of vigilance is the persistent negative returns on capital, signaling ongoing value destruction. This stock suits investors with a high-risk tolerance aiming for aggressive growth potential.
CEVA benefits from a strategic moat built on solid gross margins and conservative debt levels, offering a safety cushion relative to MaxLinear. However, its declining ROIC and limited free cash flow growth temper enthusiasm. CEVA fits well within GARP portfolios seeking growth with more reasonable risk.
If you prioritize aggressive growth and can tolerate volatility, MaxLinear’s innovation-driven rebound might outshine CEVA’s steadier profile. However, if you seek better financial stability and a more defensive growth approach, CEVA offers superior balance sheet strength despite slower momentum. Both carry meaningful risks requiring careful monitoring.
Disclaimer: Investment carries a risk of loss of initial capital. The past performance is not a reliable indicator of future results. Be sure to understand risks before making an investment decision.
Go Further
I encourage you to read the complete analyses of MaxLinear, Inc. and CEVA, Inc. to enhance your investment decisions: