Marvell Technology, Inc. and CEVA, Inc. are two prominent players in the semiconductor industry, each carving distinct yet overlapping niches. Marvell focuses on integrated circuits and storage solutions, while CEVA specializes in licensing wireless connectivity and smart sensing technologies. Their innovation strategies and market presence make them compelling candidates for investors seeking exposure to cutting-edge tech. This article will help you identify which company offers the most attractive investment opportunity.
Table of contents
Companies Overview
I will begin the comparison between Marvell Technology and CEVA by providing an overview of these two companies and their main differences.
Marvell Technology Overview
Marvell Technology, Inc. designs, develops, and sells a range of integrated circuits including analog, mixed-signal, and digital signal processing chips. Its product portfolio covers Ethernet solutions, storage controllers, ASICs, and application processors. Positioned in the semiconductor industry, Marvell operates globally with a significant workforce of 7,042 employees and a market capitalization of approximately 69.3B USD.
CEVA Overview
CEVA, Inc. licenses wireless connectivity and smart sensing technologies to semiconductor and OEM companies worldwide. It focuses on digital signal processors, AI processors, and wireless platforms used in mobile, IoT, automotive, and industrial applications. Based in Rockville, Maryland, CEVA employs 406 people and has a market cap near 536M USD, serving as an IP licensor in the semiconductor sector.
Key similarities and differences
Both companies operate in the semiconductor industry and offer technologies involving digital signal processing and wireless communication. However, Marvell manufactures and sells physical integrated circuits directly, whereas CEVA acts primarily as a licensor of semiconductor IP and software platforms. Marvell’s scale and market value are substantially larger, reflecting differing business models and operational scopes within the tech sector.
Income Statement Comparison
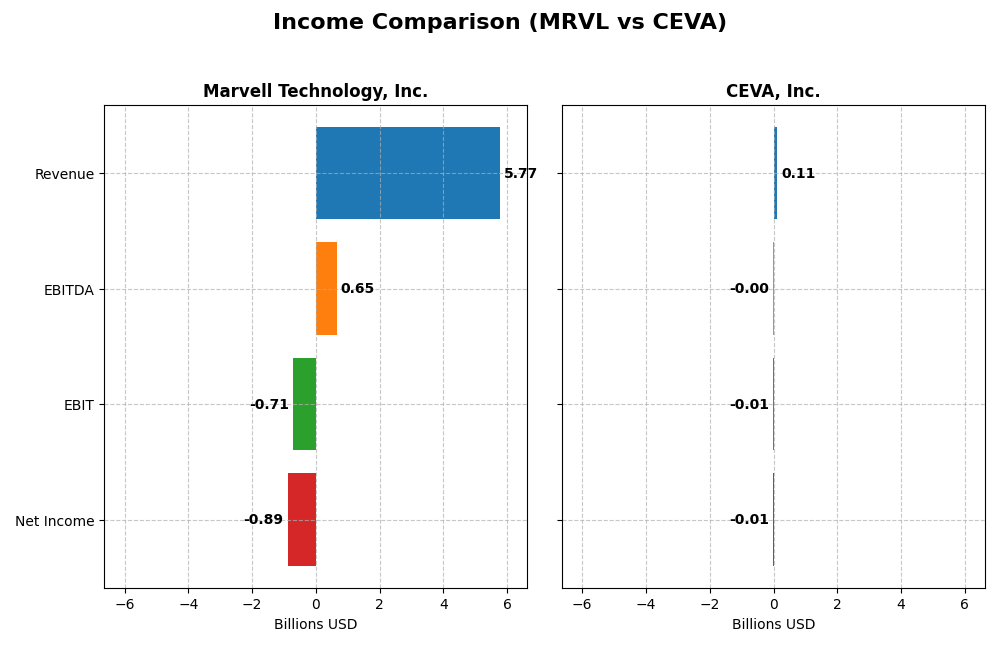
The table below compares the key income statement metrics for Marvell Technology, Inc. and CEVA, Inc. based on their most recent fiscal year results.
| Metric | Marvell Technology, Inc. (MRVL) | CEVA, Inc. (CEVA) |
|---|---|---|
| Market Cap | 69.3B | 536M |
| Revenue | 5.77B | 107M |
| EBITDA | 652M | -3.41M |
| EBIT | -705M | -7.55M |
| Net Income | -885M | -8.79M |
| EPS | -1.02 | -0.37 |
| Fiscal Year | 2025 | 2024 |
Income Statement Interpretations
Marvell Technology, Inc.
From 2021 to 2025, Marvell Technology saw revenue almost double, growing 94.26%, though net income declined sharply with a negative 219.15% over the same period. Gross margin remained stable and favorable at 41.31%, but EBIT and net margins were consistently negative. In 2025, revenue growth slowed moderately to 4.71%, with slight gross profit growth, while EBIT fell by 28.94%, indicating margin pressures despite a modest EPS improvement.
CEVA, Inc.
CEVA’s revenue grew modestly by 6.59% from 2020 to 2024, with net income falling significantly by 269.31%. The company maintained a very favorable gross margin of 88.06%, but EBIT and net margins remained negative. In 2024, revenue increased 9.77% with matching growth in gross profit and EBIT improved by 43.97%. Net margin and EPS also showed healthy improvements, reflecting better operational efficiency last year.
Which one has the stronger fundamentals?
CEVA exhibits stronger fundamentals overall, with a higher proportion of favorable income statement metrics (57.14%) compared to Marvell’s 35.71%. CEVA’s recent positive momentum in revenue, EBIT, net margin, and EPS growth contrasts with Marvell’s mixed signals of modest revenue growth but deteriorating EBIT and margins. However, both companies face challenges with sustained negative net incomes over the periods analyzed.
Financial Ratios Comparison
This table presents a side-by-side comparison of key financial ratios for Marvell Technology, Inc. and CEVA, Inc. based on their most recent fiscal year data.
| Ratios | Marvell Technology, Inc. (MRVL) | CEVA, Inc. (CEVA) |
|---|---|---|
| ROE | -6.59% | -3.30% |
| ROIC | -3.88% | -2.68% |
| P/E | -110.4 | -84.8 |
| P/B | 7.27 | 2.79 |
| Current Ratio | 1.54 | 7.09 |
| Quick Ratio | 1.03 | 7.09 |
| D/E | 0.32 | 0.02 |
| Debt-to-Assets | 21.5% | 1.80% |
| Interest Coverage | -3.80 | 0 |
| Asset Turnover | 0.29 | 0.35 |
| Fixed Asset Turnover | 5.56 | 8.43 |
| Payout ratio | -23.4% | 0% |
| Dividend yield | 0.21% | 0% |
Interpretation of the Ratios
Marvell Technology, Inc.
Marvell’s ratios show mixed strength with a current ratio of 1.54 and low debt-to-equity of 0.32, both favorable, but net margin at -15.35% and return on equity at -6.59% signal operational challenges. The dividend yield is modest at 0.21%, supported by a stable payout, though coverage may be tight given negative free cash flow to equity, indicating caution around distributions.
CEVA, Inc.
CEVA exhibits a strong liquidity position with a quick ratio of 7.09 and minimal debt-to-assets at 1.8%, though profitability ratios like net margin at -8.22% and return on equity at -3.3% remain unfavorable. The company does not pay dividends, likely due to reinvestment priorities and a focus on R&D, as indicated by high research spending relative to revenue.
Which one has the best ratios?
Both companies face profitability challenges, reflected in negative margins and returns. Marvell has more favorable leverage and liquidity ratios than CEVA but a higher dividend yield with some risk. CEVA excels in liquidity but lacks dividend returns and shows weaker profitability. Overall, neither company presents a clearly superior ratio profile, as both have significant weaknesses.
Strategic Positioning
This section compares the strategic positioning of Marvell Technology, Inc. and CEVA, Inc. in terms of Market position, Key segments, and Exposure to technological disruption:
Marvell Technology, Inc.
- Large market cap of $69.3B with diversified semiconductor offerings, facing strong competitive pressure.
- Key segments include data center ($4.16B), enterprise networking, carrier infrastructure, automotive, and consumer electronics.
- Exposure to disruption through integrated circuit innovation, Ethernet, storage solutions, and processors in a rapidly evolving semiconductor industry.
CEVA, Inc.
- Small market cap of $536M, licenses digital signal processors and AI cores, niche competitive space.
- Focused on licensing wireless connectivity and smart sensing IPs for mobile, IoT, automotive, and AI markets.
- Exposure through licensing AI, 5G, and IoT DSP platforms, dependent on OEMs adopting its IP technology.
Marvell Technology, Inc. vs CEVA, Inc. Positioning
Marvell shows a diversified business model spanning multiple semiconductor segments with significant revenue scale, while CEVA concentrates on IP licensing for wireless and sensing technologies. Marvell’s broad product base offers scale advantages; CEVA’s niche focus depends on license adoption.
Which has the best competitive advantage?
Both companies exhibit very unfavorable MOAT evaluations with declining ROIC and value destruction. Neither demonstrates a sustainable competitive advantage based on recent capital efficiency metrics.
Stock Comparison
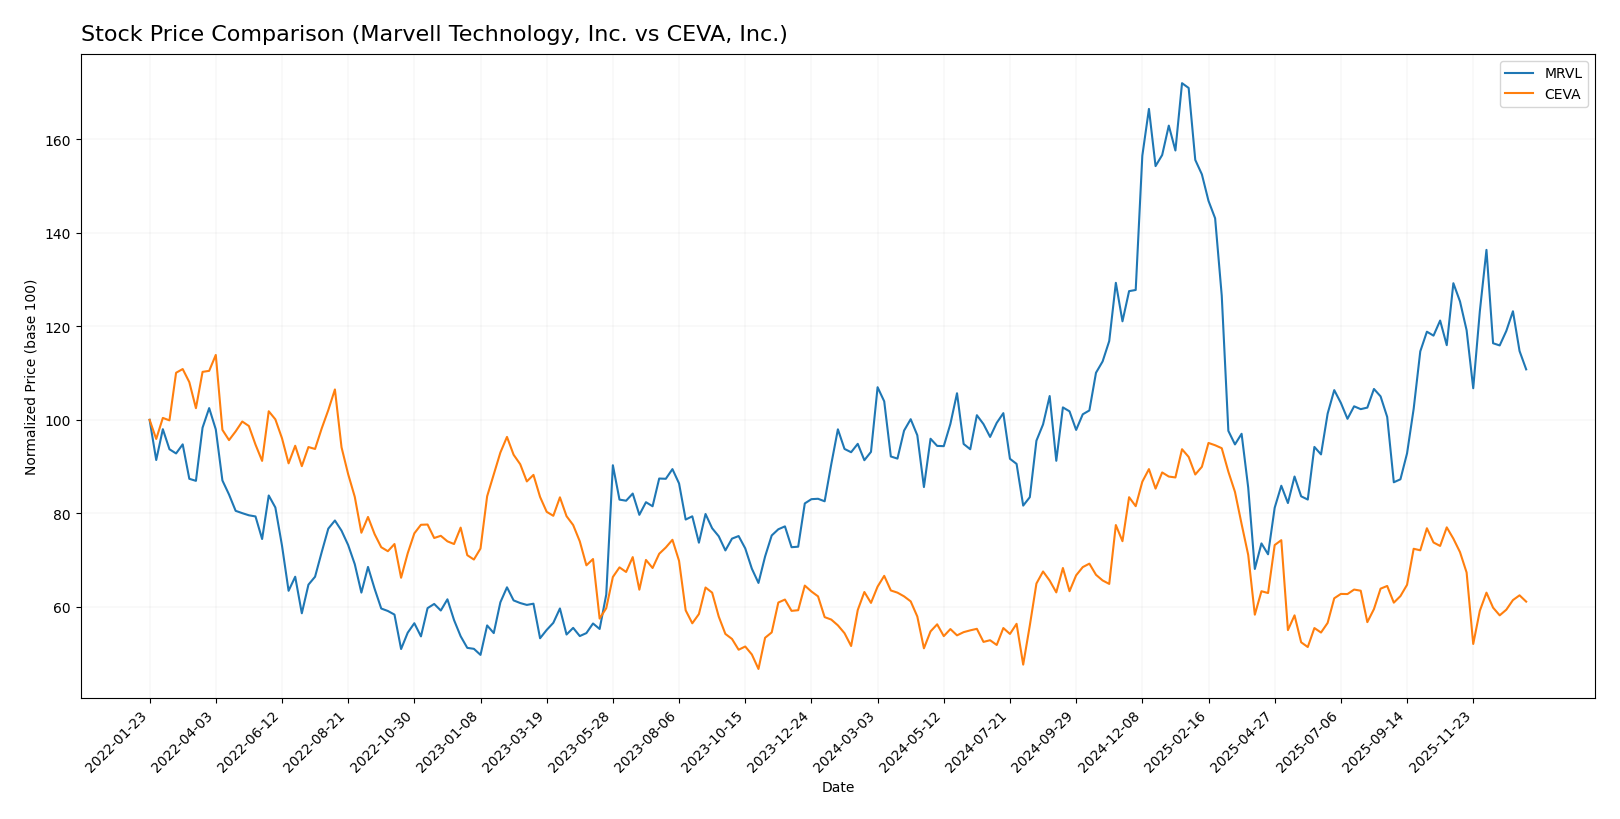
The stock price movements of Marvell Technology, Inc. and CEVA, Inc. over the past 12 months reveal contrasting trends, with Marvell showing a strong bullish trajectory despite recent deceleration, while CEVA’s price has remained largely stable but also faced recent declines.
Trend Analysis
Marvell Technology, Inc. exhibited an 18.94% price increase over the past year, confirming a bullish trend, though this growth has recently decelerated with a 14.25% decline from November 2025 to January 2026.
CEVA, Inc.’s stock price changed by 0.45% over the same 12-month period, indicating a neutral trend overall, but recent months showed an 18.04% decline, reflecting a bearish short-term development.
Comparing the two, Marvell Technology delivered the highest market performance over the year with a clear bullish trend, while CEVA’s price movement was mostly flat, followed by a sharper recent downturn.
Target Prices
The current analyst consensus presents a positive outlook for both Marvell Technology, Inc. and CEVA, Inc.
| Company | Target High | Target Low | Consensus |
|---|---|---|---|
| Marvell Technology, Inc. | 156 | 80 | 117 |
| CEVA, Inc. | 28 | 28 | 28 |
Analysts expect Marvell Technology’s price to rise significantly above its current 80.38 USD, while CEVA’s consensus target price of 28 USD also suggests upward potential from its current 22.30 USD.
Analyst Opinions Comparison
This section compares analysts’ ratings and grades for Marvell Technology, Inc. and CEVA, Inc.:
Rating Comparison
MRVL Rating
- Rating: B+ indicating a very favorable assessment.
- Discounted Cash Flow Score: Moderate rating of 3.
- ROE Score: Favorable rating of 4, showing good efficiency in generating profit from equity.
- ROA Score: Very favorable rating of 5, reflecting excellent asset utilization.
- Debt To Equity Score: Moderate rating of 2, reflecting balanced financial risk.
- Overall Score: Moderate rating of 3.
CEVA Rating
- Rating: C+ indicating a very favorable assessment.
- Discounted Cash Flow Score: Moderate rating of 3.
- ROE Score: Very unfavorable rating of 1, indicating weak profit generation from equity.
- ROA Score: Very unfavorable rating of 1, suggesting poor asset utilization.
- Debt To Equity Score: Favorable rating of 4, indicating lower financial risk.
- Overall Score: Moderate rating of 2.
Which one is the best rated?
Based strictly on the provided data, MRVL is better rated overall with a higher rating of B+ versus CEVA’s C+. MRVL also outperforms CEVA in return on equity and assets, while CEVA scores better on debt to equity.
Scores Comparison
Here is a comparison of the Altman Z-Score and Piotroski Score for Marvell Technology, Inc. and CEVA, Inc.:
MRVL Scores
- Altman Z-Score: 6.76, indicating a safe zone status
- Piotroski Score: 7, representing strong financial health
CEVA Scores
- Altman Z-Score: 9.99, indicating a safe zone status
- Piotroski Score: 4, representing average financial health
Which company has the best scores?
Based on the provided scores, CEVA has a higher Altman Z-Score, indicating stronger bankruptcy safety, while MRVL shows a better Piotroski Score, reflecting stronger overall financial health. Each company excels in different score categories.
Grades Comparison
Here is a comparison of the recent grades assigned to Marvell Technology, Inc. and CEVA, Inc. by established grading companies:
Marvell Technology, Inc. Grades
The following table summarizes recent grading actions from several reputable firms for Marvell Technology, Inc.:
| Grading Company | Action | New Grade | Date |
|---|---|---|---|
| Rosenblatt | Maintain | Buy | 2026-01-07 |
| Melius Research | Upgrade | Buy | 2026-01-05 |
| Benchmark | Downgrade | Hold | 2025-12-08 |
| Evercore ISI Group | Maintain | Outperform | 2025-12-03 |
| Wells Fargo | Maintain | Overweight | 2025-12-03 |
| Piper Sandler | Maintain | Overweight | 2025-12-03 |
| Barclays | Maintain | Equal Weight | 2025-12-03 |
| Goldman Sachs | Maintain | Neutral | 2025-12-03 |
| Jefferies | Maintain | Buy | 2025-12-03 |
| Keybanc | Maintain | Overweight | 2025-12-03 |
Marvell’s grades predominantly indicate a positive outlook with multiple buy and overweight ratings, despite a few hold and neutral grades.
CEVA, Inc. Grades
Below is the recent grading summary for CEVA, Inc. from recognized grading companies:
| Grading Company | Action | New Grade | Date |
|---|---|---|---|
| Barclays | Maintain | Overweight | 2025-11-12 |
| Rosenblatt | Maintain | Buy | 2025-11-11 |
| Rosenblatt | Maintain | Buy | 2025-08-14 |
| Oppenheimer | Maintain | Outperform | 2025-05-09 |
| Rosenblatt | Maintain | Buy | 2025-05-08 |
| Barclays | Maintain | Overweight | 2025-05-08 |
| Rosenblatt | Maintain | Buy | 2025-04-23 |
| Barclays | Maintain | Overweight | 2025-02-14 |
| Rosenblatt | Maintain | Buy | 2025-02-14 |
| Rosenblatt | Maintain | Buy | 2025-02-11 |
CEVA’s grades show consistent buy and overweight ratings with no downgrades reported, reflecting a stable positive consensus.
Which company has the best grades?
Both Marvell Technology and CEVA have strong buy consensus ratings, but Marvell has a larger number of analyst opinions with some recent downgrades and neutral ratings, indicating mixed sentiment. CEVA’s grades are uniformly positive and stable, which might suggest a steadier perception among analysts. Investors should consider these nuances in analyst confidence when evaluating risk and potential reward.
Strengths and Weaknesses
Below is a comparison table highlighting the key strengths and weaknesses of Marvell Technology, Inc. (MRVL) and CEVA, Inc. based on their latest financial and operational data.
| Criterion | Marvell Technology, Inc. (MRVL) | CEVA, Inc. |
|---|---|---|
| Diversification | Highly diversified across Data Center (4.16B), Enterprise Networking (626M), Carrier Infrastructure (338M), Automotive & Industrial (322M), Consumer (316M) | Narrow focus on Licensing (60M) and Royalty (47M) streams, less diversified |
| Profitability | Negative net margin (-15.35%) and ROIC (-3.88%), value destroying | Negative net margin (-8.22%) and ROIC (-2.68%), also value destroying |
| Innovation | Strong fixed asset turnover (5.56) signals efficient asset use, but declining ROIC trend indicates challenges | Higher fixed asset turnover (8.43) but very unfavorable ROIC trend, risking innovation sustainability |
| Global presence | Broad market exposure including data center and networking sectors | Mainly IP licensing model with limited direct market exposure |
| Market Share | Significant presence in multiple segments, especially data center | Smaller footprint, focused on connectivity and smart sensing IP |
Key takeaways: Both companies currently struggle with profitability and value creation, showing declining ROIC trends. Marvell’s diversified product base provides some resilience, while CEVA’s narrow focus limits its growth opportunities. Caution is advised given their unfavorable financial metrics.
Risk Analysis
Below is a comparative risk overview of Marvell Technology, Inc. (MRVL) and CEVA, Inc. based on recent financial data and market conditions.
| Metric | Marvell Technology, Inc. (MRVL) | CEVA, Inc. |
|---|---|---|
| Market Risk | High beta 1.945 indicates elevated market volatility exposure | Moderate beta 1.436 suggests moderate market sensitivity |
| Debt level | Moderate debt-to-equity ratio 0.32, manageable leverage | Very low debt-to-equity ratio 0.02, minimal leverage risk |
| Regulatory Risk | Medium, with global operations in sensitive tech sectors | Medium, operating in wireless and AI IP licensing with regulatory scrutiny |
| Operational Risk | Larger scale with 7K employees, complex supply chains may increase risk | Smaller scale with 406 employees, but dependent on licensing agreements |
| Environmental Risk | Moderate, semiconductor manufacturing has environmental impacts | Lower, primarily IP licensing reduces direct environmental footprint |
| Geopolitical Risk | High, significant presence in Asia including China and Taiwan | Moderate, less manufacturing exposure but global IP licensing |
The most pressing risks are Marvell’s market volatility and geopolitical exposure due to its extensive Asian operations, which can impact supply chains and sales. CEVA’s risks stem more from operational dependency on licensing and moderate market sensitivity. Both companies show financial strain with negative profitability metrics, emphasizing the need for cautious risk management.
Which Stock to Choose?
Marvell Technology, Inc. (MRVL) shows a revenue growth of 94% over 2021-2025 but with declining net income and profitability. Its financial ratios reveal a mixed picture: 43% favorable but 57% unfavorable, with negative returns on equity and assets, yet a solid current ratio and manageable debt. The company’s rating is very favorable with a B+ score.
CEVA, Inc. (CEVA) demonstrates steady revenue growth of 6.6% over 2020-2024 and improving income statement metrics in the last year. Its financial ratios are largely unfavorable (57%) with some strengths in low debt and quick ratio. The firm is rated moderately favorable with a C+ grade, but shows weaker returns on equity and assets than MRVL.
The analysis suggests MRVL might appeal to investors seeking growth potential despite profitability challenges, while CEVA may attract those prioritizing financial stability and lower leverage. Both companies exhibit very unfavorable MOAT evaluations due to declining ROIC vs. WACC, signaling caution regarding value creation.
Disclaimer: Investment carries a risk of loss of initial capital. The past performance is not a reliable indicator of future results. Be sure to understand risks before making an investment decision.
Go Further
I encourage you to read the complete analyses of Marvell Technology, Inc. and CEVA, Inc. to enhance your investment decisions: