Home > Comparison > Technology > LRCX vs CEVA
The strategic rivalry between Lam Research Corporation and CEVA, Inc. shapes the semiconductor industry’s evolution. Lam Research operates as a capital-intensive equipment manufacturer, while CEVA specializes in licensing cutting-edge wireless and AI technologies. This confrontation underscores a contest between asset-heavy manufacturing and IP-driven innovation. This analysis aims to determine which company’s distinct approach delivers the superior risk-adjusted return potential for a well-diversified portfolio.
Table of contents
Companies Overview
Lam Research Corporation and CEVA, Inc. both play pivotal roles in the semiconductor sector, shaping its technological landscape.
Lam Research Corporation: Semiconductor Equipment Innovator
Lam Research Corporation dominates semiconductor fabrication equipment. It generates revenue by designing, manufacturing, and servicing advanced wafer processing systems. In 2026, the company focuses on expanding its product portfolio in plasma etch, deposition, and wafer cleaning technologies, reinforcing its competitive advantage in high-precision chip manufacturing.
CEVA, Inc.: Wireless Connectivity and AI IP Licensor
CEVA, Inc. thrives as a licensor of digital signal processors and AI technologies for wireless connectivity and smart sensing. It licenses platforms for 5G, IoT, and AI applications, generating revenue through IP royalties. The 2026 strategy emphasizes expanding its AI processor and wireless platform portfolio, targeting growth in mobile, automotive, and IoT sectors.
Strategic Collision: Similarities & Divergences
Lam Research and CEVA operate with distinct business philosophies: Lam invests heavily in capital-intensive manufacturing equipment, while CEVA licenses intellectual property with minimal fixed assets. Their primary battleground is semiconductor innovation, but Lam targets fabs directly, and CEVA focuses on chip design firms. This divergence creates unique risk-return profiles: Lam with cyclical capital expenditures, CEVA with scalable licensing revenues.
Income Statement Comparison
This data dissects the core profitability and scalability of both corporate engines to reveal who dominates the bottom line:
| Metric | Lam Research Corporation (LRCX) | CEVA, Inc. (CEVA) |
|---|---|---|
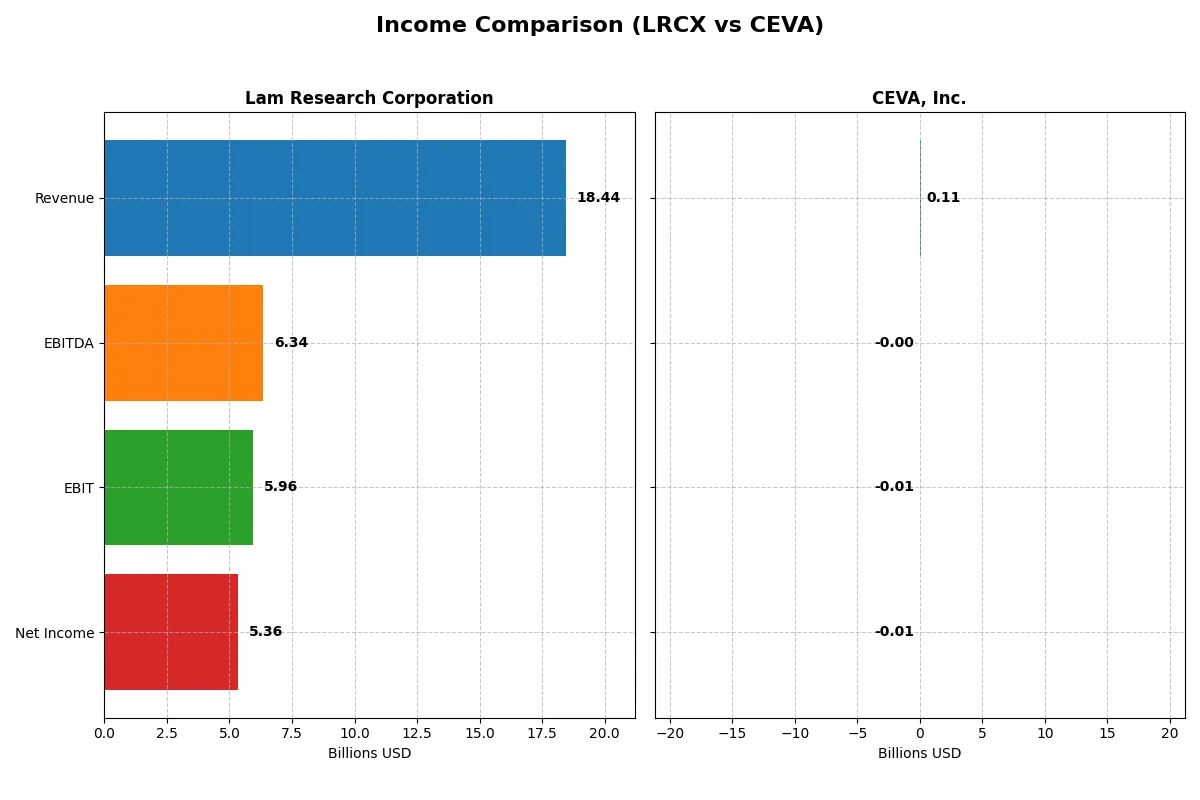
| Revenue | 18.4B | 107M |
| Cost of Revenue | 9.5B | 12.8M |
| Operating Expenses | 3.1B | 102M |
| Gross Profit | 9.0B | 94.2M |
| EBITDA | 6.3B | -3.4M |
| EBIT | 6.0B | -7.5M |
| Interest Expense | 178M | 0 |
| Net Income | 5.4B | -8.8M |
| EPS | 4.17 | -0.37 |
| Fiscal Year | 2025 | 2024 |
Income Statement Analysis: The Bottom-Line Duel
This income statement comparison exposes the true operational efficiency and profitability strength of two distinct corporate engines.
Lam Research Corporation Analysis
Lam Research posts a robust revenue jump from $14.9B in 2024 to $18.4B in 2025, reflecting 23.7% growth. Net income surges 40% to $5.36B, with gross margin steady near 48.7%, and net margin rising to 29.1%. The company exhibits strong operating leverage and margin expansion, signaling efficient cost control amid top-line momentum.
CEVA, Inc. Analysis
CEVA’s revenue climbs modestly by 9.8% to $107M in 2024, but it remains a net loss maker with a $8.8M deficit. Gross margin impresses at 88%, yet EBIT margin stays negative at -7.1%, indicating ongoing operating challenges. Despite recent margin improvement, persistent net losses highlight structural profitability hurdles and limited scale compared to peers.
Verdict: Scale and Margin Strength vs. Emerging Profitability Challenges
Lam Research dominates with superior scale, favorable margin profiles, and consistent bottom-line growth, reflecting a mature, efficient business. CEVA shows promising gross margin but struggles to translate revenue into profits, hampered by negative net margins. For investors prioritizing financial strength and reliable earnings, Lam’s profile offers clearer fundamental appeal.
Financial Ratios Comparison
These vital ratios act as a diagnostic tool to expose the underlying fiscal health, valuation premiums, and capital efficiency of the companies compared below:
| Ratios | Lam Research Corporation (LRCX) | CEVA, Inc. (CEVA) |
|---|---|---|
| ROE | 54.33% | -3.30% |
| ROIC | 34.00% | -2.68% |
| P/E | 23.36 | -84.79 |
| P/B | 12.69 | 2.79 |
| Current Ratio | 2.21 | 7.09 |
| Quick Ratio | 1.55 | 7.09 |
| D/E | 0.48 | 0.02 |
| Debt-to-Assets | 22.28% | 1.80% |
| Interest Coverage | 33.11 | 0 |
| Asset Turnover | 0.86 | 0.35 |
| Fixed Asset Turnover | 7.59 | 8.43 |
| Payout Ratio | 21.45% | 0 |
| Dividend Yield | 0.92% | 0 |
| Fiscal Year | 2025 | 2024 |
Efficiency & Valuation Duel: The Vital Signs
Financial ratios serve as a company’s DNA, exposing hidden risks and operational strengths that numbers alone cannot reveal.
Lam Research Corporation
Lam Research exhibits robust profitability with a 54.3% ROE and a strong 29.1% net margin, signaling operational excellence. Its P/E at 23.4 is reasonable, reflecting a fairly valued stock. Lam Research maintains a solid shareholder return approach, combining modest dividends with reinvestment in R&D at 11.4% of revenue to fuel growth.
CEVA, Inc.
CEVA struggles with profitability, showing negative ROE of -3.3% and an -8.2% net margin, indicating ongoing operational challenges. The stock’s negative P/E and a P/B near 2.8 suggest valuation uncertainty. CEVA does not pay dividends, focusing heavily on R&D (67%) to drive innovation, but this strategy has yet to translate into positive returns.
Premium Valuation vs. Operational Struggles
Lam Research offers a superior balance of profitability and valuation discipline, underpinned by strong cash flows and prudent capital allocation. CEVA’s metrics reveal high risk and weak returns despite aggressive R&D spending. Investors seeking operational safety and steady returns may lean toward Lam Research’s profile, while CEVA suits those willing to embrace high risk for potential innovation payoffs.
Which one offers the Superior Shareholder Reward?
Lam Research Corporation (LRCX) delivers a more robust shareholder reward compared to CEVA, Inc. LRCX pays a consistent dividend with a 0.9% yield and a sustainable 21%-27% payout ratio, backed by strong free cash flow coverage above 80%. Its buyback program further enhances total returns, reflecting disciplined capital allocation. CEVA, in contrast, pays no dividend, struggles with negative margins, and shows minimal free cash flow, relying heavily on reinvestment for growth. While CEVA’s high current ratio indicates liquidity, its lack of profitability and buyback activity limit shareholder reward. I conclude LRCX offers a more attractive and sustainable total return profile in 2026.
Comparative Score Analysis: The Strategic Profile
The radar chart reveals the fundamental DNA and trade-offs of both firms across key financial metrics:
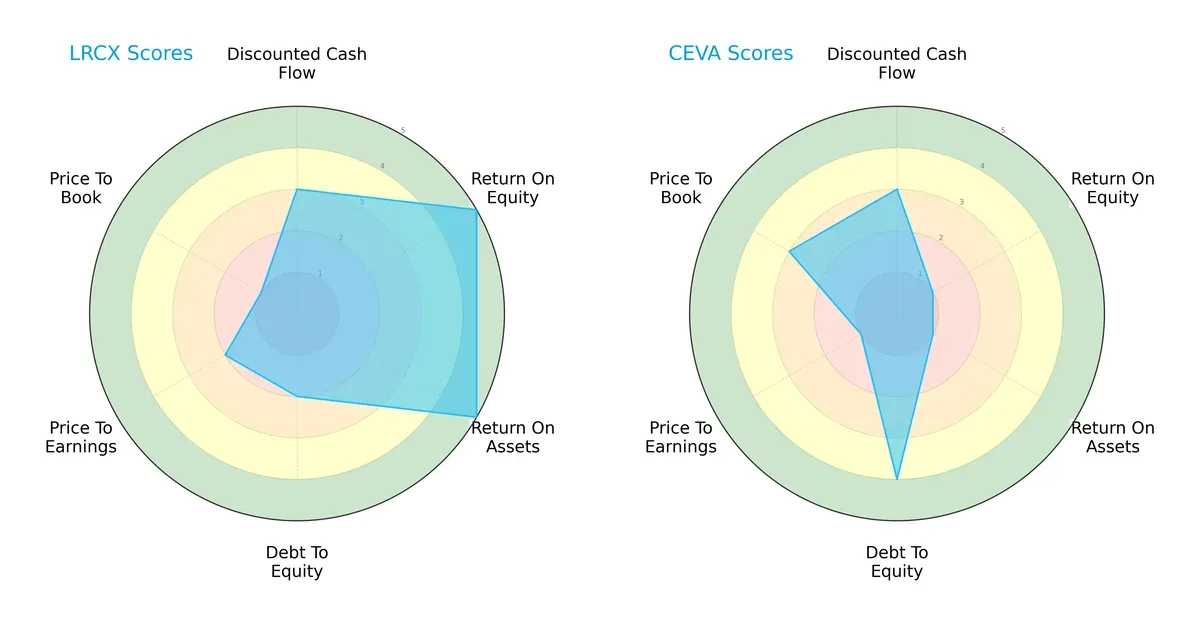
Lam Research Corporation (LRCX) shows strength in profitability with top ROE and ROA scores of 5 each, outperforming CEVA’s weak scores of 1. LRCX’s balance sheet is more leveraged, scoring 2 on debt-to-equity versus CEVA’s 4, indicating CEVA’s lower financial risk. However, CEVA scores better on price-to-book valuation, suggesting relative undervaluation. LRCX presents a more balanced profile, while CEVA relies heavily on its lower leverage and valuation edge.
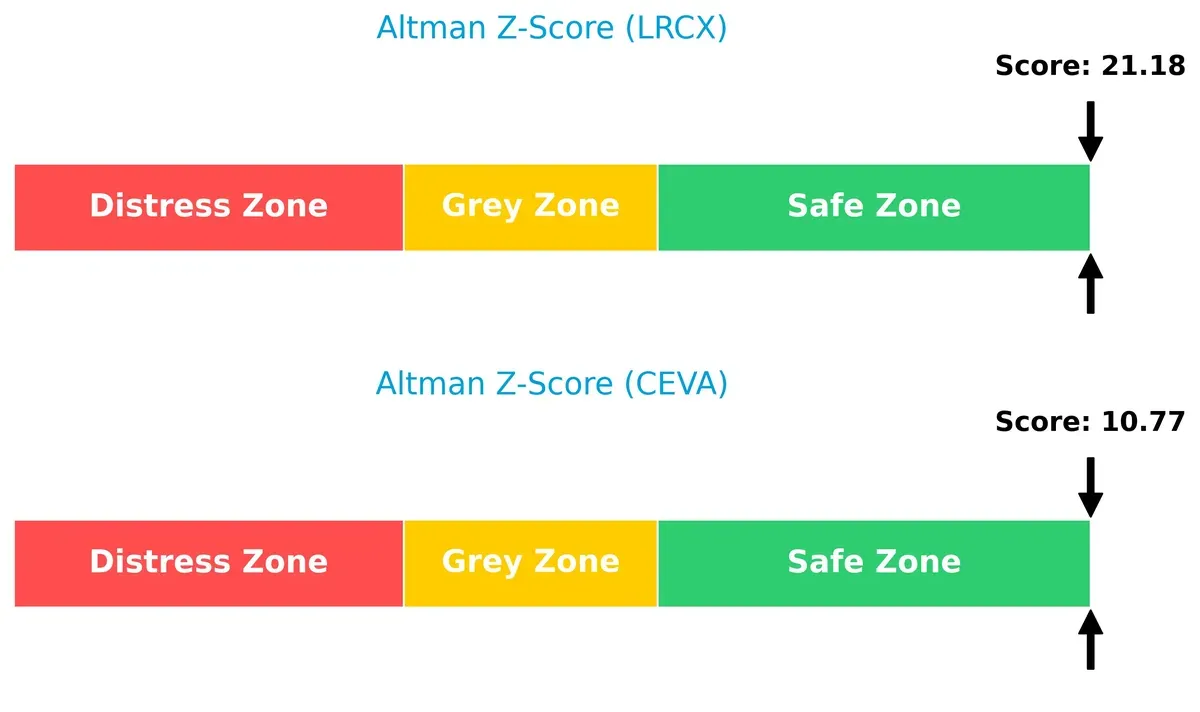
Bankruptcy Risk: Solvency Showdown
Lam Research’s Altman Z-Score of 21.2 vastly exceeds CEVA’s 10.8, placing both comfortably in the safe zone but highlighting LRCX’s superior financial stability and resilience for long-term survival in volatile cycles:
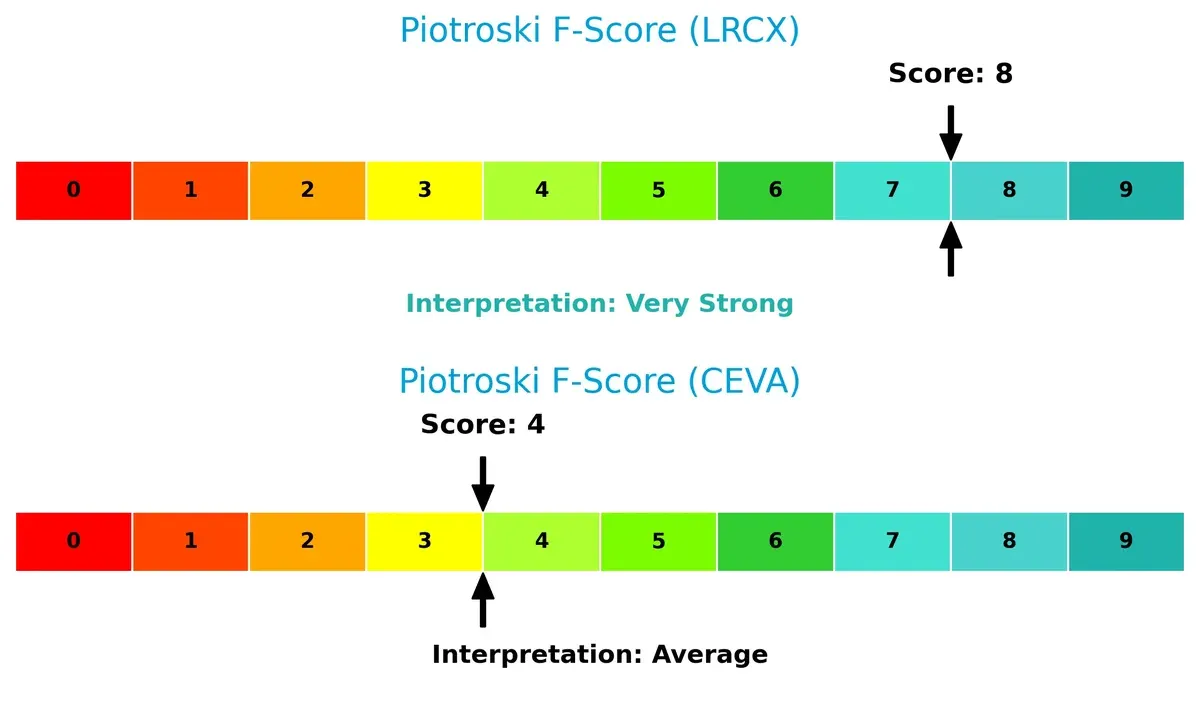
Financial Health: Quality of Operations
Lam Research achieves a Piotroski F-Score of 8, signaling very strong financial health and efficient internal operations. CEVA’s score of 4 flags average financial strength and potential red flags in key operational metrics compared to LRCX:
How are the two companies positioned?
This section dissects the operational DNA of Lam Research and CEVA by comparing their revenue distribution and internal dynamics. The goal is to confront their economic moats to reveal which model delivers the most resilient competitive advantage today.
Revenue Segmentation: The Strategic Mix
This comparison dissects how Lam Research Corporation and CEVA, Inc. diversify income streams and reveals their primary sector bets for strategic insight:
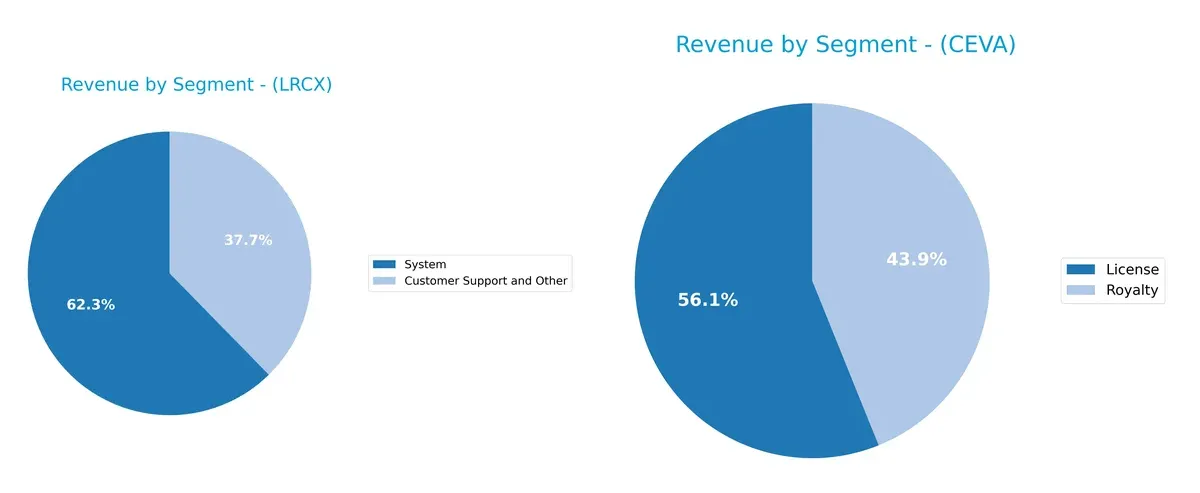
Lam Research anchors its revenue in two segments: Systems at $11.5B and Customer Support at $6.9B (2025). CEVA shows more diversification with License and Royalty revenues near $60M and $47M respectively (2024). Lam’s heavy system reliance signals infrastructure dominance but carries concentration risk. CEVA’s split between licensing and royalties suggests a balanced, innovation-driven ecosystem, reducing dependency on a single revenue source.
Strengths and Weaknesses Comparison
This table compares the Strengths and Weaknesses of Lam Research Corporation and CEVA, Inc.:
Lam Research Corporation Strengths
- High profitability with 29% net margin and 54% ROE
- Strong financial health shown by 2.21 current ratio and low debt-to-assets at 22%
- Solid innovation reflected in superior fixed asset turnover of 7.59
- Extensive global presence with significant revenue from China, Korea, and Taiwan
- Diversified revenue with $11.5B in Systems and $6.9B in Customer Support
CEVA, Inc. Strengths
- Low debt ratio at 2% and favorable quick ratio of 7.09 indicating liquidity
- Efficient fixed asset turnover at 8.43 suggests innovation focus
- Reasonable price-to-book at 2.79 and favorable P/E despite negative earnings
- Global reach including Asia Pacific, China, and US markets
- Revenue streams from License and Royalty products
Lam Research Corporation Weaknesses
- High price-to-book ratio at 12.69 may indicate overvaluation risk
- Weighted average cost of capital (WACC) at 12% exceeds ROIC benchmark
- Dividend yield under 1% limits income appeal
- Moderate asset turnover at 0.86 suggests room for efficiency gains
CEVA, Inc. Weaknesses
- Negative profitability metrics including -8% net margin and -3.3% ROE
- Zero interest coverage raises solvency concerns
- Unfavorable current ratio at 7.09 signals potential liquidity risk
- Negative ROIC and WACC at 10.5% indicate capital allocation challenges
- No dividend yield limits shareholder return
Lam Research demonstrates robust profitability and global diversification supported by strong financials, though valuation and capital cost caution remain. CEVA shows strengths in asset efficiency and liquidity but faces significant profitability and solvency hurdles. Both companies’ strategies must address these financial dynamics to optimize investor value.
The Moat Duel: Analyzing Competitive Defensibility
A structural moat is the only reliable shield protecting long-term profits from relentless competitive erosion:
Lam Research Corporation: Durable Capital Efficiency Moat
Lam Research’s moat stems from its unique semiconductor equipment technology and scale. It shows a robust 22% ROIC premium over WACC, with stable margins and 26% revenue growth. New process innovations and expanded Asia-Pacific exposure deepen this moat in 2026.
CEVA, Inc.: Intellectual Property Licensing Moat
CEVA’s moat is based on proprietary wireless and AI DSP technology IP. Unlike Lam, CEVA struggles with negative ROIC and shrinking profitability despite high gross margins. Its future hinges on successful market expansion in IoT and AI modules to reverse value destruction.
Capital Efficiency vs. IP Licensing: The Moat Battle
Lam Research commands a wider, more durable moat through consistent value creation and operational scale. CEVA’s declining ROIC signals a fragile moat, leaving Lam better positioned to defend market share amid semiconductor industry shifts.
Which stock offers better returns?
The past year reveals stark contrasts: Lam Research soars with a 144% surge and accelerating gains, while CEVA slides 13%, reflecting sustained bearish momentum.
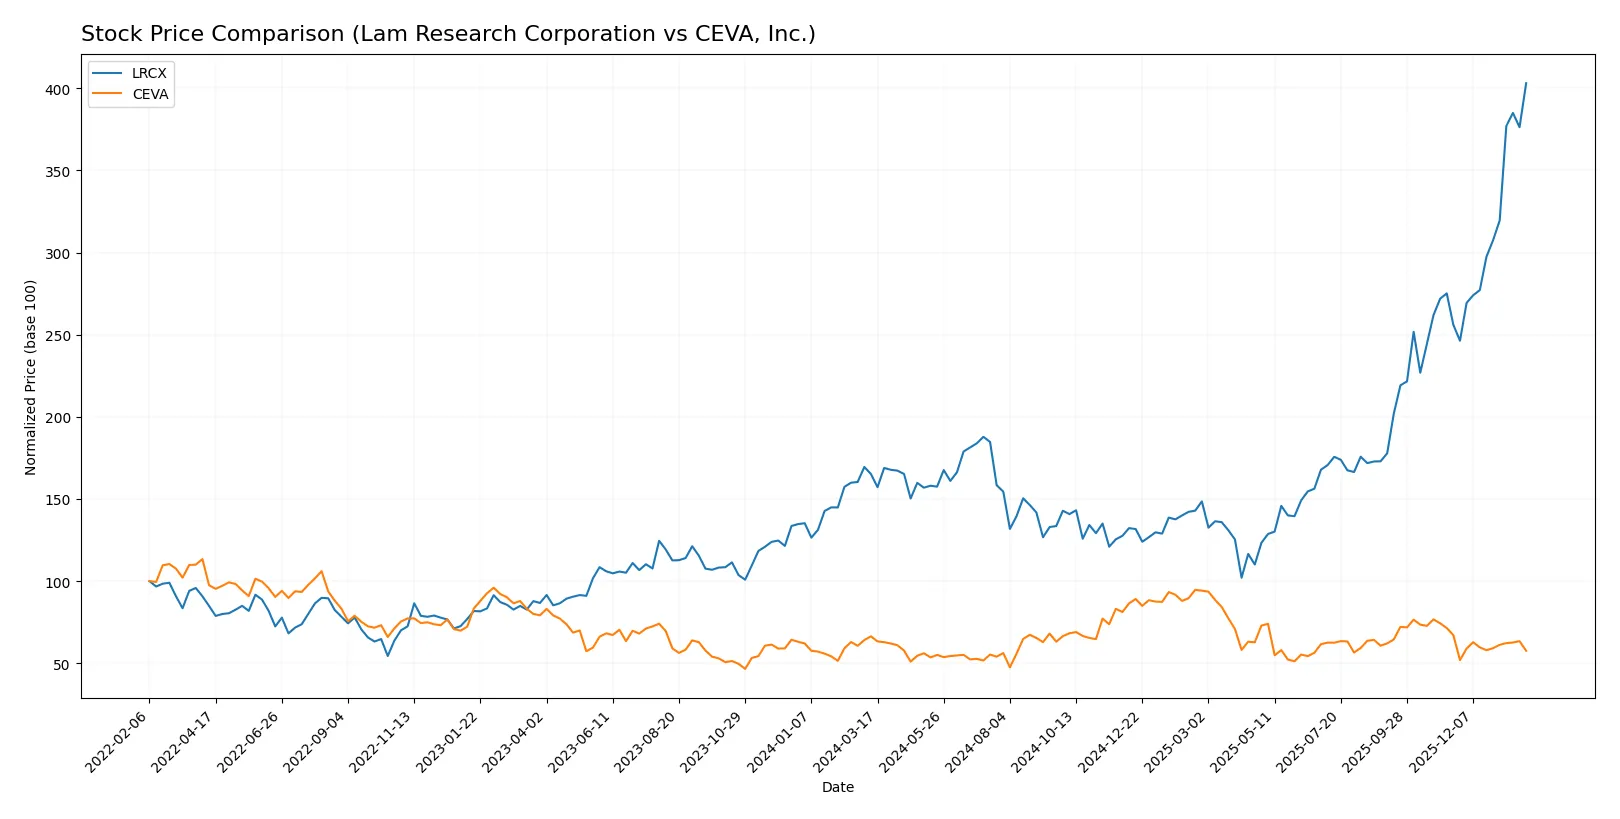
Trend Comparison
Lam Research’s stock price rose 144% over the past 12 months, showing a bullish trend with accelerating momentum and high volatility (std dev 36.82). It reached a peak of 233.46 and a low of 59.09.
CEVA’s stock declined 13.25% over the same period, marking a bearish trend with accelerating losses and low volatility (std dev 4.4). The price ranged between 17.39 and 34.67.
Lam Research outperformed CEVA significantly, delivering strong positive returns versus CEVA’s negative trend. Lam Research offers the highest market performance.
Target Prices
Analysts present a mixed but optimistic target consensus for Lam Research Corporation and CEVA, Inc.
| Company | Target Low | Target High | Consensus |
|---|---|---|---|
| Lam Research Corporation | 127 | 325 | 266.76 |
| CEVA, Inc. | 28 | 28 | 28 |
Lam Research’s target consensus at 267 exceeds its current 233 price, suggesting upside potential. CEVA’s consensus target of 28 also implies room for price appreciation from 21.09.

Don’t Let Luck Decide Your Entry Point
Optimize your entry points with our advanced ProRealTime indicators. You’ll get efficient buy signals with precise price targets for maximum performance. Start outperforming now!
How do institutions grade them?
Lam Research Corporation Grades
The following table summarizes recent institutional grades for Lam Research Corporation:
| Grading Company | Action | New Grade | Date |
|---|---|---|---|
| Susquehanna | Maintain | Positive | 2026-01-29 |
| Citigroup | Maintain | Buy | 2026-01-29 |
| RBC Capital | Maintain | Outperform | 2026-01-29 |
| Needham | Maintain | Buy | 2026-01-29 |
| UBS | Maintain | Buy | 2026-01-29 |
| Cantor Fitzgerald | Maintain | Overweight | 2026-01-29 |
| Goldman Sachs | Maintain | Buy | 2026-01-29 |
| Morgan Stanley | Maintain | Equal Weight | 2026-01-29 |
| Wells Fargo | Maintain | Overweight | 2026-01-29 |
| Stifel | Maintain | Buy | 2026-01-29 |
CEVA, Inc. Grades
The following table summarizes recent institutional grades for CEVA, Inc.:
| Grading Company | Action | New Grade | Date |
|---|---|---|---|
| Barclays | Maintain | Overweight | 2025-11-12 |
| Rosenblatt | Maintain | Buy | 2025-11-11 |
| Rosenblatt | Maintain | Buy | 2025-08-14 |
| Oppenheimer | Maintain | Outperform | 2025-05-09 |
| Rosenblatt | Maintain | Buy | 2025-05-08 |
| Barclays | Maintain | Overweight | 2025-05-08 |
| Rosenblatt | Maintain | Buy | 2025-04-23 |
| Barclays | Maintain | Overweight | 2025-02-14 |
| Rosenblatt | Maintain | Buy | 2025-02-14 |
| Rosenblatt | Maintain | Buy | 2025-02-11 |
Which company has the best grades?
Lam Research Corporation consistently receives strong buy and outperform grades from top-tier institutions. CEVA, Inc. also earns positive ratings but with fewer top-tier “Outperform” labels. This suggests Lam Research commands stronger institutional confidence, potentially impacting investor sentiment and valuation.
Risks specific to each company
The following categories identify the critical pressure points and systemic threats facing both firms in the 2026 market environment:
1. Market & Competition
Lam Research Corporation
- Dominates semiconductor equipment with strong product portfolio and global reach.
CEVA, Inc.
- Faces intense competition in IP licensing for wireless and AI tech with smaller scale.
2. Capital Structure & Debt
Lam Research Corporation
- Maintains moderate debt (D/E 0.48) with strong interest coverage, supporting financial stability.
CEVA, Inc.
- Very low debt (D/E 0.02) but zero interest coverage raises concerns on operational profitability.
3. Stock Volatility
Lam Research Corporation
- Exhibits higher beta (1.78), indicating greater market sensitivity and risk.
CEVA, Inc.
- Lower beta (1.44) suggests comparatively less price volatility but still above market average.
4. Regulatory & Legal
Lam Research Corporation
- Operates in heavily regulated semiconductor equipment industry with exposure to export controls.
CEVA, Inc.
- Licensing business model faces IP protection risks and evolving telecom regulations.
5. Supply Chain & Operations
Lam Research Corporation
- Complex global supply chain subject to geopolitical tensions and component shortages.
CEVA, Inc.
- Relies on OEM partners; less exposed to direct supply chain disruptions but dependent on licensees’ success.
6. ESG & Climate Transition
Lam Research Corporation
- Large manufacturing footprint requires aggressive ESG compliance and carbon reduction initiatives.
CEVA, Inc.
- Software and IP focus lowers direct environmental impact but faces scrutiny on governance and social responsibility.
7. Geopolitical Exposure
Lam Research Corporation
- Significant China and Asia-Pacific market exposure amid US-China tech tensions.
CEVA, Inc.
- Less direct physical presence overseas but exposed via global licensees and supply chain.
Which company shows a better risk-adjusted profile?
Lam Research faces notable geopolitical and supply chain risks but boasts strong financial health and market dominance. CEVA’s biggest risk lies in operational losses and weak profitability despite low leverage. The firm’s licensing model limits capital risk but increases dependency on partners. Lam Research delivers a more robust risk-adjusted profile, supported by a very strong Piotroski score and safe Altman Z-score. CEVA’s financial fragility and unfavorable profitability metrics heighten its risk, raising caution for investors despite its moderate volatility and low debt.
Final Verdict: Which stock to choose?
Lam Research Corporation (LRCX) shines as a powerhouse of operational excellence and capital efficiency. Its superpower lies in generating robust returns on invested capital well above its cost of capital, signaling durable competitive advantages. The main point of vigilance remains its premium valuation metrics, which may pressure future returns. LRCX suits an Aggressive Growth portfolio focused on quality and momentum.
CEVA, Inc. (CEVA) offers a strategic moat rooted in its niche intellectual property and high R&D intensity. Its low leverage and strong liquidity provide a safety cushion relative to LRCX’s more aggressive profile. However, ongoing profitability challenges and value erosion highlight risks. CEVA fits a GARP (Growth at a Reasonable Price) portfolio for investors seeking exposure to innovation with downside protection.
If you prioritize sustained value creation and strong financial health, LRCX is the compelling choice due to its proven moat and consistent earnings growth. However, if you seek exposure to emerging technology with a conservative balance sheet, CEVA offers better stability despite current profitability headwinds. Both present distinct analytical scenarios for investors matching different risk-return appetites.
Disclaimer: Investment carries a risk of loss of initial capital. The past performance is not a reliable indicator of future results. Be sure to understand risks before making an investment decision.
Go Further
I encourage you to read the complete analyses of Lam Research Corporation and CEVA, Inc. to enhance your investment decisions: