Home > Comparison > Technology > KLAC vs CEVA
The strategic rivalry between KLA Corporation and CEVA, Inc. shapes the semiconductor sector’s innovation frontier. KLA operates as a capital-intensive semiconductor process control leader, while CEVA licenses cutting-edge wireless connectivity and AI processor technologies. This clash highlights a contest between manufacturing dominance and intellectual property-driven growth. This analysis aims to identify which company’s business model offers superior risk-adjusted returns for a diversified portfolio in today’s technology landscape.
Table of contents
Companies Overview
KLA Corporation and CEVA, Inc. are pivotal players shaping semiconductor technology and innovation in 2026.
KLA Corporation: Semiconductor Process Control Leader
KLA Corporation dominates the semiconductor process control sector, generating revenue through advanced wafer inspection, metrology, and defect management solutions. In 2026, KLA strategically focuses on enhancing integrated circuit manufacturing with cutting-edge process control and specialty semiconductor technologies. Its broad product suite supports high-value OEMs in improving yield and quality across semiconductor, PCB, and display markets.
CEVA, Inc.: Wireless and AI IP Licensing Specialist
CEVA, Inc. leads as a licensor of wireless connectivity and smart sensing IP, delivering DSP cores, AI processors, and software platforms for 5G, IoT, and AI applications. Its revenue model relies on licensing intellectual property to semiconductor and OEM companies. In 2026, CEVA emphasizes expanding its AI and sensor fusion technologies, targeting multiple IoT sectors from wearables to automotive, enabling customers’ product innovation without heavy hardware investment.
Strategic Collision: Similarities & Divergences
Both companies operate within the semiconductor ecosystem but diverge sharply in business models. KLA controls its value chain through hardware and software solutions, while CEVA adopts an open licensing model focused on IP. The primary battleground lies in semiconductor innovation—KLA in manufacturing process excellence, CEVA in embedded wireless and AI capabilities. Their investment profiles contrast: KLA offers scale and process dominance, CEVA delivers niche IP exposure with higher growth optionality.
Income Statement Comparison
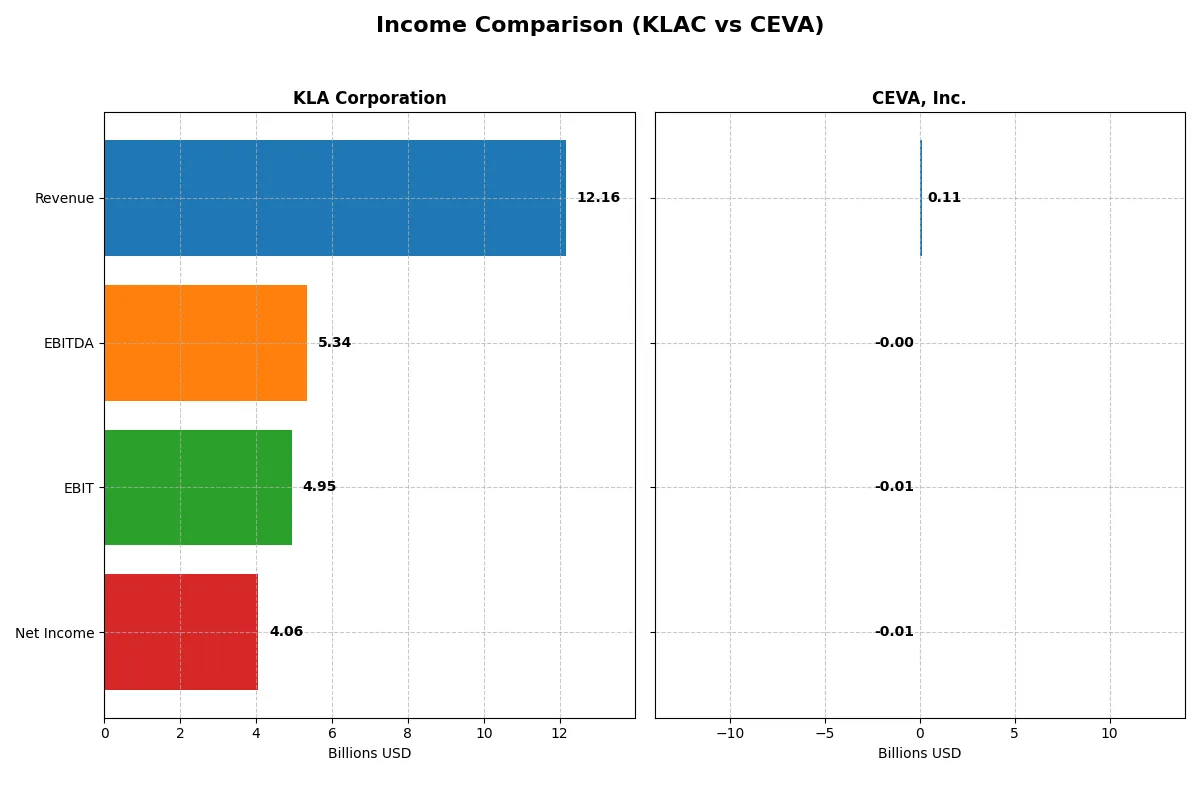
This data dissects the core profitability and scalability of both corporate engines to reveal who dominates the bottom line:
| Metric | KLA Corporation (KLAC) | CEVA, Inc. (CEVA) |
|---|---|---|
| Revenue | 12.16B | 107M |
| Cost of Revenue | 4.58B | 13M |
| Operating Expenses | 2.33B | 102M |
| Gross Profit | 7.58B | 94M |
| EBITDA | 5.34B | -3.4M |
| EBIT | 4.95B | -7.55M |
| Interest Expense | 302M | 0 |
| Net Income | 4.06B | -8.79M |
| EPS | 30.53 | -0.37 |
| Fiscal Year | 2025 | 2024 |
Income Statement Analysis: The Bottom-Line Duel
This income statement comparison reveals the true efficiency and profitability dynamics of KLA Corporation and CEVA, Inc. over recent years.
KLA Corporation Analysis
KLA’s revenue surged from 6.9B in 2021 to 12.2B in 2025, nearly doubling its scale. Its net income followed suit, rising from 2.1B to 4.1B, showcasing robust profit growth. Gross margin holds steady above 62%, while net margin expanded to 33%, reflecting excellent operational leverage and expense control in 2025.
CEVA, Inc. Analysis
CEVA’s revenue grew modestly from 100M in 2020 to 107M in 2024, with a 9.8% increase in the latest year. However, it continues to report net losses, including -8.8M in 2024, despite a strong gross margin above 88%. Negative EBIT and net margins highlight ongoing challenges in converting sales into profitability, though recent margin improvements suggest some operational momentum.
Margin Power vs. Revenue Scale
KLA dominates with superior revenue scale and consistently strong margins, delivering double-digit net margin and near 24% EPS growth over five years. CEVA shows better gross margin but struggles with negative net income and volatile EPS. For investors, KLA’s profile signals a fundamentally healthier and more efficient business engine.
Financial Ratios Comparison
These vital ratios act as a diagnostic tool to expose the underlying fiscal health, valuation premiums, and capital efficiency of the companies compared below:
| Ratios | KLA Corporation (KLAC) | CEVA, Inc. (CEVA) |
|---|---|---|
| ROE | 86.6% | -3.3% |
| ROIC | 38.0% | -2.7% |
| P/E | 29.3 | -84.8 |
| P/B | 25.4 | 2.79 |
| Current Ratio | 2.62 | 7.09 |
| Quick Ratio | 1.83 | 7.09 |
| D/E | 1.30 | 0.021 |
| Debt-to-Assets | 37.9% | 1.8% |
| Interest Coverage | 17.3 | 0 |
| Asset Turnover | 0.76 | 0.35 |
| Fixed Asset Turnover | 9.70 | 8.43 |
| Payout ratio | 22.3% | 0% |
| Dividend yield | 0.76% | 0% |
| Fiscal Year | 2025 | 2024 |
Efficiency & Valuation Duel: The Vital Signs
Ratios act as a company’s DNA, unveiling hidden risks and operational strengths that shape investor decisions profoundly.
KLA Corporation
KLA shows exceptional profitability with an 86.6% ROE and a strong 33.4% net margin, signaling operational efficiency. Its valuation appears stretched, with a P/E at 29.3 and P/B at 25.4, reflecting high market expectations. Shareholders receive a modest 0.76% dividend yield, indicating some capital return alongside reinvestment in R&D (11.1% of revenue) for growth.
CEVA, Inc.
CEVA struggles with negative profitability metrics: ROE at -3.3% and net margin at -8.2%, indicating operational challenges. The P/E is negative but considered favorable due to losses distorting the ratio; P/B at 2.8 is reasonable. The company pays no dividends, focusing heavily on R&D (66.9% of revenue), which suggests a growth strategy amid financial weakness.
Premium Valuation vs. Operational Struggles
KLA offers a superior balance of strong profitability and moderate risk despite its high valuation multiples. CEVA’s metrics reflect operational difficulties and higher risk, offset by aggressive reinvestment. Investors seeking stability may prefer KLA, while those favoring growth potential might consider CEVA’s riskier profile.
Which one offers the Superior Shareholder Reward?
I observe KLA Corporation champions a balanced distribution model with a 0.76% dividend yield and a 22% payout ratio, supported by strong free cash flow (FCF) coverage at 92%. KLA also runs an intense buyback program, enhancing total shareholder returns sustainably. In contrast, CEVA, Inc. pays no dividends and shows negligible buybacks, reinvesting primarily in R&D and growth but delivering negative profit margins and minimal free cash flow. Historically in tech sectors, steady dividends coupled with buybacks signal mature capital allocation and risk management. I conclude KLA offers the superior total return profile in 2026, blending yield, buybacks, and sustainability effectively.
Comparative Score Analysis: The Strategic Profile
The radar chart reveals the fundamental DNA and trade-offs of KLA Corporation and CEVA, Inc., highlighting their strategic strengths and vulnerabilities:
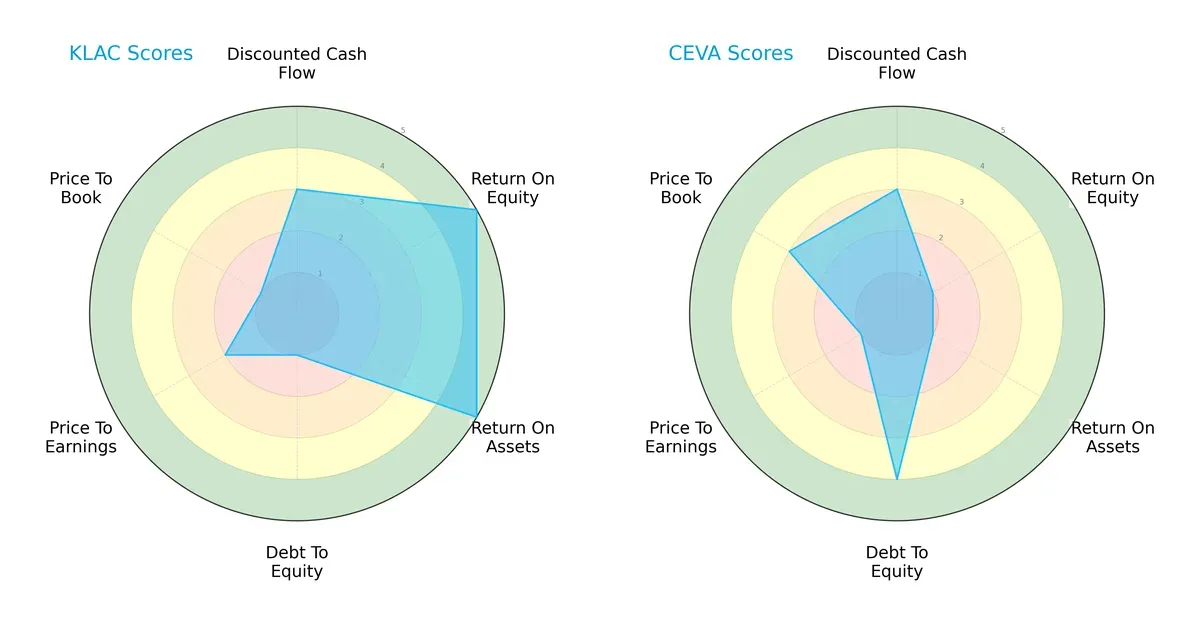
KLA shows a balanced profile with very favorable ROE (5) and ROA (5), but weak debt (1) and valuation scores (PE 2, PB 1). CEVA relies on a stronger balance sheet (debt score 4) but struggles with profitability (ROE 1, ROA 1) and valuation (PE 1). KLA dominates profitability; CEVA leans on financial stability.
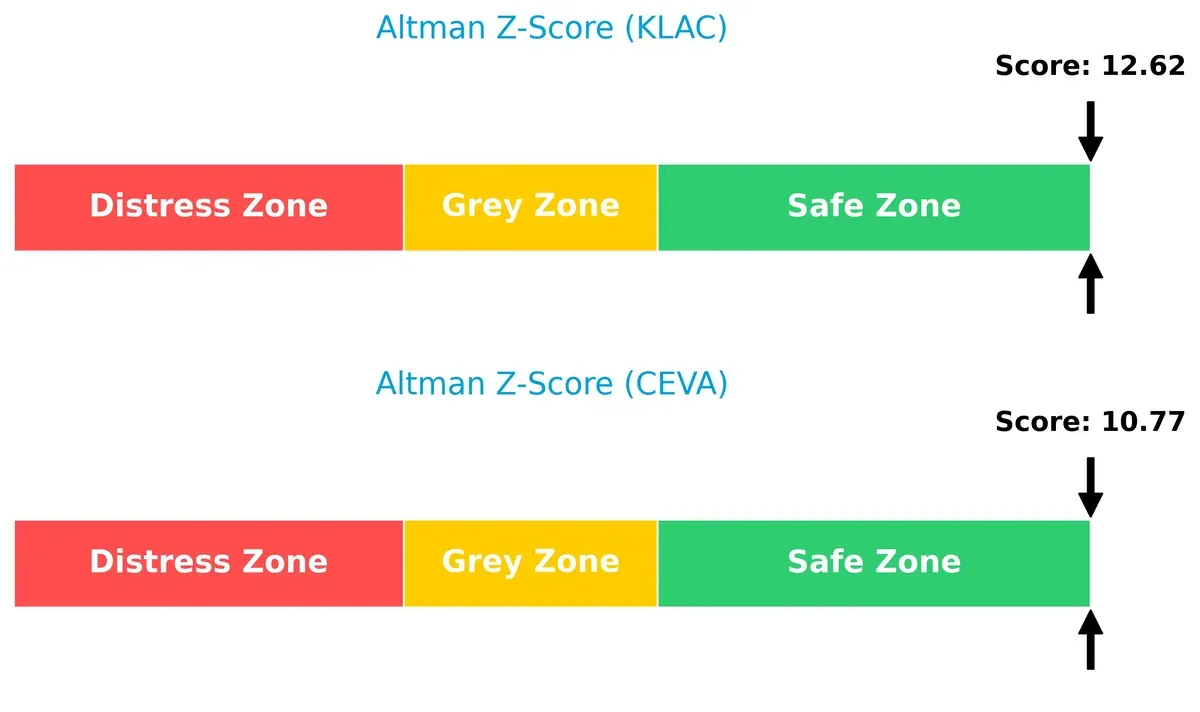
Bankruptcy Risk: Solvency Showdown
KLA’s Altman Z-Score (12.6) surpasses CEVA’s (10.8), placing both comfortably in the safe zone. This suggests robust financial health with minimal bankruptcy risk in this cycle:
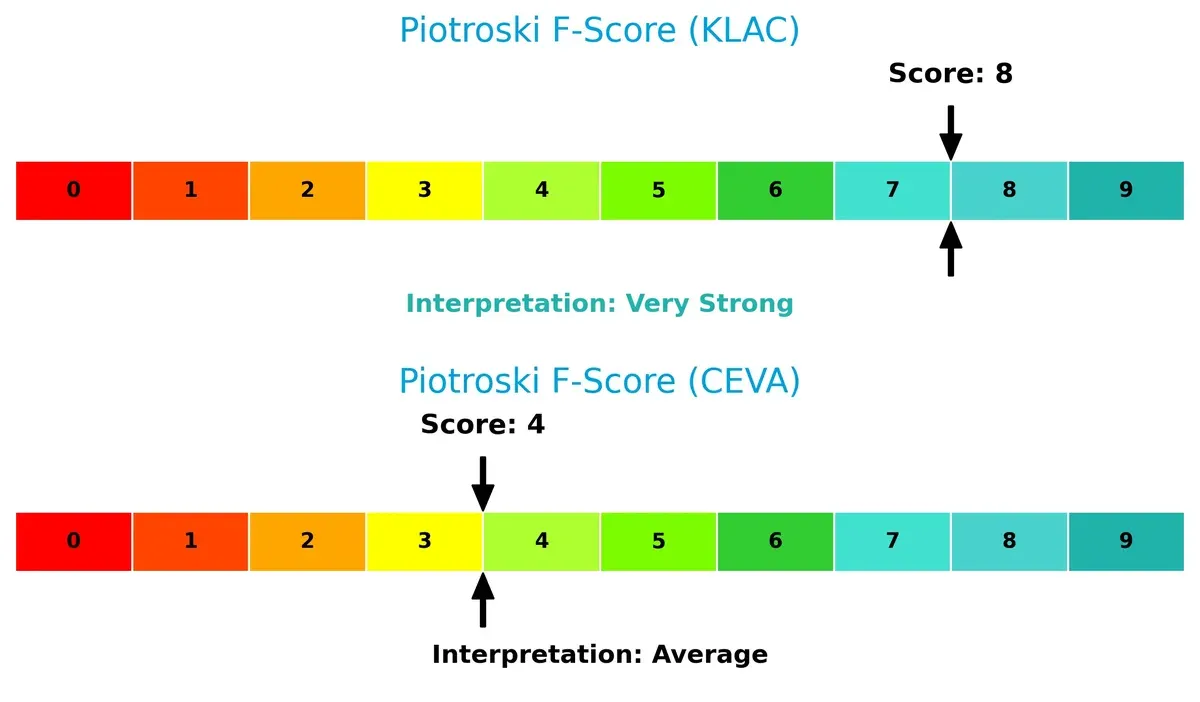
Financial Health: Quality of Operations
KLA scores an 8 on the Piotroski F-Score, signaling very strong financial health. CEVA’s 4 indicates average operational quality, exposing potential internal risks:
How are the two companies positioned?
This section dissects KLAC and CEVA’s operational DNA by comparing their revenue distribution and internal dynamics—strengths and weaknesses. The final goal is to confront their economic moats to identify which business model offers the most resilient and sustainable competitive advantage today.
Revenue Segmentation: The Strategic Mix
This visual comparison dissects how KLA Corporation and CEVA, Inc. diversify their income streams and where their primary sector bets lie:
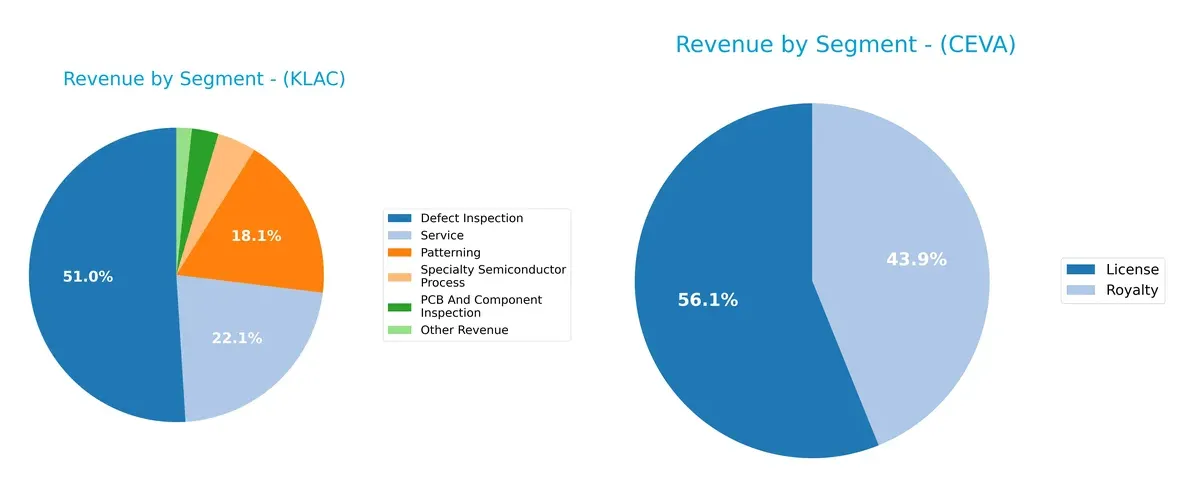
KLA Corporation anchors its revenue in Defect Inspection at $6.2B, dwarfing other segments like Service ($2.7B) and Patterning ($2.2B). This concentration signals strong infrastructure dominance but also concentration risk. CEVA, Inc. shows a more balanced mix, pivoting between License ($60M) and Royalty ($47M) revenues, reflecting a licensing-dependent model with less scale but broader product exposure. KLA’s scale grants ecosystem lock-in; CEVA’s model offers flexibility but less moat.
Strengths and Weaknesses Comparison
This table compares the Strengths and Weaknesses of KLA Corporation and CEVA, Inc.:
KLA Corporation Strengths
- Strong profitability with 33.4% net margin and 86.6% ROE
- High ROIC of 38% well above WACC
- Solid liquidity ratios with current ratio 2.62 and quick ratio 1.83
- Diversified revenue streams including defect inspection, patterning, and services
- Significant global presence in China, Taiwan, Korea, and North America
CEVA, Inc. Strengths
- Low debt levels with D/E of 0.02 and debt-to-assets 1.8%
- Favorable quick ratio of 7.09 indicating short-term liquidity
- Diverse product lines in connectivity, smart sensing, and licensing
- Presence in Asia Pacific, China, Europe, and US markets
- Favorable P/E valuation compared to sector norms
KLA Corporation Weaknesses
- High valuation multiples with P/E of 29.3 and P/B of 25.4 seen as unfavorable
- Elevated debt-to-equity ratio of 1.3
- Dividend yield low at 0.76% suggesting limited income return
- WACC at 10.4% weighs on capital efficiency
- Moderate asset turnover at 0.76 limits revenue generation from assets
CEVA, Inc. Weaknesses
- Negative profitability metrics with net margin -8.2%, ROE -3.3%, and ROIC -2.7%
- Unfavorable interest coverage at 0 indicating financial stress
- Low asset turnover of 0.35 signals inefficiency
- No dividend yield offered
- Current ratio at 7.09 flagged as unfavorable, possibly due to cash management issues
KLA demonstrates robust profitability and diversified revenue, supporting a strong competitive position despite high valuation. CEVA’s low leverage and diverse product mix contrast with persistent profitability challenges, highlighting operational risks. Both must balance their strengths against vulnerabilities to sustain growth.
The Moat Duel: Analyzing Competitive Defensibility
A structural moat is the only true shield protecting long-term profits from relentless competition erosion. Let’s examine each company’s competitive fortress:
KLA Corporation: Dominant Process Control Moat
KLA’s moat stems from high switching costs and critical process control technology. This drives a robust 33% net margin and 27.5% ROIC above WACC. Expanding semiconductor markets in Asia deepen this moat in 2026.
CEVA, Inc.: IP Licensing Vulnerability
CEVA relies on intangible assets and licensing, but its negative EBIT margin and declining ROIC reveal a fragile moat. Unlike KLA, CEVA’s value destruction casts doubt on its ability to fend off competition despite growth in AI processors.
Verdict: Precision Process Control vs. Fragile IP Licensing
KLA’s wide moat and growing ROIC outperform CEVA’s shrinking returns and value destruction. KLA is better positioned to defend market share and sustain profits long term.
Which stock offers better returns?
The past year shows KLA Corporation’s stock more than doubling, while CEVA, Inc. experienced a notable decline amid accelerating trends and shifting volume dynamics.
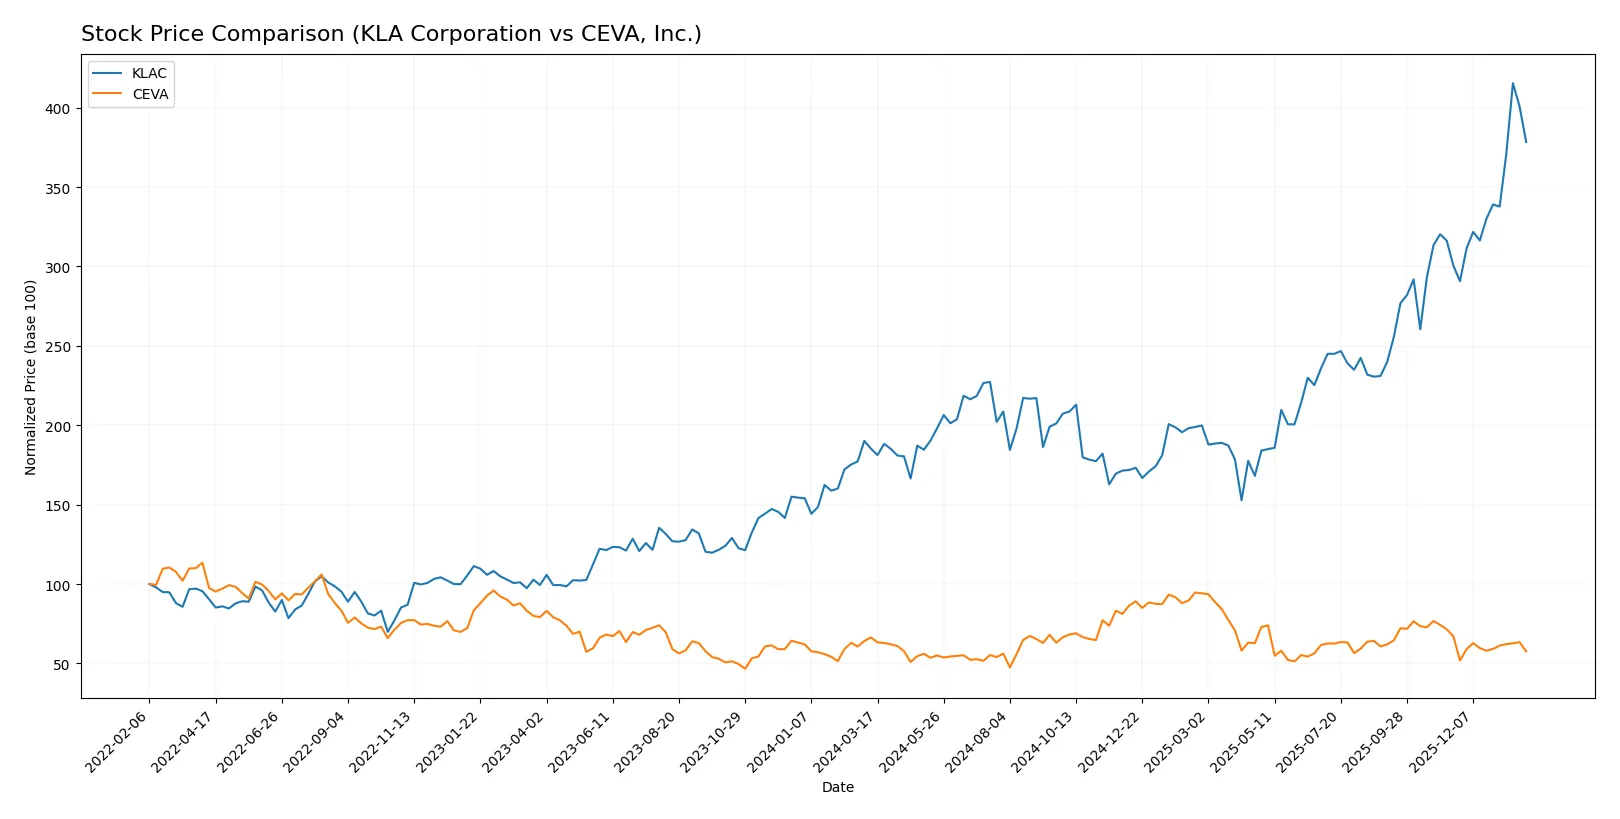
Trend Comparison
KLA Corporation’s stock rose 104.22% over 12 months, displaying a bullish trend with accelerating gains and a high volatility level (std dev 213.25). The price ranged from 577 to 1,568.
CEVA, Inc.’s stock fell 13.25% over the same period, marking a bearish trend with accelerating losses. It showed low volatility (std dev 4.4) and price fluctuated between 17.39 and 34.67.
KLA’s strong bullish momentum contrasts with CEVA’s bearish performance. KLA delivered the highest market performance over the past year based on available data.
Target Prices
Analysts present a positive consensus on KLA Corporation and CEVA, Inc., reflecting growth potential in the semiconductor sector.
| Company | Target Low | Target High | Consensus |
|---|---|---|---|
| KLA Corporation | 1,400 | 1,900 | 1,672 |
| CEVA, Inc. | 28 | 28 | 28 |
The consensus target for KLA exceeds its current price of 1,428, indicating upside potential. CEVA’s target sits well above its current 21, suggesting strong growth expectations.

Don’t Let Luck Decide Your Entry Point
Optimize your entry points with our advanced ProRealTime indicators. You’ll get efficient buy signals with precise price targets for maximum performance. Start outperforming now!
How do institutions grade them?
The following tables summarize recent institutional grades for KLA Corporation and CEVA, Inc.:
KLA Corporation Grades
This table lists the latest grades from reputable financial institutions for KLA Corporation.
| Grading Company | Action | New Grade | Date |
|---|---|---|---|
| Oppenheimer | Maintain | Outperform | 2026-01-30 |
| Jefferies | Maintain | Buy | 2026-01-30 |
| Cantor Fitzgerald | Maintain | Overweight | 2026-01-30 |
| Wells Fargo | Maintain | Overweight | 2026-01-30 |
| Stifel | Maintain | Buy | 2026-01-30 |
| Needham | Maintain | Buy | 2026-01-30 |
| RBC Capital | Maintain | Sector Perform | 2026-01-30 |
| Barclays | Maintain | Overweight | 2026-01-30 |
| Deutsche Bank | Maintain | Hold | 2026-01-21 |
| Needham | Maintain | Buy | 2026-01-20 |
CEVA, Inc. Grades
This table presents recent institutional grades for CEVA, Inc. from recognized analysts.
| Grading Company | Action | New Grade | Date |
|---|---|---|---|
| Barclays | Maintain | Overweight | 2025-11-12 |
| Rosenblatt | Maintain | Buy | 2025-11-11 |
| Rosenblatt | Maintain | Buy | 2025-08-14 |
| Oppenheimer | Maintain | Outperform | 2025-05-09 |
| Rosenblatt | Maintain | Buy | 2025-05-08 |
| Barclays | Maintain | Overweight | 2025-05-08 |
| Rosenblatt | Maintain | Buy | 2025-04-23 |
| Barclays | Maintain | Overweight | 2025-02-14 |
| Rosenblatt | Maintain | Buy | 2025-02-14 |
| Rosenblatt | Maintain | Buy | 2025-02-11 |
Which company has the best grades?
KLA Corporation received a broader range of grades, mainly “Buy” and “Outperform,” with some “Hold” and “Sector Perform.” CEVA, Inc.’s grades cluster around “Buy,” “Overweight,” and “Outperform.” KLA’s more recent and diversified analyst coverage suggests stronger institutional confidence, potentially offering investors a more robust consensus signal.
Risks specific to each company
The following categories identify the critical pressure points and systemic threats facing both firms in the 2026 market environment:
1. Market & Competition
KLA Corporation
- Dominates semiconductor process control with strong market cap and broad product portfolio.
CEVA, Inc.
- Faces intense competition in IP licensing with smaller scale and niche focus.
2. Capital Structure & Debt
KLA Corporation
- High debt-to-equity ratio (1.3) signals leverage risk despite strong interest coverage.
CEVA, Inc.
- Minimal debt load (0.02 D/E) reduces financial risk but weak profitability raises concerns.
3. Stock Volatility
KLA Corporation
- Beta at 1.44 indicates above-market volatility consistent with tech sector cycles.
CEVA, Inc.
- Similar beta (1.44) but lower market cap may lead to higher relative price swings.
4. Regulatory & Legal
KLA Corporation
- Subject to global semiconductor export controls and IP regulations.
CEVA, Inc.
- Faces licensing compliance risks, especially in wireless and AI tech sectors.
5. Supply Chain & Operations
KLA Corporation
- Scale and integration reduce supply chain disruptions but global chip cycles remain a threat.
CEVA, Inc.
- Smaller scale exposes CEVA to supplier risks and potential delivery delays.
6. ESG & Climate Transition
KLA Corporation
- Large footprint demands aggressive ESG compliance; potential cost pressures.
CEVA, Inc.
- Less operational footprint but must align IP products with sustainable tech trends.
7. Geopolitical Exposure
KLA Corporation
- High exposure to US-China tech tensions affects supply and demand.
CEVA, Inc.
- Moderate geopolitical risk due to licensing model but still reliant on global markets.
Which company shows a better risk-adjusted profile?
KLA Corporation faces significant leverage risk but benefits from market dominance and strong financial health scores. CEVA shows lower debt but struggles with negative profitability and weaker operational metrics. KLA’s Altman Z-Score (12.6) and Piotroski score (8) place it in a safe zone with strong fundamentals. CEVA, despite low debt, has negative margins and weaker scores, signaling higher risk. The critical risk for KLA is its elevated debt load amid cyclical tech volatility. For CEVA, poor profitability and operational efficiency pose the greatest threat. Overall, KLA offers a better risk-adjusted profile due to superior profitability and financial resilience despite leverage concerns. Recent market cap and ratio trends confirm KLA’s stronger position to weather macro uncertainties.
Final Verdict: Which stock to choose?
KLA Corporation’s superpower lies in its exceptional capital efficiency and sustained value creation. Its robust ROIC far exceeds its WACC, signaling a durable competitive advantage. A point of vigilance is its high price multiples, which could challenge valuation in a market downturn. It suits portfolios targeting aggressive growth with a tolerance for premium pricing.
CEVA, Inc. offers a strategic moat centered on low leverage and strong liquidity, providing a cushion against financial distress. However, it currently struggles with profitability and shrinking returns on invested capital, reflecting operational challenges. This stock fits more conservative growth-at-a-reasonable-price (GARP) investors willing to accept execution risks for potential turnaround gains.
If you prioritize capital efficiency and proven profitability, KLA outshines with its durable moat and accelerating revenue growth. However, if you seek financial safety with a focus on liquidity over earnings, CEVA offers better stability despite its troubled earnings. Both represent distinct analytical scenarios suited to different investor risk profiles.
Disclaimer: Investment carries a risk of loss of initial capital. The past performance is not a reliable indicator of future results. Be sure to understand risks before making an investment decision.
Go Further
I encourage you to read the complete analyses of KLA Corporation and CEVA, Inc. to enhance your investment decisions: