In the dynamic world of semiconductors, indie Semiconductor, Inc. (INDI) and CEVA, Inc. (CEVA) stand out as innovators shaping the future of technology. Both companies operate within the semiconductor industry but focus on distinct yet overlapping markets—automotive solutions for INDI and wireless connectivity and smart sensing for CEVA. This comparison will help investors identify which company presents the most compelling opportunity in this fast-evolving sector.
Table of contents
Companies Overview
I will begin the comparison between indie Semiconductor, Inc. and CEVA, Inc. by providing an overview of these two companies and their main differences.
indie Semiconductor, Inc. Overview
indie Semiconductor, Inc. focuses on automotive semiconductors and software solutions that enhance advanced driver assistance systems, connected cars, user experience, and electrification. The company offers a broad range of devices for automotive applications including parking assistance, wireless charging, infotainment, telematics, and photonic components. Headquartered in Aliso Viejo, California, indie operates within the semiconductor industry with a market cap of approximately 882M USD.
CEVA, Inc. Overview
CEVA, Inc. specializes in licensing wireless connectivity and smart sensing technologies to semiconductor and OEM companies globally. Its portfolio includes digital signal processors, AI processors, and platforms for 5G, imaging, audio, and IoT applications. CEVA’s technology supports diverse markets such as mobile, automotive, robotics, and industrial sectors. Based in Rockville, Maryland, CEVA operates within the semiconductor sector with a market cap near 547M USD.
Key similarities and differences
Both indie Semiconductor and CEVA operate in the semiconductor industry and focus on advanced technology solutions. indie concentrates on hardware and software for automotive applications, while CEVA primarily licenses digital signal processing and AI technologies to other companies. indie has a larger workforce and market cap, whereas CEVA emphasizes a licensing business model with a narrower employee base. Both companies support emerging technologies but target different segments within the semiconductor ecosystem.
Income Statement Comparison
The table below presents a side-by-side comparison of key income statement metrics for indie Semiconductor, Inc. and CEVA, Inc. for the fiscal year 2024, illustrating their recent financial performance.

| Metric | indie Semiconductor, Inc. | CEVA, Inc. |
|---|---|---|
| Market Cap | 882M | 547M |
| Revenue | 217M | 107M |
| EBITDA | -94M | -3.4M |
| EBIT | -137M | -7.5M |
| Net Income | -133M | -8.8M |
| EPS | -0.76 | -0.37 |
| Fiscal Year | 2024 | 2024 |
Income Statement Interpretations
indie Semiconductor, Inc.
indie Semiconductor’s revenue showed strong overall growth of 858.35% from 2020 to 2024, but declined by 2.91% in the most recent year. Gross margin improved significantly to 41.68%, while net margin remained negative at -61.2%. The latest fiscal year saw a 263.85% gross profit increase, yet operating income and net income continued to decline, reflecting ongoing profitability challenges.
CEVA, Inc.
CEVA’s revenue grew modestly by 6.59% over the five-year period, with a favorable 9.77% increase in 2024. Gross margin is notably high at 88.06%, but EBIT margin remains negative at -7.06%. The company experienced improvements in net margin and EPS growth in the latest year, signaling operational progress despite sustained net losses and negative overall margin trends.
Which one has the stronger fundamentals?
CEVA exhibits stronger fundamentals with a high gross margin and favorable year-over-year growth in revenue, EBIT, and net margin. indie Semiconductor shows robust revenue growth overall but struggles with persistent losses and declining profitability metrics. Both companies face net income challenges, yet CEVA’s improving margins and growth rates suggest relatively better income statement health.
Financial Ratios Comparison
The table below compares key financial ratios for indie Semiconductor, Inc. (INDI) and CEVA, Inc. (CEVA) based on their most recent fiscal year data for 2024.
| Ratios | indie Semiconductor, Inc. (INDI) | CEVA, Inc. (CEVA) |
|---|---|---|
| ROE | -31.7% | -3.3% |
| ROIC | -19.3% | -2.7% |
| P/E | -5.35 | -84.79 |
| P/B | 1.70 | 2.79 |
| Current Ratio | 4.82 | 7.09 |
| Quick Ratio | 4.23 | 7.09 |
| D/E (Debt-to-Equity) | 0.95 | 0.02 |
| Debt-to-Assets | 42.3% | 1.8% |
| Interest Coverage | -18.4 | 0 |
| Asset Turnover | 0.23 | 0.35 |
| Fixed Asset Turnover | 4.30 | 8.43 |
| Payout ratio | 0 | 0 |
| Dividend yield | 0 | 0 |
Interpretation of the Ratios
indie Semiconductor, Inc.
indie Semiconductor shows mostly unfavorable ratios in 2024, including a negative net margin of -61.2% and return on equity at -31.73%, signaling profitability and efficiency challenges. The current ratio at 4.82 is considered unfavorable despite a favorable quick ratio of 4.23. The company does not pay dividends, likely due to ongoing losses and a focus on reinvestment in R&D, indicated by a high R&D-to-revenue ratio.
CEVA, Inc.
CEVA’s 2024 ratios show mixed results with an unfavorable net margin of -8.22% and return on equity at -3.3%, though less severe than indie Semiconductor. The quick ratio and debt-to-equity ratio are favorable, reflecting liquidity and low leverage. CEVA also pays no dividends, which aligns with its reinvestment strategy and potential prioritization of growth and technology development over shareholder payouts.
Which one has the best ratios?
Both companies exhibit unfavorable global ratio opinions due to negative profitability and return measures. CEVA has a higher proportion of favorable ratios (35.71%) compared to indie Semiconductor’s 21.43%, particularly in liquidity and leverage metrics. However, both face challenges in profitability and interest coverage, making neither distinctly superior in overall financial health based solely on 2024 ratios.
Strategic Positioning
This section compares the strategic positioning of indie Semiconductor and CEVA, including Market position, Key segments, and exposure to disruption:
indie Semiconductor, Inc.
- Positioned as an automotive semiconductor provider facing high competitive pressure in the semiconductor industry.
- Focuses on automotive semiconductors and software solutions for ADAS, connected cars, and electrification.
- Exposure to technological disruption through advanced automotive applications and photonic components.
CEVA, Inc.
- Licensor of wireless connectivity and smart sensing IP, competing in a niche segment with moderate pressure.
- Concentrates on licensing DSPs, AI processors, and wireless platforms for mobile, IoT, and consumer markets.
- Faces disruption risks in evolving wireless and AI technologies, affecting licensing of connectivity IP.
indie Semiconductor vs CEVA Positioning
Indie Semiconductor pursues a concentrated approach in automotive semiconductors with product and service sales, while CEVA adopts a diversified licensing model across multiple wireless and sensing technologies. Indie’s focus may limit diversification but targets specific automotive needs, whereas CEVA’s licensing spans broader markets but depends on IP adoption.
Which has the best competitive advantage?
Both companies show very unfavorable MOAT evaluations with declining ROIC and value destruction over 2020-2024, indicating weak competitive advantages and challenges sustaining profitability. Neither currently demonstrates a strong economic moat based on provided data.
Stock Comparison
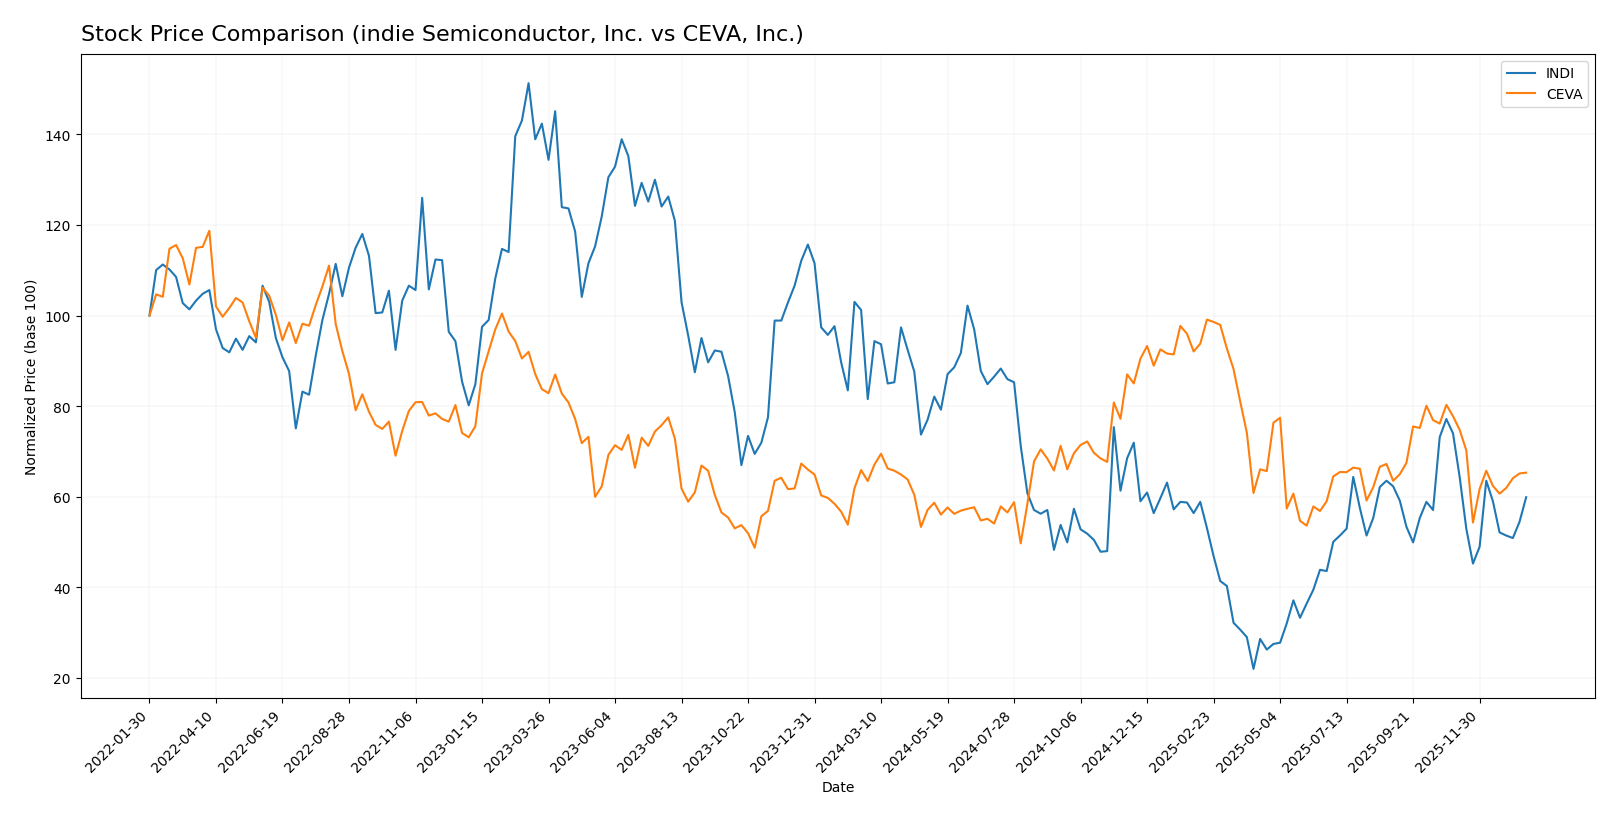
The stock price dynamics of indie Semiconductor, Inc. and CEVA, Inc. over the past 12 months reveal contrasting trends, with indie Semiconductor showing a significant decline and CEVA experiencing moderate gains despite recent downward pressure.
Trend Analysis
Indie Semiconductor, Inc. (INDI) exhibits a bearish trend over the past year with a price decrease of -26.56%, accompanied by deceleration and moderate volatility (std deviation 1.35). The stock peaked at 7.43 and bottomed at 1.6.
CEVA, Inc. (CEVA) shows a bullish trend overall with a +2.93% price change, though recent months reveal a decline of -16.02% and deceleration, with higher volatility (std deviation 4.39) and prices ranging between 17.39 and 34.67.
Comparing both, CEVA has delivered the highest market performance over the last 12 months, maintaining a slight overall gain while indie Semiconductor experienced a substantial loss.
Target Prices
The consensus target prices for indie Semiconductor, Inc. and CEVA, Inc. indicate optimistic analyst expectations.
| Company | Target High | Target Low | Consensus |
|---|---|---|---|
| indie Semiconductor, Inc. | 8 | 8 | 8 |
| CEVA, Inc. | 28 | 28 | 28 |
Analysts expect indie Semiconductor’s price to nearly double from its current 4.36 USD, while CEVA’s consensus target of 28 USD suggests a significant upside from 22.78 USD.
Analyst Opinions Comparison
This section compares analysts’ ratings and grades for indie Semiconductor, Inc. (INDI) and CEVA, Inc. (CEVA):
Rating Comparison
INDI Rating
- Rating: C-, considered very favorable overall.
- Discounted Cash Flow Score: 1, indicating a very unfavorable valuation based on future cash flows.
- ROE Score: 1, very unfavorable efficiency in generating profit from equity.
- ROA Score: 1, very unfavorable asset utilization to generate earnings.
- Debt To Equity Score: 1, very unfavorable financial risk with high reliance on debt.
- Overall Score: 1, very unfavorable financial standing.
CEVA Rating
- Rating: C+, also considered very favorable overall.
- Discounted Cash Flow Score: 3, indicating a moderate valuation from discounted cash flows.
- ROE Score: 1, very unfavorable efficiency in generating profit from equity.
- ROA Score: 1, very unfavorable asset utilization to generate earnings.
- Debt To Equity Score: 4, favorable financial risk profile with low reliance on debt.
- Overall Score: 2, moderate financial standing.
Which one is the best rated?
Based strictly on the provided data, CEVA holds a higher overall score (2 vs. 1) and a better discounted cash flow and debt-to-equity score than INDI. INDI scores uniformly lower, indicating a less favorable rating profile.
Scores Comparison
The scores comparison between indie Semiconductor and CEVA provides insight into their financial health and bankruptcy risk:
indie Semiconductor Scores
- Altman Z-Score indicates distress zone risk, very low bankruptcy safety score (0.12).
- Piotroski Score is very weak at 2, suggesting poor financial strength.
CEVA Scores
- Altman Z-Score shows safe zone status, very low bankruptcy risk (9.99).
- Piotroski Score is average at 4, indicating moderate financial health.
Which company has the best scores?
Based strictly on the provided data, CEVA has notably better scores than indie Semiconductor, with a safe zone Altman Z-Score and a higher Piotroski Score, indicating stronger financial stability and moderate strength.
Grades Comparison
Here is a comparison of the latest grades assigned to indie Semiconductor, Inc. and CEVA, Inc. by reputable grading companies:
indie Semiconductor, Inc. Grades
The following table lists recent grades from recognized financial firms for indie Semiconductor, Inc.:
| Grading Company | Action | New Grade | Date |
|---|---|---|---|
| UBS | Maintain | Neutral | 2025-11-10 |
| Benchmark | Maintain | Buy | 2025-06-25 |
| Benchmark | Maintain | Buy | 2025-06-11 |
| Benchmark | Maintain | Buy | 2025-05-21 |
| Benchmark | Maintain | Buy | 2025-05-13 |
| Craig-Hallum | Maintain | Buy | 2025-05-13 |
| Keybanc | Maintain | Overweight | 2025-05-13 |
| Benchmark | Maintain | Buy | 2025-04-09 |
| Benchmark | Maintain | Buy | 2025-02-21 |
| Keybanc | Maintain | Overweight | 2025-02-21 |
The grades for indie Semiconductor, Inc. predominantly indicate a stable buy consensus with some overweight ratings, showing consistent confidence from analysts.
CEVA, Inc. Grades
Below are recent grades from established financial institutions for CEVA, Inc.:
| Grading Company | Action | New Grade | Date |
|---|---|---|---|
| Barclays | Maintain | Overweight | 2025-11-12 |
| Rosenblatt | Maintain | Buy | 2025-11-11 |
| Rosenblatt | Maintain | Buy | 2025-08-14 |
| Oppenheimer | Maintain | Outperform | 2025-05-09 |
| Rosenblatt | Maintain | Buy | 2025-05-08 |
| Barclays | Maintain | Overweight | 2025-05-08 |
| Rosenblatt | Maintain | Buy | 2025-04-23 |
| Barclays | Maintain | Overweight | 2025-02-14 |
| Rosenblatt | Maintain | Buy | 2025-02-14 |
| Rosenblatt | Maintain | Buy | 2025-02-11 |
CEVA, Inc. receives a consistent stream of buy and overweight ratings, with Oppenheimer’s outperform grade underscoring positive analyst sentiment.
Which company has the best grades?
Both companies maintain a buy consensus, but CEVA, Inc. shows a stronger presence of overweight and outperform ratings across more grading firms, potentially signaling higher analyst conviction. This could influence investor sentiment towards CEVA, reflecting confidence in its growth prospects relative to indie Semiconductor, Inc.
Strengths and Weaknesses
Below is a comparative table highlighting the key strengths and weaknesses of indie Semiconductor, Inc. (INDI) and CEVA, Inc. (CEVA) based on the most recent financial and operational data available.
| Criterion | indie Semiconductor, Inc. (INDI) | CEVA, Inc. (CEVA) |
|---|---|---|
| Diversification | Moderate: Revenue split between Product (203M) and Service (14M) segments | Moderate: Revenue from License (60M) and Royalty (47M) streams |
| Profitability | Weak: Negative net margin (-61.2%), declining ROIC (-19.25%), value destroying | Weak: Negative net margin (-8.22%), declining ROIC (-2.68%), value destroying |
| Innovation | Moderate: Product-focused with growing product revenue, but declining profitability | Moderate: Focus on licensing and royalties with steady revenue growth; innovation in connectivity and sensing |
| Global presence | Moderate: Operations primarily product/service based, no clear global dominance | Moderate: Licensing model supports broad global reach but profitability issues persist |
| Market Share | Small: Challenged by financial losses and declining returns | Small: Licensing niche but limited profitability and growth concerns |
Key takeaways: Both companies face significant profitability challenges with very unfavorable economic moats due to declining ROIC and negative margins. CEVA shows slightly better capital efficiency and favorable leverage ratios, while indie Semiconductor has a stronger product revenue base but struggles with value creation. Investors should approach both with caution, emphasizing risk management.
Risk Analysis
Below is a comparison of the key risks facing indie Semiconductor, Inc. (INDI) and CEVA, Inc. (CEVA) as of 2024.
| Metric | indie Semiconductor, Inc. (INDI) | CEVA, Inc. (CEVA) |
|---|---|---|
| Market Risk | High beta (2.54) indicates high volatility and sensitivity to market swings. | Moderate beta (1.436), less volatile but still exposed to tech sector risks. |
| Debt Level | Moderate debt-to-assets at 42.34%, debt/equity ratio neutral (0.95). | Very low debt level, debt-to-assets 1.8%, debt/equity favorable (0.02). |
| Regulatory Risk | Industry subject to automotive and technology regulations; moderate risk. | Licensor in wireless tech, exposed to IP and export controls; moderate risk. |
| Operational Risk | Negative profitability and efficiency ratios highlight operational challenges. | Negative margins but better turnover ratios; moderate operational risk. |
| Environmental Risk | Potential exposure due to semiconductor manufacturing supply chain. | Lower direct manufacturing footprint reduces environmental risks. |
| Geopolitical Risk | US-based auto semiconductor supplier exposed to supply chain disruptions. | Global licensing exposes to geopolitical tensions affecting technology trade. |
The most significant risks are market volatility for indie Semiconductor due to its high beta, and operational challenges for both companies reflected in continued unprofitable margins. indie Semiconductor’s moderate leverage adds financial strain risk, while CEVA’s low debt limits financial risk. Geopolitical and regulatory pressures remain relevant for both given their technology focus and global exposure. Investors should weigh these risks carefully alongside growth prospects.
Which Stock to Choose?
Indie Semiconductor, Inc. (INDI) shows mixed financial signals with a declining revenue growth of -2.91% in 2024 but a strong gross profit growth of 263.85%. Its profitability remains weak, with a net margin of -61.2% and returns on equity and capital employed deeply negative. Debt levels are moderate, and its overall rating is very favorable despite unfavorable core financial ratios.
CEVA, Inc. (CEVA) experienced positive revenue growth of 9.77% in 2024 and maintains a high gross margin of 88.06%. Profitability is better than INDI but still negative, with a net margin of -8.22%. CEVA has notably low debt and a moderate overall rating, though its financial ratios are similarly unfavorable, reflecting challenges in profitability.
For investors prioritizing growth potential, INDI’s strong gross profit growth and favorable rating might appear attractive, while those focused on financial stability and lower leverage might lean toward CEVA given its moderate rating and very low debt. Both companies have unfavorable profitability and value destruction signals, implying caution for risk-averse profiles.
Disclaimer: Investment carries a risk of loss of initial capital. The past performance is not a reliable indicator of future results. Be sure to understand risks before making an investment decision.
Go Further
I encourage you to read the complete analyses of indie Semiconductor, Inc. and CEVA, Inc. to enhance your investment decisions: