Investors seeking exposure to the semiconductor industry often face the choice between manufacturing giants and specialized technology licensors. GLOBALFOUNDRIES Inc. (GFS) stands out as a major semiconductor foundry, producing integrated circuits for diverse electronic devices. In contrast, CEVA, Inc. (CEVA) focuses on licensing advanced wireless connectivity and AI processor technologies to chipmakers worldwide. This article will help you determine which company presents the most compelling investment opportunity in this dynamic sector.
Table of contents
Companies Overview
I will begin the comparison between GLOBALFOUNDRIES Inc. and CEVA, Inc. by providing an overview of these two companies and their main differences.
GLOBALFOUNDRIES Inc. Overview
GLOBALFOUNDRIES Inc. operates as a semiconductor foundry worldwide, manufacturing integrated circuits that enable various electronic devices. Its product range includes microprocessors, baseband processors, radio frequency modems, and power management units, among others. Founded in 2009 and based in Malta, NY, GLOBALFOUNDRIES is a key player in wafer fabrication services with a market capitalization of approximately 23B USD.
CEVA, Inc. Overview
CEVA, Inc. is a licensor of wireless connectivity and smart sensing technologies to semiconductor and OEM companies worldwide. It designs and licenses digital signal processors, AI processors, and wireless platforms for applications such as 5G, IoT, and computer vision. Founded in 1999 and headquartered in Rockville, MD, CEVA has a market cap of about 536M USD and focuses on IP licensing rather than manufacturing.
Key similarities and differences
Both GLOBALFOUNDRIES and CEVA operate in the semiconductor industry and are listed on NASDAQ, but their business models differ significantly. GLOBALFOUNDRIES manufactures semiconductor devices and offers wafer fabrication, while CEVA licenses intellectual property and software for wireless and sensing technologies. The former is capital-intensive with 13K employees, whereas CEVA operates a leaner licensing model with just over 400 employees.
Income Statement Comparison
This table presents a factual comparison of the most recent fiscal year income statement metrics for GLOBALFOUNDRIES Inc. and CEVA, Inc., highlighting key financial performance indicators.

| Metric | GLOBALFOUNDRIES Inc. (GFS) | CEVA, Inc. (CEVA) |
|---|---|---|
| Market Cap | 23B | 536M |
| Revenue | 6.75B | 107M |
| EBITDA | 1.50B | -3.41M |
| EBIT | -64M | -7.55M |
| Net Income | -265M | -8.79M |
| EPS | -0.48 | -0.37 |
| Fiscal Year | 2024 | 2024 |
Income Statement Interpretations
GLOBALFOUNDRIES Inc.
GLOBALFOUNDRIES saw revenue grow 39.15% from 2020 to 2024 but suffered an 8.69% decline in the latest year. Net income increased overall by 80.37%, yet turned negative in 2024 with a -3.93% net margin. Gross margin remained favorable at 24.46%, but EBIT margin dropped to -0.95%. The recent year showed a sharp decline in profitability and margins.
CEVA, Inc.
CEVA’s revenue increased modestly by 6.59% over five years, with a 9.77% growth in 2024. Net income, however, declined steeply by 269.31% overall, and the net margin stayed negative at -8.22%. Gross margin is strong at 88.06%, but EBIT margin is unfavorable at -7.06%. The latest year showed improved revenue and margin growth, reflecting some operational gains despite ongoing net losses.
Which one has the stronger fundamentals?
GLOBALFOUNDRIES exhibits stronger long-term revenue and net income growth but recent earnings deterioration and negative margins raise concerns. CEVA benefits from a higher gross margin and recent positive trends in revenue and EBIT growth, yet its long-term net income decline and negative margins remain problematic. Both face profitability challenges, with differing strengths and weaknesses in fundamentals.
Financial Ratios Comparison
The table below presents a side-by-side comparison of key financial ratios for GLOBALFOUNDRIES Inc. (GFS) and CEVA, Inc. (CEVA) based on their latest available fiscal year data for 2024.
| Ratios | GLOBALFOUNDRIES Inc. (GFS) | CEVA, Inc. (CEVA) |
|---|---|---|
| ROE | -2.46% | -3.30% |
| ROIC | -1.47% | -2.68% |
| P/E | -89.5 | -84.8 |
| P/B | 2.20 | 2.79 |
| Current Ratio | 2.11 | 7.09 |
| Quick Ratio | 1.57 | 7.09 |
| D/E | 0.22 | 0.02 |
| Debt-to-Assets | 13.8% | 1.8% |
| Interest Coverage | -1.48 | 0 |
| Asset Turnover | 0.40 | 0.35 |
| Fixed Asset Turnover | 0.82 | 8.43 |
| Payout ratio | 0 | 0 |
| Dividend yield | 0 | 0 |
Interpretation of the Ratios
GLOBALFOUNDRIES Inc.
GLOBALFOUNDRIES shows a mixed ratio profile with unfavorable net margin (-3.93%), ROE (-2.46%), and ROIC (-1.47%), indicating profitability challenges. However, liquidity ratios are favorable, with a current ratio of 2.11 and debt metrics showing low leverage. The company does not pay dividends, reflecting a possible reinvestment strategy or growth focus.
CEVA, Inc.
CEVA also presents unfavorable profitability ratios, including a net margin of -8.22% and negative ROE and ROIC values. Its liquidity is mixed, with a very high current ratio of 7.09 but a neutral stance on some metrics. CEVA does not distribute dividends, likely prioritizing R&D and acquisitions given its high research expenditure and zero dividend yield.
Which one has the best ratios?
Both GLOBALFOUNDRIES and CEVA face similar profitability issues and maintain unfavorable overall ratio evaluations at 57.14%. GLOBALFOUNDRIES benefits from stronger liquidity and leverage ratios, while CEVA shows higher asset efficiency in fixed asset turnover. Neither company pays dividends, signaling reinvestment or growth priorities.
Strategic Positioning
This section compares the strategic positioning of GLOBALFOUNDRIES Inc. and CEVA, Inc., including Market position, Key segments, and Exposure to technological disruption:
GLOBALFOUNDRIES Inc.
- Operates as a global semiconductor foundry with broad competitive pressure in fabrication services.
- Main revenue from wafer fabrication (~6B USD) and engineering services (~650M USD) in semiconductors.
- Exposure to technological disruption in semiconductor fabrication and integrated circuits manufacturing.
CEVA, Inc.
- Licenses DSP and AI processors with competitive pressure in IP licensing and wireless technologies.
- Revenue driven by licensing and royalties from wireless connectivity and smart sensing technologies.
- Faces disruption risks in AI, wireless connectivity, and evolving sensor fusion technologies licensing.
GLOBALFOUNDRIES Inc. vs CEVA, Inc. Positioning
GLOBALFOUNDRIES has a diversified business model focused on semiconductor manufacturing and services, benefiting from scale. CEVA concentrates on IP licensing for DSP and AI, relying on innovation in wireless and sensing technologies. Each faces distinct strategic industry challenges.
Which has the best competitive advantage?
Based on MOAT evaluation, GLOBALFOUNDRIES shows slightly unfavorable positioning with growing profitability, while CEVA faces very unfavorable conditions with declining profitability, indicating a weaker competitive advantage for CEVA.
Stock Comparison
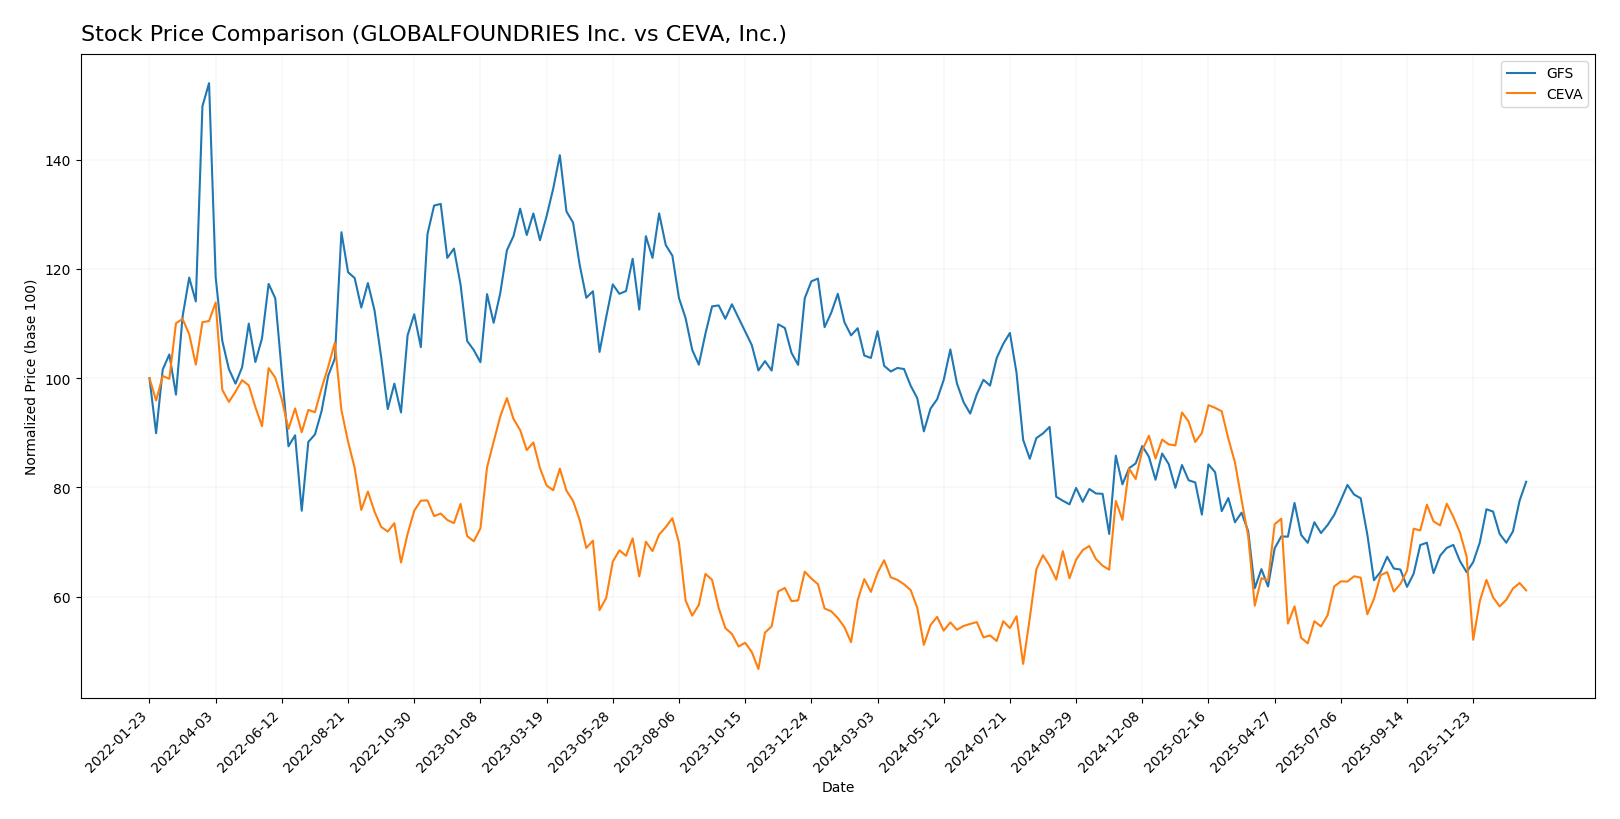
The stock prices of GLOBALFOUNDRIES Inc. (GFS) and CEVA, Inc. (CEVA) have shown contrasting dynamics over the past year, with GFS experiencing a significant decline followed by recent recovery, while CEVA displayed near stability overall but faced recent downturns.
Trend Analysis
GLOBALFOUNDRIES Inc. exhibited a bearish trend over the past 12 months with a price decline of -21.86%, marked by accelerating downward momentum and a high volatility level of 6.45%. The stock hit a low of 31.54 and a high of 55.66.
CEVA, Inc. showed a neutral trend over the same period with a marginal price increase of 0.45% and decelerating momentum, combined with moderate volatility of 4.4%. The recent period saw a bearish shift of -18.04%, indicating short-term weakness.
Comparing the two, CEVA’s stock delivered the highest market performance over the past year, maintaining near price stability, whereas GLOBALFOUNDRIES faced a pronounced decline despite recent positive momentum.
Target Prices
There is a clear consensus on target prices for both GLOBALFOUNDRIES Inc. and CEVA, Inc. from verified analysts.
| Company | Target High | Target Low | Consensus |
|---|---|---|---|
| GLOBALFOUNDRIES Inc. | 40 | 37 | 38.5 |
| CEVA, Inc. | 28 | 28 | 28 |
Analysts expect GLOBALFOUNDRIES to trade slightly below its current price of 41.53 USD, suggesting moderate downside risk. CEVA’s target consensus of 28 USD is notably above its current 22.3 USD, indicating potential upside.
Analyst Opinions Comparison
This section compares analysts’ ratings and grades for GLOBALFOUNDRIES Inc. and CEVA, Inc.:
Rating Comparison
GLOBALFOUNDRIES Inc. Rating
- Rating: C+, considered very favorable by analysts.
- Discounted Cash Flow Score: Moderate at 3, showing balanced valuation.
- ROE Score: Very unfavorable at 1, indicating weak profit generation efficiency.
- ROA Score: Very unfavorable at 1, reflecting poor asset utilization.
- Debt To Equity Score: Moderate at 3, showing moderate financial risk.
- Overall Score: Moderate at 2, summarizing average financial standing.
CEVA, Inc. Rating
- Rating: C+, also considered very favorable by analysts.
- Discounted Cash Flow Score: Moderate at 3, reflecting similar valuation balance.
- ROE Score: Very unfavorable at 1, indicating weak profit generation efficiency.
- ROA Score: Very unfavorable at 1, reflecting poor asset utilization.
- Debt To Equity Score: Favorable at 4, suggesting stronger balance sheet management.
- Overall Score: Moderate at 2, summarizing average financial standing.
Which one is the best rated?
Both GLOBALFOUNDRIES and CEVA share identical ratings of C+ and moderate overall scores of 2. CEVA has a slightly better debt-to-equity score (4 vs. 3), indicating a stronger balance sheet, but other metrics are equal.
Scores Comparison
Here is a comparison of the financial scores for GLOBALFOUNDRIES Inc. and CEVA, Inc.:
GLOBALFOUNDRIES Inc. Scores
- Altman Z-Score: 2.61, in the grey zone indicating moderate bankruptcy risk.
- Piotroski Score: 6, classified as average financial strength.
CEVA, Inc. Scores
- Altman Z-Score: 9.99, in the safe zone indicating very low bankruptcy risk.
- Piotroski Score: 4, also classified as average financial strength.
Which company has the best scores?
Based strictly on the provided data, CEVA shows a significantly higher Altman Z-Score indicating stronger financial stability. Both companies have average Piotroski Scores, but GLOBALFOUNDRIES has a slightly higher score in this metric.
Grades Comparison
The following presents a detailed comparison of the latest available grades from reputable grading companies for GLOBALFOUNDRIES Inc. and CEVA, Inc.:
GLOBALFOUNDRIES Inc. Grades
This table summarizes recent grades assigned to GLOBALFOUNDRIES Inc. by recognized financial institutions.
| Grading Company | Action | New Grade | Date |
|---|---|---|---|
| Wedbush | Downgrade | Neutral | 2025-12-31 |
| B of A Securities | Maintain | Underperform | 2025-12-04 |
| Evercore ISI Group | Maintain | Outperform | 2025-11-13 |
| JP Morgan | Maintain | Neutral | 2025-11-13 |
| Citigroup | Maintain | Neutral | 2025-11-13 |
| Wedbush | Maintain | Outperform | 2025-11-13 |
| B of A Securities | Downgrade | Underperform | 2025-10-13 |
| Deutsche Bank | Maintain | Buy | 2025-08-06 |
| Morgan Stanley | Maintain | Equal Weight | 2025-08-06 |
| Wedbush | Maintain | Outperform | 2025-08-06 |
The overall trend for GLOBALFOUNDRIES shows mixed ratings with recent downgrades to Neutral and Underperform, balanced by earlier Outperform and Buy grades.
CEVA, Inc. Grades
Presented here are the recent grades from established grading firms for CEVA, Inc.
| Grading Company | Action | New Grade | Date |
|---|---|---|---|
| Barclays | Maintain | Overweight | 2025-11-12 |
| Rosenblatt | Maintain | Buy | 2025-11-11 |
| Rosenblatt | Maintain | Buy | 2025-08-14 |
| Oppenheimer | Maintain | Outperform | 2025-05-09 |
| Rosenblatt | Maintain | Buy | 2025-05-08 |
| Barclays | Maintain | Overweight | 2025-05-08 |
| Rosenblatt | Maintain | Buy | 2025-04-23 |
| Barclays | Maintain | Overweight | 2025-02-14 |
| Rosenblatt | Maintain | Buy | 2025-02-14 |
| Rosenblatt | Maintain | Buy | 2025-02-11 |
CEVA, Inc. maintains consistently positive grades, predominantly Buy and Overweight, with no downgrades reported.
Which company has the best grades?
CEVA, Inc. has received stronger and more consistent Buy/Overweight ratings compared to GLOBALFOUNDRIES, which shows mixed grades including Neutral and Underperform. This could reflect greater confidence from analysts in CEVA’s prospects, potentially influencing investor sentiment.
Strengths and Weaknesses
Below is a comparison of key strengths and weaknesses for GLOBALFOUNDRIES Inc. (GFS) and CEVA, Inc. (CEVA) based on recent financial and operational data.
| Criterion | GLOBALFOUNDRIES Inc. (GFS) | CEVA, Inc. (CEVA) |
|---|---|---|
| Diversification | Moderate: Focuses on Water Fabrication (6.1B USD) and Engineering Services (652M USD) | Narrow: Primarily Licensing (60M USD) and Royalty (47M USD) revenue streams |
| Profitability | Unfavorable: Negative net margin (-3.93%) and ROIC (-1.47%), but improving ROIC trend | Unfavorable: Negative net margin (-8.22%) and ROIC (-2.68%), with declining profitability |
| Innovation | Moderate: Increasing ROIC suggests operational improvements | Low: Declining ROIC indicates challenges in maintaining competitive edge |
| Global presence | Strong: Large scale manufacturing with global customer base | Limited: Focused on licensing and royalties, less capital-intensive |
| Market Share | Significant in semiconductor fabrication services | Niche player in connectivity and sensing IP licensing |
Key takeaway: GLOBALFOUNDRIES shows improving profitability despite current value destruction, supported by a broad product base and global footprint. CEVA struggles with declining profitability and a narrower business model, increasing investment risk. Caution and close monitoring are advised for both.
Risk Analysis
The table below summarizes key risks for GLOBALFOUNDRIES Inc. (GFS) and CEVA, Inc. (CEVA) based on their 2024 financial and operational profiles.
| Metric | GLOBALFOUNDRIES Inc. (GFS) | CEVA, Inc. (CEVA) |
|---|---|---|
| Market Risk | High beta (1.485) indicates elevated volatility. | High beta (1.436) shows similar volatility risk. |
| Debt level | Moderate debt-to-equity (0.22), manageable leverage. | Very low debt-to-equity (0.02), strong balance sheet. |
| Regulatory Risk | Semiconductor industry faces evolving export controls and trade regulations. | Exposure to licensing agreements and IP regulations. |
| Operational Risk | Large-scale manufacturing complexity, asset turnover low (0.4). | Smaller scale, but dependency on licensing revenue streams. |
| Environmental Risk | Manufacturing processes involve resource-intensive operations. | Less resource-intensive but sensitive to tech lifecycle changes. |
| Geopolitical Risk | US-based but global supply chains subject to geopolitical tensions. | US-based, with global clients possibly affected by trade disputes. |
The most impactful and likely risks center on market volatility and operational challenges for GFS due to its manufacturing scale and moderate leverage. CEVA’s main risks stem from its reliance on licensing revenue and exposure to intellectual property regulations, despite a stronger balance sheet and safer financial position. Both companies must navigate semiconductor industry regulatory changes and geopolitical tensions carefully.
Which Stock to Choose?
GLOBALFOUNDRIES Inc. (GFS) shows a mixed financial picture with declining recent revenue and profitability but positive overall growth since 2020. Its financial ratios are mostly unfavorable, yet it maintains low debt and a strong current ratio. The company is shedding value but showing improving profitability, with a moderate rating of C+.
CEVA, Inc. (CEVA) demonstrates favorable recent income growth and gross margin, though overall profitability remains negative with a very unfavorable moat status due to declining ROIC. Its financial ratios mirror GFS with many unfavorable metrics, but it has very low debt and a solid Altman Z-score, also rated C+.
For investors focused on growth potential, CEVA’s recent income improvements and safer financial distress score might appear attractive, while those prioritizing improving profitability and moderate stability could view GFS’s upward ROIC trend and stronger liquidity as more aligned with their profile. Both stocks exhibit financial challenges and should be considered carefully within a risk-managed strategy.
Disclaimer: Investment carries a risk of loss of initial capital. The past performance is not a reliable indicator of future results. Be sure to understand risks before making an investment decision.
Go Further
I encourage you to read the complete analyses of GLOBALFOUNDRIES Inc. and CEVA, Inc. to enhance your investment decisions: