Uranium Energy Corp. (UEC) and Centrus Energy Corp. (LEU) are two prominent players in the uranium industry, each contributing uniquely to the nuclear energy supply chain. UEC focuses on uranium exploration and mining across North America, while Centrus specializes in nuclear fuel supply and technical solutions globally. Their overlapping market presence and innovative strategies make this comparison essential. Let’s explore which company presents the best investment opportunity for your portfolio.

Table of contents
Companies Overview
I will begin the comparison between Uranium Energy Corp. and Centrus Energy Corp. by providing an overview of these two companies and their main differences.
Uranium Energy Corp. Overview
Uranium Energy Corp. focuses on exploration, pre-extraction, extraction, and processing of uranium and titanium concentrates across the United States, Canada, and Paraguay. The company holds interests in multiple mining projects in Texas, Arizona, Colorado, Wyoming, Canada, and Paraguay. Incorporated in 2003 and headquartered in Corpus Christi, Texas, UEC operates primarily within the uranium industry, with a market capitalization of approximately 7.1B USD.
Centrus Energy Corp. Overview
Centrus Energy Corp. supplies nuclear fuel and services to the nuclear power sector in the US, Japan, Belgium, and internationally. It operates through two main segments: Low-Enriched Uranium (LEU) sales and Technical Solutions, which include engineering and manufacturing services. Founded in 1998 and based in Bethesda, Maryland, Centrus has a market cap near 5.4B USD and employs over 300 people.
Key similarities and differences
Both companies operate in the uranium sector, serving the nuclear energy market, but their business models differ. UEC emphasizes resource exploration and mining operations, while Centrus focuses on nuclear fuel supply and technical services. UEC’s operations span multiple countries with several mining projects, whereas Centrus offers specialized engineering and supply chain solutions mostly for nuclear utilities. Their market caps and employee counts also reflect differing scales of operation.
Income Statement Comparison
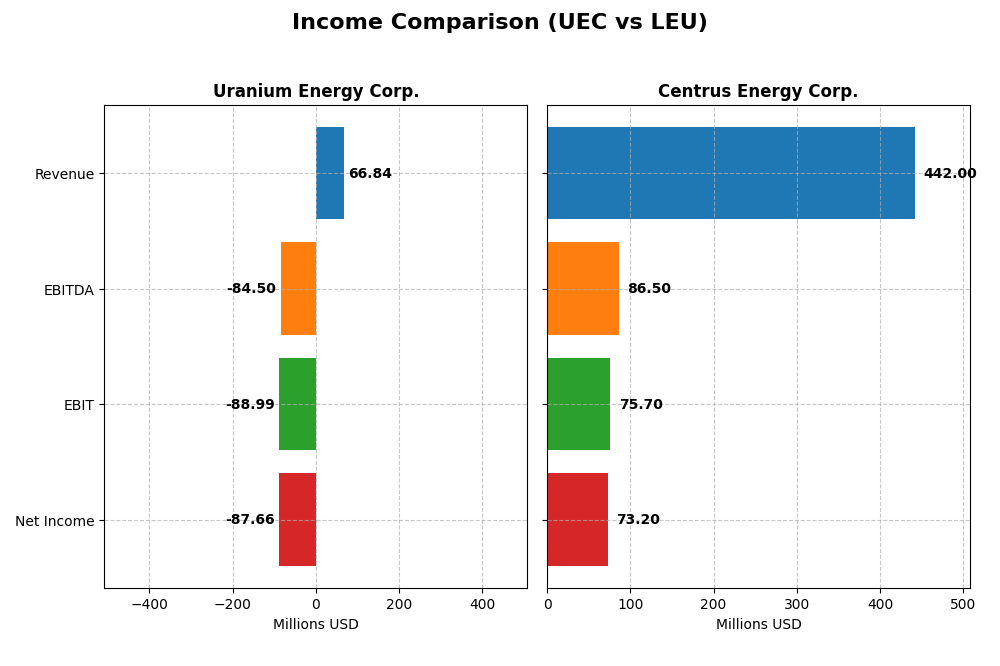
Below is a comparison of key income statement metrics for Uranium Energy Corp. and Centrus Energy Corp. for their most recent fiscal years.
| Metric | Uranium Energy Corp. (UEC) | Centrus Energy Corp. (LEU) |
|---|---|---|
| Market Cap | 7.13B | 5.36B |
| Revenue | 66.8M | 442M |
| EBITDA | -84.5M | 86.5M |
| EBIT | -88.9M | 75.7M |
| Net Income | -87.7M | 73.2M |
| EPS | -0.20 | 4.49 |
| Fiscal Year | 2025 | 2024 |
Income Statement Interpretations
Uranium Energy Corp.
Uranium Energy Corp. displayed stagnant revenue from 2021 to 2025, culminating in $67M for 2025, but net income deteriorated significantly to a loss of $87.7M. Gross margin remained favorable at 36.62%, yet EBIT and net margins were deeply negative, reflecting operational challenges. In 2025, despite revenue growth from prior year’s minimal levels, profitability worsened with a sharp increase in expenses.
Centrus Energy Corp.
Centrus Energy Corp. experienced steady revenue growth, reaching $442M in 2024, with net income of $73.2M. Gross margin at 25.23% and EBIT margin at 17.13% were favorable, but recent performance showed a slight decline in gross profit and net margin compared to 2023. The overall trend reflects solid profitability and positive growth over the 2020-2024 period, although some margin compression was noted in the latest year.
Which one has the stronger fundamentals?
Comparing fundamentals, Centrus Energy Corp. shows stronger overall income statement health with consistent revenue growth, positive EBIT and net margins, and a favorable global evaluation. Uranium Energy Corp. faces unfavorable net income trends and negative margins despite some revenue improvement. Therefore, Centrus maintains more robust earnings quality and operational profitability over the periods analyzed.
Financial Ratios Comparison
The table below presents a side-by-side comparison of key financial ratios for Uranium Energy Corp. (UEC) and Centrus Energy Corp. (LEU) based on their most recent fiscal year data.
| Ratios | Uranium Energy Corp. (UEC) 2025 | Centrus Energy Corp. (LEU) 2024 |
|---|---|---|
| ROE | -8.9% | 45.4% |
| ROIC | -6.6% | 4.0% |
| P/E | -42.3 | 14.8 |
| P/B | 3.77 | 6.73 |
| Current Ratio | 8.85 | 2.93 |
| Quick Ratio | 5.85 | 2.46 |
| D/E (Debt-to-Equity) | 0.0023 | 0.97 |
| Debt-to-Assets | 0.21% | 14.4% |
| Interest Coverage | -50.7 | 17.8 |
| Asset Turnover | 0.060 | 0.40 |
| Fixed Asset Turnover | 0.086 | 47.0 |
| Payout ratio | 0 | 0 |
| Dividend yield | 0 | 0 |
Interpretation of the Ratios
Uranium Energy Corp.
Uranium Energy Corp.’s financial ratios reveal several weaknesses, including negative net margin (-131.15%) and return on equity (-8.91%), signaling profitability challenges. Its high current ratio (8.85) may indicate inefficient asset use, while a favorable quick ratio (5.85) reflects short-term liquidity strength. The company does not pay dividends, likely due to ongoing losses and reinvestment priorities.
Centrus Energy Corp.
Centrus Energy Corp. displays mostly favorable financial ratios, with a positive net margin of 16.56% and a strong return on equity of 45.35%, indicating solid profitability. Its current ratio (2.93) and quick ratio (2.46) suggest good liquidity. The absence of dividends reflects possible reinvestment or growth strategies despite strong earnings and cash flow metrics.
Which one has the best ratios?
Centrus Energy Corp. holds the advantage with a predominantly favorable ratio profile, including profitability and liquidity metrics. In contrast, Uranium Energy Corp. faces significant profitability and efficiency issues, resulting in a largely unfavorable assessment. Thus, Centrus Energy’s ratios present a comparatively stronger financial position.
Strategic Positioning
This section compares the strategic positioning of Uranium Energy Corp. and Centrus Energy Corp. based on Market position, Key segments, and Exposure to technological disruption:
Uranium Energy Corp.
- Larger market cap of 7.13B, faces competitive pressure in uranium mining.
- Focuses on uranium and titanium exploration, extraction, and processing in North and South America.
- Limited direct exposure to technological disruption identified in uranium mining.
Centrus Energy Corp.
- Smaller market cap of 5.36B, competitive pressure in nuclear fuel supply.
- Operates two segments: Low-Enriched Uranium and Technical Solutions globally.
- Exposure through advanced nuclear fuel services and American Centrifuge engineering.
Uranium Energy Corp. vs Centrus Energy Corp. Positioning
Uranium Energy has a geographically diversified asset base across Americas, focusing on raw material extraction. Centrus concentrates on nuclear fuel supply and technical services, including engineering. Diversification in UEC contrasts with LEU’s specialized, service-oriented approach.
Which has the best competitive advantage?
Both companies are shedding value with ROIC below WACC; however, UEC shows improving profitability while LEU’s profitability declines, indicating a slightly more favorable moat for Uranium Energy Corp.
Stock Comparison
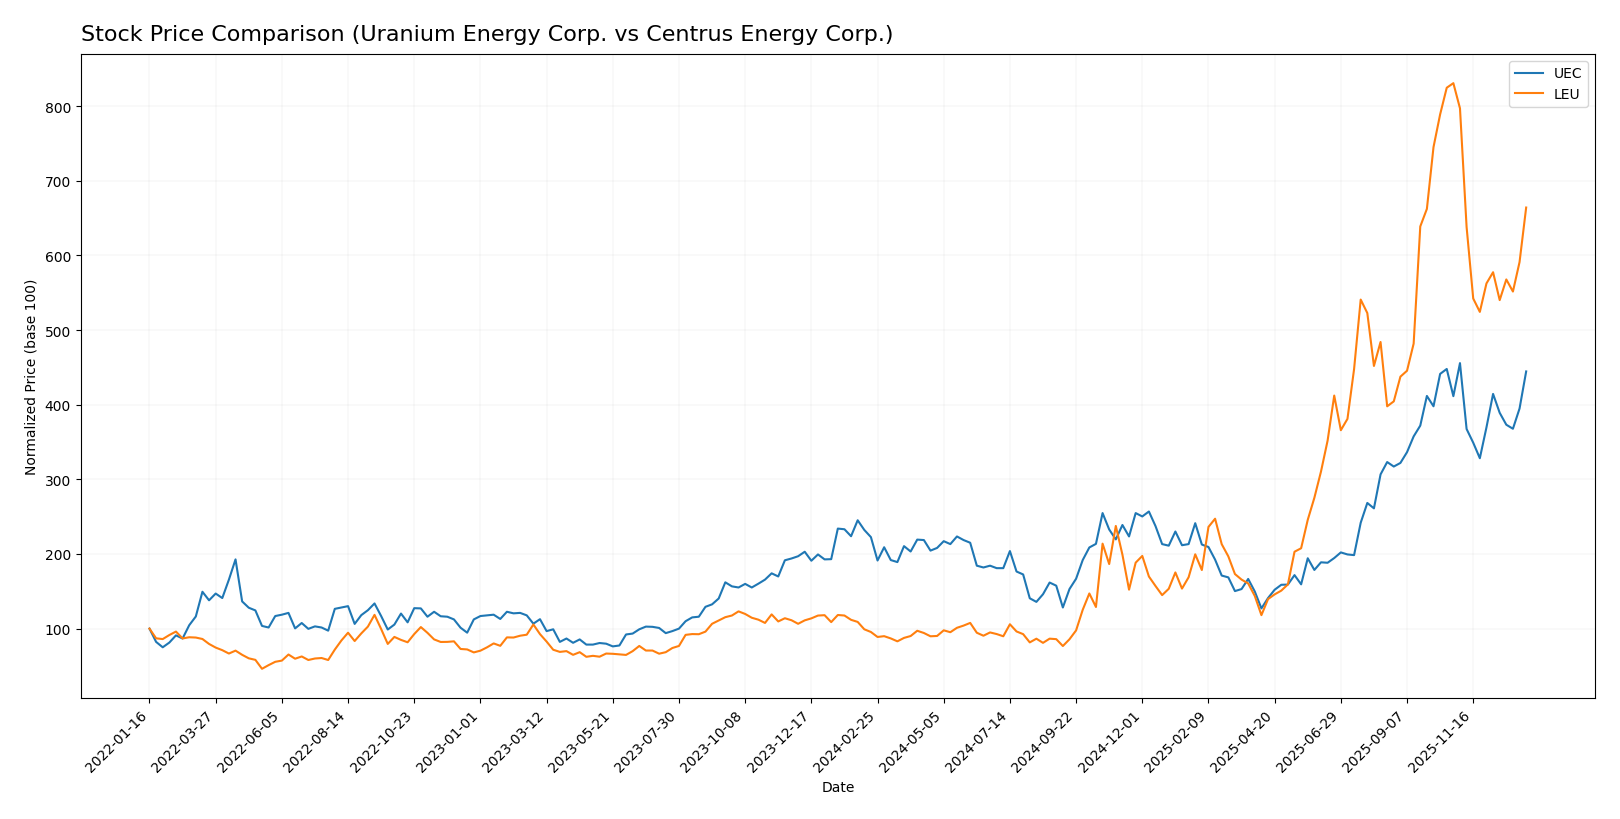
The stock price chart highlights significant bullish trends for both Uranium Energy Corp. and Centrus Energy Corp. over the past 12 months, with varied recent trading dynamics and deceleration in momentum.
Trend Analysis
Uranium Energy Corp. (UEC) exhibited a strong bullish trend over the past year, with a 99.73% price increase and decelerating momentum. The stock ranged from a low of 4.22 to a high of 15.13, showing moderate volatility (std dev 2.82).
Centrus Energy Corp. (LEU) showed a pronounced bullish trend over the past year with a 595.57% price increase but experienced deceleration and high volatility (std dev 97.12). Recently, LEU faced a bearish correction, dropping 20.05% over the last two and a half months.
Comparing the two, Centrus Energy Corp. delivered the highest market performance with a substantially larger price increase despite recent short-term weakness compared to Uranium Energy Corp.
Target Prices
The current analyst consensus indicates promising upside potential for these uranium sector stocks.
| Company | Target High | Target Low | Consensus |
|---|---|---|---|
| Uranium Energy Corp. | 19.75 | 14 | 17.08 |
| Centrus Energy Corp. | 390 | 125 | 288.4 |
Analysts expect Uranium Energy Corp. to rise moderately above its current price of $14.76, while Centrus Energy Corp.’s consensus target suggests a possible downside from its current $306.19 price, reflecting more varied expectations.
Analyst Opinions Comparison
This section compares analysts’ ratings and grades for Uranium Energy Corp. and Centrus Energy Corp.:
Rating Comparison
UEC Rating
- Rating: D+, assessed as Very Favorable overall rating.
- Discounted Cash Flow Score: 1, indicating a Very Unfavorable valuation.
- ROE Score: 1, reflecting Very Unfavorable efficiency in equity use.
- ROA Score: 1, showing Very Unfavorable asset utilization.
- Debt To Equity Score: 1, indicating Very Unfavorable financial risk.
- Overall Score: 1, categorized as Very Unfavorable financial standing.
LEU Rating
- Rating: B, assessed as Very Favorable overall rating.
- Discounted Cash Flow Score: 4, indicating a Favorable valuation.
- ROE Score: 5, reflecting Very Favorable efficiency in equity use.
- ROA Score: 4, showing Favorable asset utilization.
- Debt To Equity Score: 1, indicating Very Unfavorable financial risk.
- Overall Score: 3, categorized as Moderate financial standing.
Which one is the best rated?
Based on the provided data, Centrus Energy Corp. (LEU) is better rated than Uranium Energy Corp. (UEC). LEU shows higher scores across key financial metrics except for debt-to-equity, where both are equally unfavorable.
Scores Comparison
Here is a comparison of the Altman Z-Score and Piotroski Score for Uranium Energy Corp. and Centrus Energy Corp.:
UEC Scores
- Altman Z-Score: 30.44, indicating a safe zone with very low bankruptcy risk.
- Piotroski Score: 2, categorized as very weak financial strength.
LEU Scores
- Altman Z-Score: 2.70, placing it in the grey zone with moderate bankruptcy risk.
- Piotroski Score: 5, reflecting average financial strength.
Which company has the best scores?
Based on the provided data, UEC has a substantially higher Altman Z-Score, signaling stronger financial stability, but a weaker Piotroski Score compared to LEU’s moderate Altman Z-Score and average Piotroski Score.
Grades Comparison
The following is a comparison of the latest available grades from reputable grading companies for Uranium Energy Corp. and Centrus Energy Corp.:
Uranium Energy Corp. Grades
This table presents recent analyst grades for Uranium Energy Corp. from established financial firms.
| Grading Company | Action | New Grade | Date |
|---|---|---|---|
| Roth Capital | Maintain | Buy | 2025-12-11 |
| Goldman Sachs | Maintain | Buy | 2025-09-26 |
| Roth Capital | Maintain | Buy | 2025-09-25 |
| HC Wainwright & Co. | Maintain | Buy | 2025-09-25 |
| BMO Capital | Downgrade | Market Perform | 2025-09-25 |
| Roth Capital | Maintain | Buy | 2025-09-03 |
| HC Wainwright & Co. | Maintain | Buy | 2025-08-06 |
| HC Wainwright & Co. | Maintain | Buy | 2025-03-13 |
| HC Wainwright & Co. | Maintain | Buy | 2024-12-09 |
| Roth MKM | Maintain | Buy | 2024-10-23 |
The overall trend shows a strong consensus toward “Buy” ratings with one downgrade to “Market Perform,” indicating generally positive analyst sentiment.
Centrus Energy Corp. Grades
Below is a summary of recent analyst grades for Centrus Energy Corp. from recognized financial institutions.
| Grading Company | Action | New Grade | Date |
|---|---|---|---|
| Roth Capital | Maintain | Neutral | 2026-01-08 |
| B. Riley Securities | Maintain | Buy | 2025-12-22 |
| Needham | Maintain | Buy | 2025-12-22 |
| UBS | Maintain | Neutral | 2025-11-25 |
| JP Morgan | Maintain | Neutral | 2025-11-07 |
| JP Morgan | Maintain | Neutral | 2025-10-31 |
| HC Wainwright & Co. | Maintain | Buy | 2025-08-26 |
| Evercore ISI Group | Maintain | Outperform | 2025-08-08 |
| B of A Securities | Downgrade | Neutral | 2025-08-07 |
| JP Morgan | Maintain | Neutral | 2025-08-07 |
The grades reveal a mix of “Buy,” “Neutral,” and one “Outperform,” reflecting a more cautious but stable outlook from analysts.
Which company has the best grades?
Uranium Energy Corp. has received a stronger and more consistent set of “Buy” ratings compared to Centrus Energy Corp., which shows a balance between “Buy” and “Neutral” grades. This difference may influence investors seeking more confident bullish signals from analyst opinions.
Strengths and Weaknesses
Below is a comparative overview of key strengths and weaknesses for Uranium Energy Corp. (UEC) and Centrus Energy Corp. (LEU) based on the most recent financial and operational data.
| Criterion | Uranium Energy Corp. (UEC) | Centrus Energy Corp. (LEU) |
|---|---|---|
| Diversification | Limited product range, mainly Sale of Inventory | Diverse segments: Separative Work Units, Uranium, Services |
| Profitability | Negative net margin (-131.15%), ROIC unfavorable | Positive net margin (16.56%), ROE favorable (45.35%) |
| Innovation | Low asset turnover (0.06), low fixed asset turnover (0.09) | High fixed asset turnover (47.02), moderate asset turnover (0.4) |
| Global presence | Smaller scale, mostly US-focused | Larger global footprint, multiple product lines |
| Market Share | Smaller revenue base (~67M USD in 2025) | Larger revenue base (~350M USD in 2024), leading market segments |
Key takeaways: UEC struggles with profitability and operational efficiency despite showing some improvement in ROIC trend, indicating potential for future value creation. LEU demonstrates stronger profitability, diversified revenue streams, and better operational metrics, though its ROIC is declining. Investors should weigh UEC’s growth potential against LEU’s established market position and current profitability.
Risk Analysis
Below is a comparison of key risks for Uranium Energy Corp. (UEC) and Centrus Energy Corp. (LEU) based on their latest available data.
| Metric | Uranium Energy Corp. (UEC) | Centrus Energy Corp. (LEU) |
|---|---|---|
| Market Risk | Beta 1.236; volatile price range $3.85–$17.8 | Beta 1.252; wide price range $49.4–$464.25 |
| Debt level | Very low debt-to-equity (0.0), debt/assets 0.21% | Moderate debt-to-equity (0.97), debt/assets 14.36% |
| Regulatory Risk | Exposure in US, Canada, Paraguay; uranium industry regulation sensitive | US & international nuclear fuel regulations; complex compliance |
| Operational Risk | Small workforce (94 employees); multiple mining projects in early stages | Larger workforce (322); complex manufacturing and technical services |
| Environmental Risk | Uranium and titanium mining with potential contamination concerns | Nuclear fuel supply chain, including enrichment technology risks |
| Geopolitical Risk | Operations in Americas; some exposure in Paraguay | International sales including Japan, Belgium; geopolitical nuclear issues |
The most impactful and probable risks are regulatory and operational. UEC’s unfavorable financial health and weak profitability amplify market and operational risks, despite low debt. LEU shows stronger profitability and operational scale but faces higher debt and geopolitical complexities, especially due to international exposure in sensitive nuclear markets. Investors should weigh UEC’s financial distress signals against LEU’s moderate leverage and sector-specific regulatory challenges.
Which Stock to Choose?
Uranium Energy Corp. (UEC) shows a volatile income evolution with a recent strong revenue growth of 29,738%, yet overall income remains unfavorable. Its financial ratios are mostly unfavorable, including negative profitability and high net debt to EBITDA, despite strong liquidity ratios. The company’s rating is very unfavorable (D+), reflecting significant financial challenges.
Centrus Energy Corp. (LEU) presents a favorable income evolution marked by positive net and EBIT margins and steady revenue growth of 38% in the last year, though some profitability metrics declined. Its financial ratios are generally favorable, with strong returns on equity and assets, but a high debt-to-equity ratio impacts the rating. LEU’s overall rating is favorable (B), indicating a comparatively healthier financial position.
For investors, LEU’s favorable rating and more consistent income statement and financial ratios may appeal to those seeking quality and moderate growth exposure. Conversely, UEC’s improving profitability but unfavorable financials might attract risk-tolerant investors focused on potential turnaround or growth opportunities, albeit with higher uncertainty.
Disclaimer: Investment carries a risk of loss of initial capital. The past performance is not a reliable indicator of future results. Be sure to understand risks before making an investment decision.
Go Further
I encourage you to read the complete analyses of Uranium Energy Corp. and Centrus Energy Corp. to enhance your investment decisions: