Home > Comparison > Healthcare > HUM vs CNC
The strategic rivalry between Humana Inc. and Centene Corporation shapes the healthcare plans industry in the U.S. Humana operates as a diversified health and well-being company with a broad retail and specialty benefits portfolio, while Centene focuses on managed care programs for under-insured populations, emphasizing government-subsidized plans. This analysis contrasts their distinct operational models to determine which offers superior risk-adjusted returns for a diversified portfolio in an evolving healthcare landscape.

Table of contents
Companies Overview
Humana Inc. and Centene Corporation both dominate the U.S. healthcare plans market with strong governmental ties and diverse service offerings.
Humana Inc.: A Health & Well-Being Powerhouse
Humana operates as a health and well-being company focused on medical and supplemental benefit plans. Its core revenue comes from retail, group, specialty health insurance, and healthcare services, including pharmacy and home health solutions. In 2021, it strategically expanded its membership to approximately 22 million through Medicare, Medicaid, and commercial contracts, emphasizing integrated care delivery.
Centene Corporation: A Government-Sponsored Care Leader
Centene excels as a multinational healthcare enterprise serving under-insured and uninsured populations primarily via government programs like Medicaid and Medicare. Its revenue engine includes managed care health plans and specialty services such as pharmacy benefits and correctional health services. The 2021 strategy centered on broadening access through specialty programs and diversified commercial healthcare offerings.
Strategic Collision: Similarities & Divergences
Both companies prioritize government-subsidized health plans but differ in approach. Humana focuses on integrated care and wellness, while Centene emphasizes broad coverage for vulnerable populations and specialty services. Their battle for market share unfolds in Medicaid and Medicare segments. Investors will note Humana’s integrated care model contrasts with Centene’s expansive service network, shaping distinct risk and growth profiles.
Income Statement Comparison
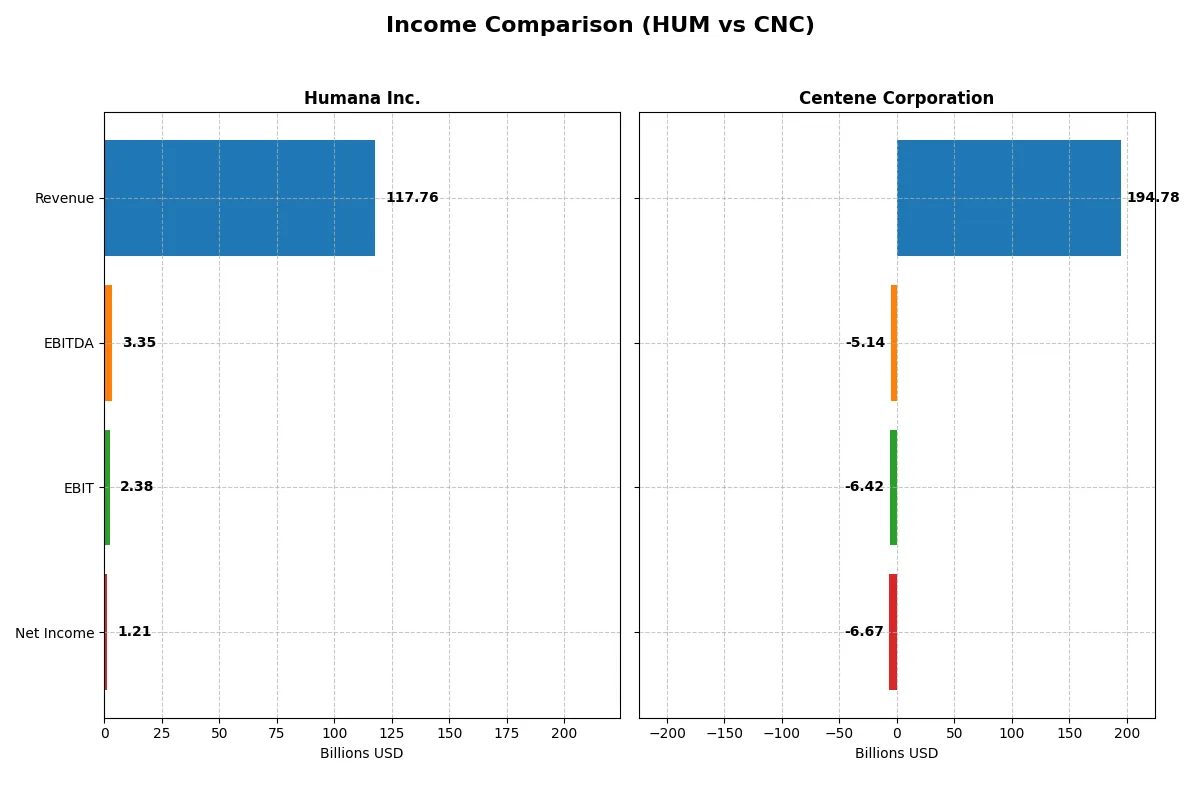
The following data dissects the core profitability and scalability of both corporate engines to reveal who dominates the bottom line:
| Metric | Humana Inc. (HUM) | Centene Corporation (CNC) |
|---|---|---|
| Revenue | 118B | 194.8B |
| Cost of Revenue | 0 | 171B |
| Operating Expenses | 116B | 31.5B |
| Gross Profit | 118B | 23.8B |
| EBITDA | 3.35B | -5.14B |
| EBIT | 2.38B | -6.42B |
| Interest Expense | 660M | 678M |
| Net Income | 1.21B | -6.67B |
| EPS | 10.01 | -13.61 |
| Fiscal Year | 2024 | 2025 |
Income Statement Analysis: The Bottom-Line Duel
This income statement comparison reveals which company’s financial engine runs more efficiently through revenue and profitability dynamics.
Humana Inc. Analysis
Humana’s revenue climbed steadily to 118B in 2024, up 10.7% year-over-year, but net income fell sharply to 1.2B, a 56% drop. Its gross margin remains solid at 100%, yet net margin compressed to just 1.02%, reflecting rising operating expenses. The 2024 results show weakening profitability momentum despite top-line growth.
Centene Corporation Analysis
Centene expanded revenue aggressively to 195B in 2025, a 19.4% rise from 2024, and gross profit surged 41.6%. However, it swung to a net loss of -6.7B with a negative net margin of -3.43%. EBIT margin also turned unfavorable at -3.29%, signaling deteriorating operational efficiency amid growth pressures.
Margin Resilience vs. Growth Strain
Humana maintains margin resilience despite declining net income, while Centene faces severe margin strain despite robust revenue growth. Humana’s controlled expenses preserve positive earnings, contrasting Centene’s loss-making scale. Investors seeking steadier profitability may favor Humana’s profile over Centene’s high-growth, high-risk trajectory.
Financial Ratios Comparison
These vital ratios act as a diagnostic tool to expose underlying fiscal health, valuation premiums, and capital efficiency for effective investment analysis:
| Ratios | Humana Inc. (HUM) | Centene Corporation (CNC) |
|---|---|---|
| ROE | 7.37% (2024) | -33.44% (2025) |
| ROIC | N/A | -18.85% (2025) |
| P/E | 25.3 (2024) | -3.03 (2025) |
| P/B | 1.87 (2024) | 1.01 (2025) |
| Current Ratio | 0 (2024) | 1.10 (2025) |
| Quick Ratio | 0 (2024) | 1.10 (2025) |
| D/E | 0.68 (2024) | 0.87 (2025) |
| Debt-to-Assets | 24.0% (2024) | 22.7% (2025) |
| Interest Coverage | 2.61 (2024) | -11.24 (2025) |
| Asset Turnover | 2.53 (2024) | 2.54 (2025) |
| Fixed Asset Turnover | 39.56 (2024) | 95.62 (2025) |
| Payout Ratio | 35.7% (2024) | 0% (2025) |
| Dividend Yield | 1.41% (2024) | 0% (2025) |
| Fiscal Year | 2024 | 2025 |
Efficiency & Valuation Duel: The Vital Signs
Ratios act as the company’s DNA, revealing hidden risks and operational excellence critical for understanding its financial health and market positioning.
Humana Inc.
Humana shows modest profitability with a 7.37% ROE and a slim 1.02% net margin, signaling operational challenges. Its P/E of 25.34 suggests the stock is stretched relative to earnings. Humana maintains a 1.41% dividend yield, balancing shareholder returns with reinvestment, though ROIC is notably absent, reflecting efficiency concerns.
Centene Corporation
Centene struggles with significant losses, posting a -33.44% ROE and -3.43% net margin, reflecting operational inefficiencies. Yet, its low P/E of -3.03 and P/B near 1.01 indicate an undervalued stock. No dividends are paid; capital appears focused on stabilizing operations and growth amid ongoing challenges.
Valuation Stretch vs. Recovery Potential
Humana’s stretched valuation contrasts with Centene’s undervalued profile amid weak profitability. Humana offers steady, if modest, returns with dividend support. Centene’s riskier profile suits investors seeking turnaround possibilities over immediate income. The choice hinges on risk appetite and time horizon.
Which one offers the Superior Shareholder Reward?
Humana Inc. (HUM) offers a more attractive shareholder reward than Centene Corporation (CNC) in 2026. HUM pays a 1.41% dividend yield with a reasonable 35.7% payout ratio, well-covered by free cash flow. HUM also runs consistent buybacks, enhancing total return. Conversely, CNC pays no dividends but invests heavily in growth, reflected in negative profit margins and erratic free cash flow. CNC’s buybacks are minimal or absent, and leverage is higher with weaker interest coverage. Historically, HUM’s balanced distribution and strong cash flow signal more sustainable, long-term value creation. I conclude HUM delivers superior total shareholder return potential in the current market environment.
Comparative Score Analysis: The Strategic Profile
The radar chart reveals the fundamental DNA and trade-offs of Humana Inc. and Centene Corporation, highlighting their distinctive financial strengths and vulnerabilities:
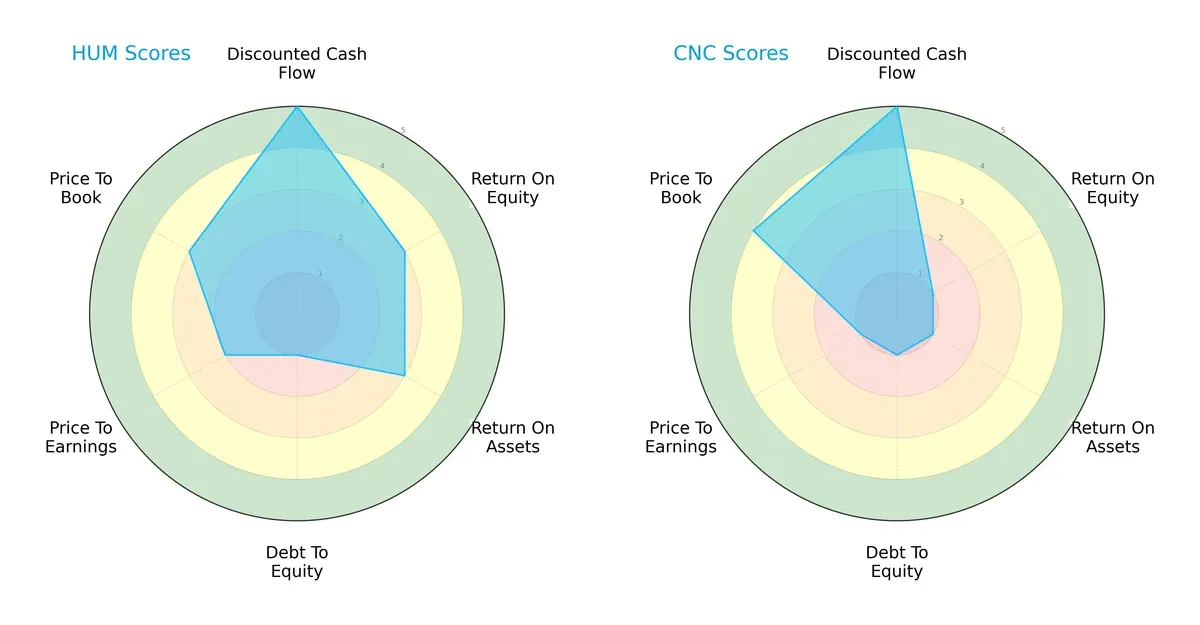
Humana shows a more balanced profile with moderate scores in ROE (3) and ROA (3), and a top-tier DCF score (5). Centene, while matching Humana’s DCF strength (5), lags significantly in ROE (1) and ROA (1). Both firms share weak debt management (1), but Centene’s valuation metrics are weaker, except for a slightly better Price-to-Book score (4 vs. 3). Humana relies on operational efficiency, whereas Centene depends more on valuation attractiveness.
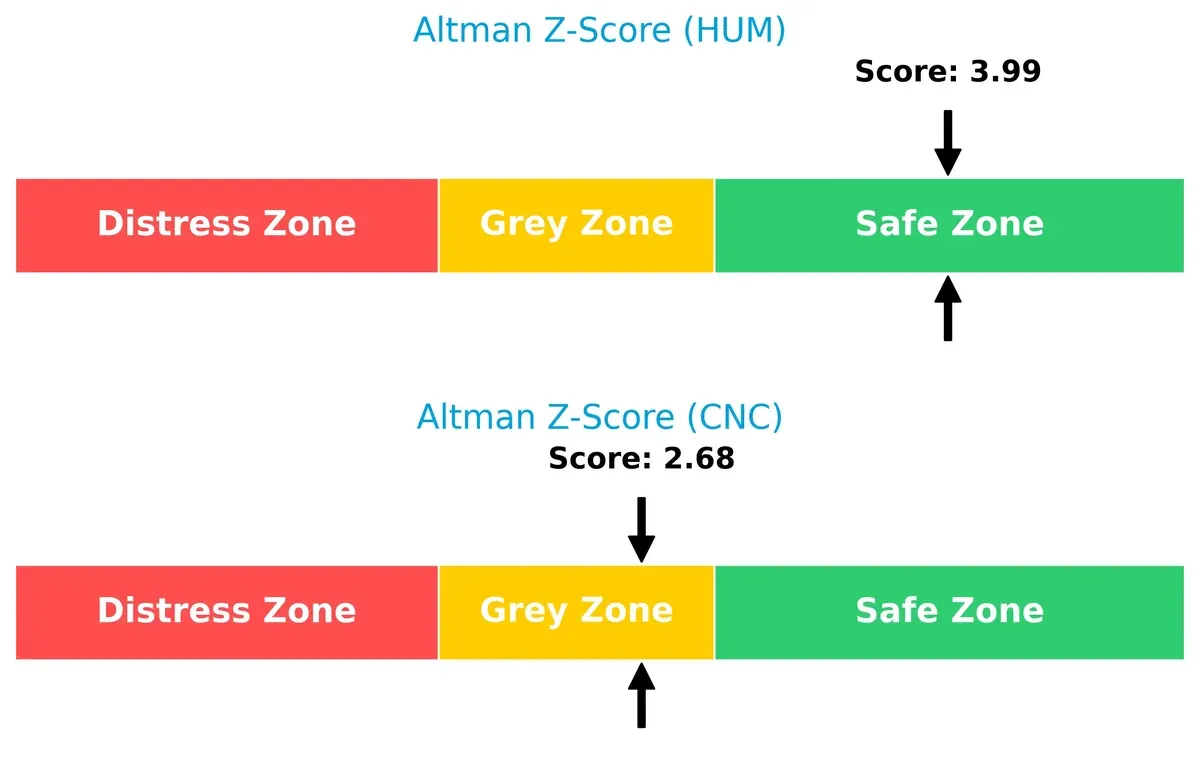
Bankruptcy Risk: Solvency Showdown
Humana’s Altman Z-Score of 3.99 places it safely above the distress threshold, signaling robust long-term survival prospects. Centene’s 2.68 falls into the grey zone, implying elevated bankruptcy risk in economic downturns:
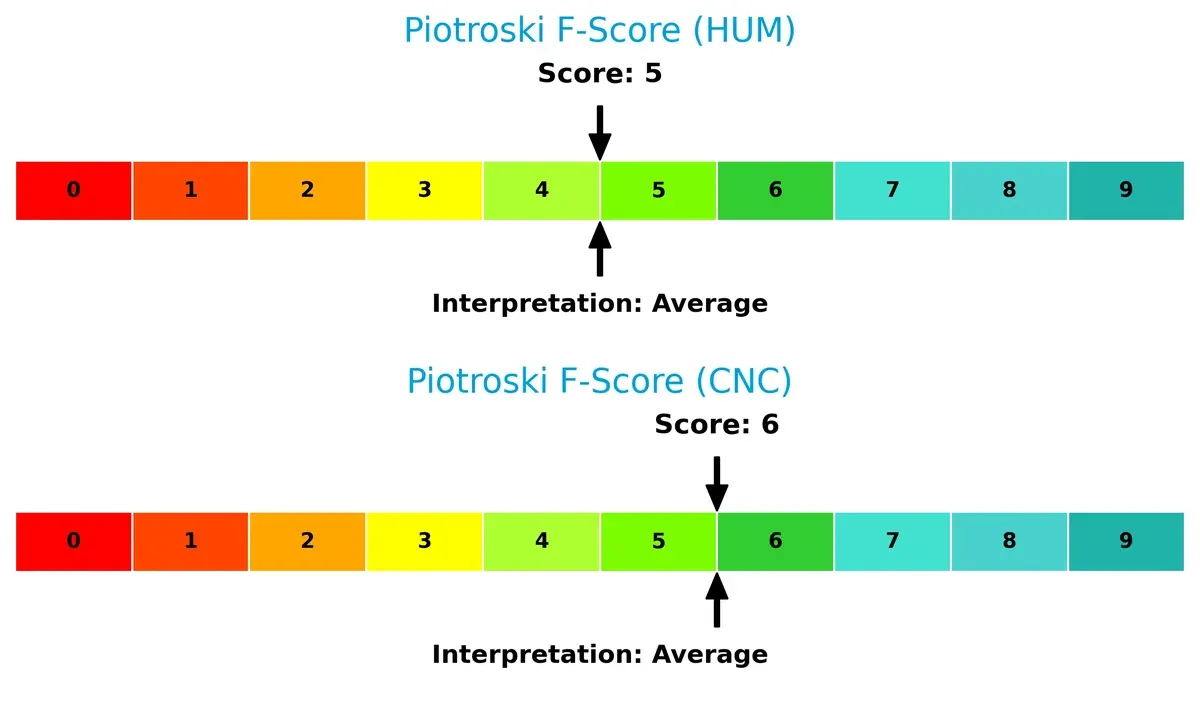
Financial Health: Quality of Operations
Both companies score in the average range on the Piotroski F-Score, with Centene slightly ahead at 6 versus Humana’s 5. Neither shows critical red flags, but Humana’s marginally lower score suggests room for operational improvements compared to Centene:
How are the two companies positioned?
This section dissects the operational DNA of Humana and Centene by comparing their revenue distribution by segment and internal dynamics. The goal is to confront their economic moats and identify which model offers the most resilient competitive advantage.
Revenue Segmentation: The Strategic Mix
This comparison dissects how Humana Inc. and Centene Corporation diversify their income streams and highlights their primary sector bets:
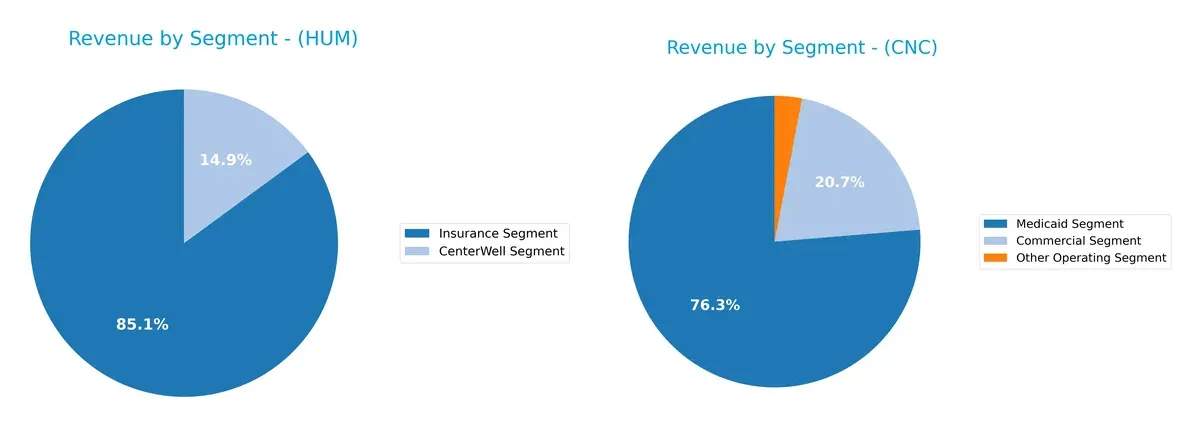
Humana leans heavily on its Insurance Segment, generating $114B in 2024, while CenterWell contributes $20B, showing moderate diversification. Centene relies more on Medicaid ($124B) but balances it with a $34B Commercial Segment and $5B Other Operating revenue. Humana’s insurance dominance anchors its ecosystem lock-in. Centene’s broader mix reduces concentration risk but signals exposure to Medicaid policy shifts. Both strategies reflect distinct bets in healthcare services and insurance.
Strengths and Weaknesses Comparison
This table compares the Strengths and Weaknesses of Humana Inc. and Centene Corporation:
Humana Inc. Strengths
- Favorable debt to assets ratio at 24%
- Strong asset turnover of 2.53 and fixed asset turnover of 39.56
- WACC at 5.43% is favorable
- Diverse revenue streams with Insurance and CenterWell segments generating large revenues
Centene Corporation Strengths
- Favorable WACC at 4.6%
- Positive price-to-book ratio at 1.01
- Strong asset turnover of 2.54 and very high fixed asset turnover of 95.62
- Healthy quick ratio at 1.1
- Large Medicaid and Commercial segments contribute significant revenue
Humana Inc. Weaknesses
- Unfavorable net margin at 1.02% and ROE at 7.37%
- Zero ROIC indicating no effective capital returns
- Current and quick ratios at 0, signaling liquidity concerns
- PE ratio of 25.34 flagged unfavorable
- Dividend yield neutral at 1.41%
Centene Corporation Weaknesses
- Negative net margin at -3.43% and ROE at -33.44%
- Negative ROIC at -18.85%
- Negative interest coverage at -9.46
- No dividend yield
- Negative PE ratio at -3.03 despite favorable classification
Humana shows strengths in capital structure and asset efficiency but struggles with profitability and liquidity. Centene demonstrates operational efficiency and liquidity but faces significant profitability and coverage challenges. Both must address profitability to improve their financial health and investor appeal.
The Moat Duel: Analyzing Competitive Defensibility
A structural moat alone protects long-term profits from relentless competition and market pressures. Let’s dissect how these two healthcare giants defend their turf:
Humana Inc.: Specialty Services and Integrated Care Moat
Humana’s competitive edge stems from its integrated healthcare services and specialty plans, reflected in stable margins despite pressure. Its 2026 outlook hinges on expanding home health and pharmacy solutions to deepen its moat.
Centene Corporation: Scale in Government Programs Moat
Centene’s moat relies on scale and government contracts, contrasting Humana’s specialty focus. Despite growing revenue, its declining ROIC signals weakening profitability, though new Medicaid expansions could offer growth opportunities.
Integrated Care Depth vs. Scale Efficiency Battle
Humana’s moat appears deeper due to more stable profitability and diversified specialty services. Centene’s scale advantage is eroding amid value destruction. Humana stands better poised to defend and grow its market share in 2026.
Which stock offers better returns?
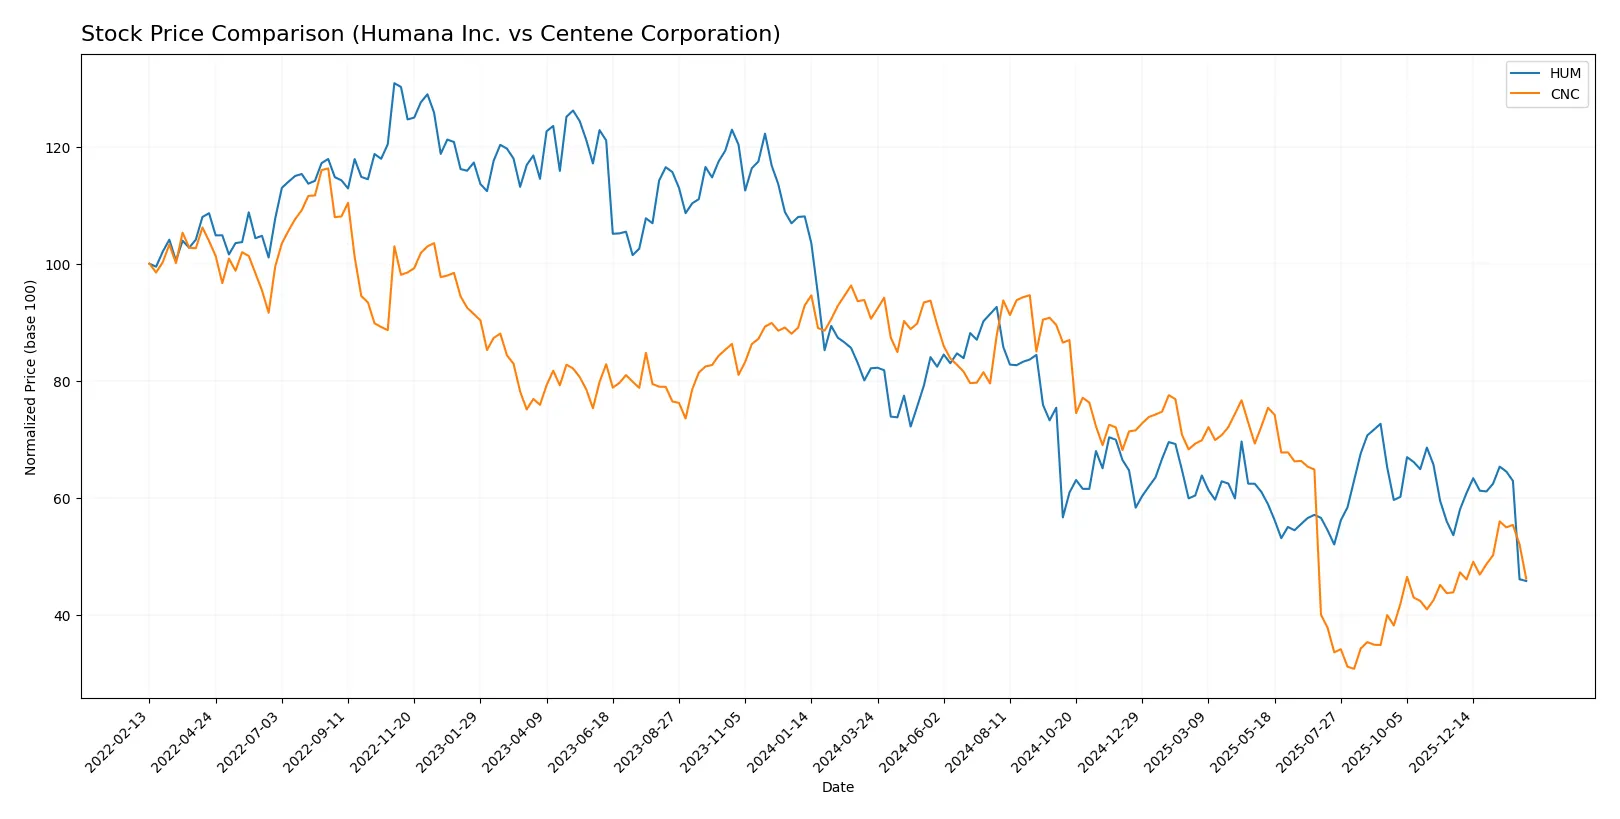
The past year shows Humana Inc. and Centene Corporation both enduring significant declines with contrasting recent momentum and volume dynamics.
Trend Comparison
Humana Inc. exhibits a bearish trend over the past 12 months with a -44.29% price change and decelerating decline, hitting a high of 392.63 and low of 193.94.
Centene Corporation also trends bearish over the year, dropping -49.04% but with accelerating downward momentum, reaching a high of 78.83 and a low of 25.59.
Recent data shows Humana’s decline continues, down -14.6% with seller dominance, while Centene posts a modest 5.37% gain and slight buyer dominance.
Centene’s recent positive shift contrasts with Humana’s ongoing bearishness, but over the full year, Humana outperforms Centene with a smaller overall decline.
Target Prices
Analysts present a diverse target price range reflecting cautious optimism for Humana Inc. and Centene Corporation.
| Company | Target Low | Target High | Consensus |
|---|---|---|---|
| Humana Inc. | 174 | 345 | 277.5 |
| Centene Corporation | 38 | 59 | 45.67 |
Humana’s consensus target of 277.5 suggests upside potential from the current 194 price, while Centene’s 45.67 target also indicates room for appreciation from 38.46. Both stocks trade below their median targets, implying analyst confidence in future gains.

Don’t Let Luck Decide Your Entry Point
Optimize your entry points with our advanced ProRealTime indicators. You’ll get efficient buy signals with precise price targets for maximum performance. Start outperforming now!
How do institutions grade them?
Here is a comparison of recent institutional grades for Humana Inc. and Centene Corporation:
Humana Inc. Grades
The following table lists recent grades from reputable financial institutions for Humana Inc.:
| Grading Company | Action | New Grade | Date |
|---|---|---|---|
| Morgan Stanley | Downgrade | Underweight | 2026-02-02 |
| Wells Fargo | Downgrade | Equal Weight | 2026-01-07 |
| Barclays | Maintain | Equal Weight | 2026-01-05 |
| Morgan Stanley | Maintain | Equal Weight | 2025-12-18 |
| Jefferies | Upgrade | Buy | 2025-12-05 |
| Barclays | Maintain | Equal Weight | 2025-11-25 |
| Truist Securities | Maintain | Hold | 2025-11-10 |
| Deutsche Bank | Maintain | Hold | 2025-11-07 |
| B of A Securities | Maintain | Neutral | 2025-10-10 |
| Mizuho | Maintain | Outperform | 2025-10-09 |
Centene Corporation Grades
Below are recent grades from well-known grading firms for Centene Corporation:
| Grading Company | Action | New Grade | Date |
|---|---|---|---|
| Wells Fargo | Maintain | Equal Weight | 2026-01-07 |
| Barclays | Upgrade | Overweight | 2026-01-05 |
| Bernstein | Maintain | Outperform | 2025-11-21 |
| Wells Fargo | Maintain | Equal Weight | 2025-11-12 |
| JP Morgan | Maintain | Neutral | 2025-11-04 |
| Barclays | Maintain | Equal Weight | 2025-11-04 |
| TD Cowen | Maintain | Hold | 2025-10-31 |
| Goldman Sachs | Maintain | Sell | 2025-10-31 |
| Cantor Fitzgerald | Maintain | Neutral | 2025-10-30 |
| Truist Securities | Maintain | Buy | 2025-10-30 |
Which company has the best grades?
Centene Corporation generally holds stronger ratings, including an Overweight and Outperform, compared to Humana’s recent downgrades to Underweight. This may affect investor sentiment and valuations differently for each stock.
Risks specific to each company
The following categories identify the critical pressure points and systemic threats facing both firms in the 2026 market environment:
1. Market & Competition
Humana Inc.
- Holds a large member base with diversified health services, but faces margin pressure amid healthcare plan competition.
Centene Corporation
- Focuses on under-insured segments, but negative margins and ROE indicate struggles competing profitably.
2. Capital Structure & Debt
Humana Inc.
- Moderate debt-to-equity (0.68) with favorable debt-to-assets ratio; interest coverage neutral but manageable.
Centene Corporation
- Higher debt-to-equity (0.87) and negative interest coverage (-9.46) signal financial strain and risk of liquidity issues.
3. Stock Volatility
Humana Inc.
- Low beta (0.44) suggests lower volatility and defensive healthcare positioning.
Centene Corporation
- Slightly higher beta (0.49) indicates more price swings and higher market sensitivity.
4. Regulatory & Legal
Humana Inc.
- Contracts with Medicare/Medicaid expose it to reimbursement rate risks and regulatory changes.
Centene Corporation
- Heavy reliance on government-subsidized programs heightens vulnerability to policy shifts and compliance costs.
5. Supply Chain & Operations
Humana Inc.
- Diverse service segments including pharmacy and home health improve operational resilience.
Centene Corporation
- Complex service offerings require efficient coordination; operational risks elevated by financial pressures.
6. ESG & Climate Transition
Humana Inc.
- Demonstrates moderate ESG integration consistent with industry norms; risks from healthcare sector emissions.
Centene Corporation
- ESG efforts less transparent; exposure to social responsibility risks given vulnerable client base.
7. Geopolitical Exposure
Humana Inc.
- US-centric operations limit geopolitical risk but depend on stable domestic healthcare policies.
Centene Corporation
- Similar US focus but greater exposure to Medicaid expansions and political shifts affecting coverage.
Which company shows a better risk-adjusted profile?
Humana’s most impactful risk is margin pressure amid intense competition and regulatory reimbursement changes. Centene’s largest risk stems from its precarious capital structure and negative profitability, risking financial distress. Humana’s lower stock volatility, better Altman Z-Score (3.99 safe zone vs. 2.68 grey zone), and more balanced debt ratios show a superior risk-adjusted profile. Centene’s negative interest coverage and worsening profitability confirm heightened financial vulnerability in 2026.
Final Verdict: Which stock to choose?
Humana Inc. (HUM) shines as a cash-generating machine with impressive operational efficiency. Its superpower lies in strong asset turnover and disciplined capital spending. However, its persistent value destruction and liquidity concerns remain points of vigilance. HUM suits investors seeking aggressive growth with a tolerance for elevated risk.
Centene Corporation (CNC) holds a strategic moat in its scale and diversified healthcare footprint, providing more defensive resilience. While currently facing profitability and ROIC challenges, CNC offers a comparatively safer profile with better liquidity metrics. It fits well in a GARP portfolio aiming for long-term recovery and value appreciation.
If you prioritize operational cash flow strength and can weather short-term profit erosion, Humana outshines due to its robust asset utilization. However, if you seek better stability and capital preservation in a turbulent sector, Centene offers superior liquidity and a more favorable risk profile despite earnings headwinds.
Disclaimer: Investment carries a risk of loss of initial capital. The past performance is not a reliable indicator of future results. Be sure to understand risks before making an investment decision.
Go Further
I encourage you to read the complete analyses of Humana Inc. and Centene Corporation to enhance your investment decisions: