Home > Comparison > Healthcare > ELV vs CNC
The strategic rivalry between Elevance Health Inc. and Centene Corporation shapes the future of healthcare plans. Elevance operates a broad, integrated health benefits platform serving 118M people, while Centene focuses on managed care for under-insured populations through government programs. This head-to-head pits scale and diversification against targeted government program expertise. This analysis will determine which company offers the superior risk-adjusted profile for a diversified healthcare portfolio in 2026.
Table of contents
Companies Overview
Elevance Health and Centene Corporation stand as pivotal players in the US healthcare plans market, shaping care access and affordability.
Elevance Health Inc.: Comprehensive Health Benefits Leader
Elevance Health dominates as a health benefits company serving 118M people. Its core revenue engine integrates medical, digital, pharmacy, behavioral, and clinical solutions. In 2026, it sharpens focus on connecting consumers across the entire care journey to improve outcomes and reduce costs through personalized support.
Centene Corporation: Government-Focused Managed Care Provider
Centene specializes in managed care for under-insured and uninsured populations. Its revenue model revolves around government-subsidized health plans like Medicaid and Medicare. The 2026 strategy emphasizes expanding specialty services and deepening care coordination across diverse state programs and commercial offerings.
Strategic Collision: Similarities & Divergences
Both firms operate in healthcare plans but differ in philosophy: Elevance pursues a broad, integrated ecosystem while Centene targets government-driven, specialized care. Their primary battleground lies in Medicaid and Medicare coverage expansion. Investors face distinct profiles—Elevance offers scale and diversification, Centene focuses on niche government markets with higher regulatory complexity.
Income Statement Comparison
This data dissects the core profitability and scalability of both corporate engines to reveal who dominates the bottom line:
| Metric | Elevance Health Inc. (ELV) | Centene Corporation (CNC) |
|---|---|---|
| Revenue | 199.1B | 194.8B |
| Cost of Revenue | 148.2B | 170.9B |
| Operating Expenses | 42.8B | 31.5B |
| Gross Profit | 50.9B | 23.8B |
| EBITDA | 9.7B | -5.1B |
| EBIT | 8.1B | -6.4B |
| Interest Expense | 1.4B | 678M |
| Net Income | 5.7B | -6.7B |
| EPS | 25.18 | -13.61 |
| Fiscal Year | 2025 | 2025 |
Income Statement Analysis: The Bottom-Line Duel
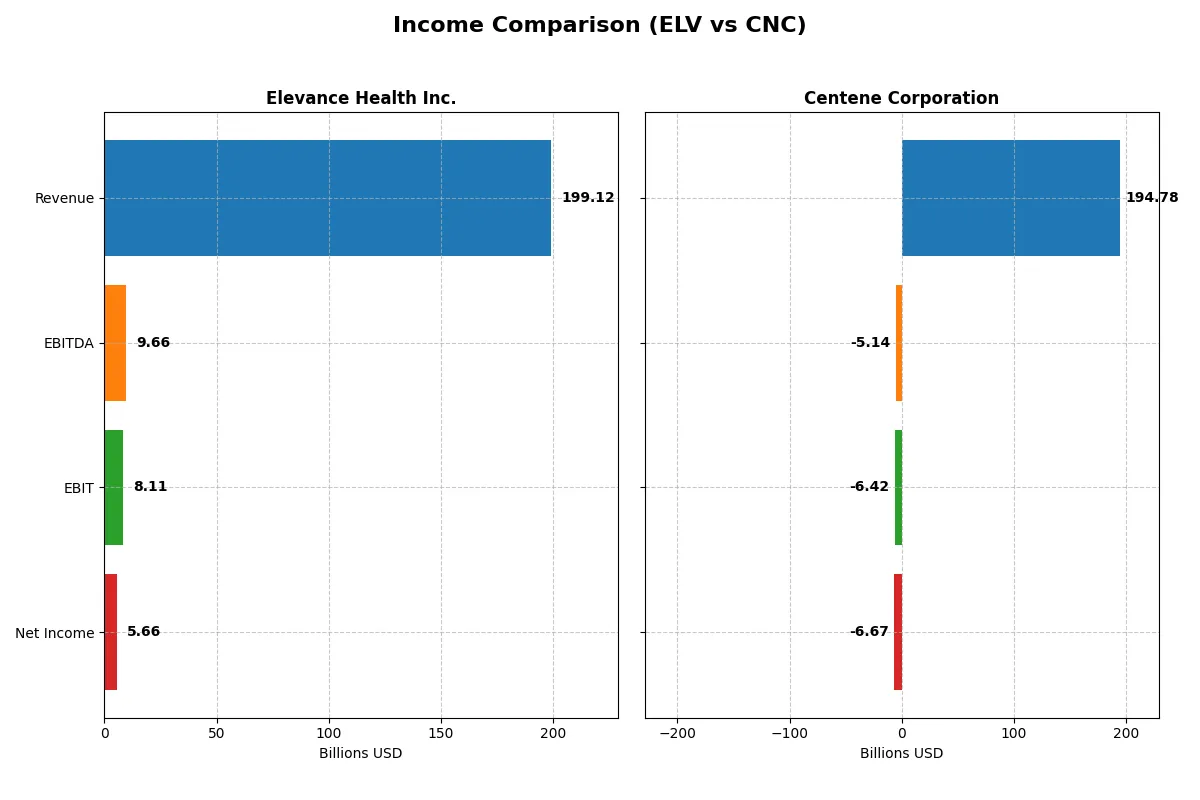
This income statement comparison uncovers which company converts sales into profits with greater efficiency and long-term momentum.
Elevance Health Inc. Analysis
Elevance Health’s revenue grew steadily, reaching 199B in 2025, yet net income declined slightly to 5.66B. Gross margin holds firm at 25.6%, signaling solid cost control, while net margin softened to 2.8%. Despite a 12.6% revenue jump in 2025, EBIT and net margin fell, reflecting pressure on profitability and operational efficiency.
Centene Corporation Analysis
Centene expanded revenue by 19.4% to 195B in 2025 but reported a net loss of -6.67B. Gross margin halved to 12.2%, and EBIT margin plunged into negative territory at -3.3%. The sharp deterioration in profitability alongside rising operating expenses highlights challenges in cost management and operational leverage.
Profit Stability vs. Revenue Growth Challenges
Elevance maintains healthier margins and stable profits, despite slight recent declines, while Centene’s top-line growth is overshadowed by large losses and margin erosion. Elevance’s profile favors investors seeking consistent profitability, whereas Centene’s volatile earnings signal higher risk and execution issues.
Financial Ratios Comparison
These vital ratios act as a diagnostic tool to expose the underlying fiscal health, valuation premiums, and capital efficiency of each company:
| Ratios | Elevance Health Inc. (ELV) | Centene Corporation (CNC) |
|---|---|---|
| ROE | 12.9% | -33.4% |
| ROIC | 7.2% | -18.9% |
| P/E | 13.7 | -3.0 |
| P/B | 1.77 | 1.01 |
| Current Ratio | 1.54 | 1.10 |
| Quick Ratio | 1.54 | 1.10 |
| D/E (Debt to Equity) | 0.73 | 0.87 |
| Debt-to-Assets | 26.4% | 22.7% |
| Interest Coverage | 5.0 | -11.2 |
| Asset Turnover | 1.64 | 2.54 |
| Fixed Asset Turnover | 42.5 | 95.6 |
| Payout Ratio | 27.0% | 0 |
| Dividend Yield | 1.97% | 0 |
| Fiscal Year | 2025 | 2025 |
Efficiency & Valuation Duel: The Vital Signs
Ratios act as a company’s DNA, unveiling hidden risks and operational strengths that raw figures alone cannot reveal.
Elevance Health Inc.
Elevance shows moderate profitability with a 12.9% ROE and a neutral 7.22% ROIC, signaling stable returns above its 5.33% WACC. The valuation is attractive, with a favorable P/E of 13.73 and a P/B near 1.77. It supports shareholders with a 1.97% dividend yield, reflecting balanced capital allocation between payouts and operational efficiency.
Centene Corporation
Centene struggles with negative profitability metrics: a -33.4% ROE and -18.85% ROIC highlight operational challenges. Despite a low P/B of 1.01 and a seemingly favorable P/E, these are skewed by losses. The firm pays no dividend, indicating a focus on restructuring or growth investments amid weak earnings and poor interest coverage at -9.46.
Balanced Strength vs. Risky Recovery
Elevance offers a more balanced profile, combining fair valuation and operational safety with consistent shareholder returns. Centene’s metrics suggest higher risk, reflecting recovery efforts rather than stable profitability. Investors seeking stability may prefer Elevance, while those with tolerance for volatility might consider Centene’s turnaround potential.
Which one offers the Superior Shareholder Reward?
I compare Elevance Health Inc. (ELV) and Centene Corporation (CNC) on dividend yields, payout ratios, and buybacks. ELV yields ~1.97% with a 27% payout ratio, sustaining dividends through strong free cash flow (~74% coverage). CNC pays no dividend, reinvesting heavily in growth amid recent losses. ELV also executes moderate buybacks, supporting shareholder value. CNC’s elevated leverage (debt-to-equity ~0.87) and negative margins limit sustainable returns. Historically in healthcare, consistent dividends backed by free cash flow signal durability. I conclude ELV offers a more attractive total return profile in 2026 due to its balanced distribution strategy and financial prudence.
Comparative Score Analysis: The Strategic Profile
The radar chart reveals the fundamental DNA and trade-offs of Elevance Health Inc. and Centene Corporation, highlighting their financial strengths and valuation nuances:
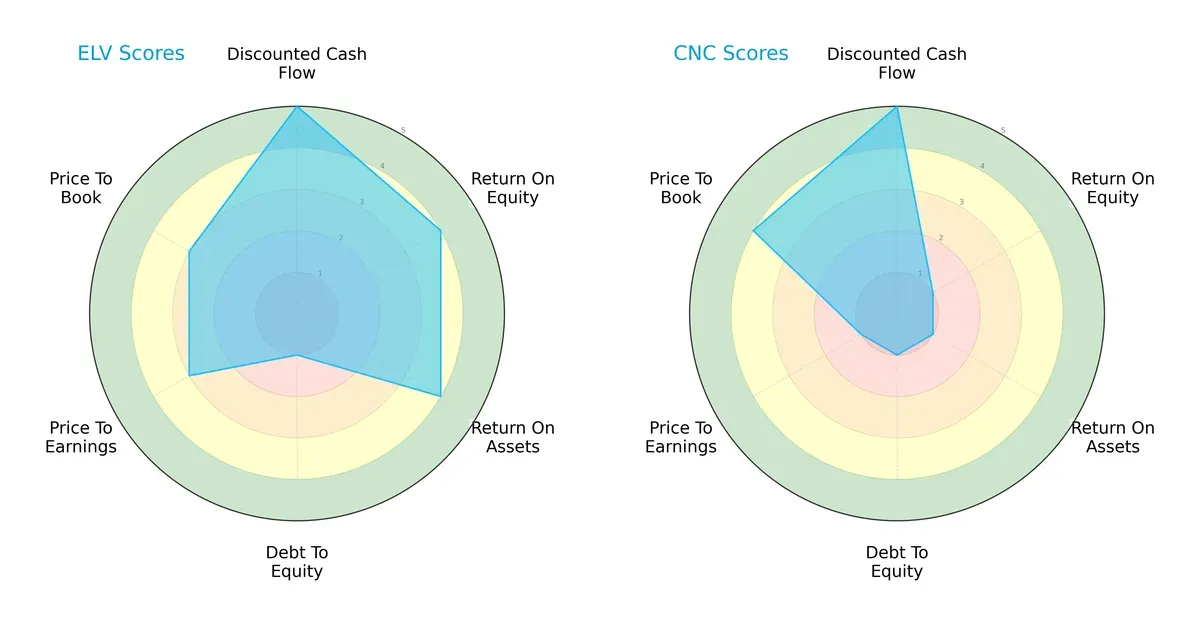
Elevance Health shows a balanced profile with strong DCF (5), ROE (4), and ROA (4) scores, reflecting efficient asset use and profitability. However, its very unfavorable debt-to-equity score (1) signals high leverage risk. Centene matches Elevance’s DCF strength (5) but suffers from very weak profitability scores (ROE 1, ROA 1) and poor valuation metrics (P/E 1), indicating reliance on cash flow rather than operational efficiency. Elevance’s moderate valuation scores (P/E 3, P/B 3) suggest fair pricing, while Centene’s favorable P/B (4) contrasts sharply with other weaknesses. I view Elevance as the more balanced and fundamentally sound company.
Bankruptcy Risk: Solvency Showdown
The Altman Z-Scores place both firms in the “grey zone,” with Centene (2.68) slightly ahead of Elevance (2.45), indicating moderate bankruptcy risk in this cycle:
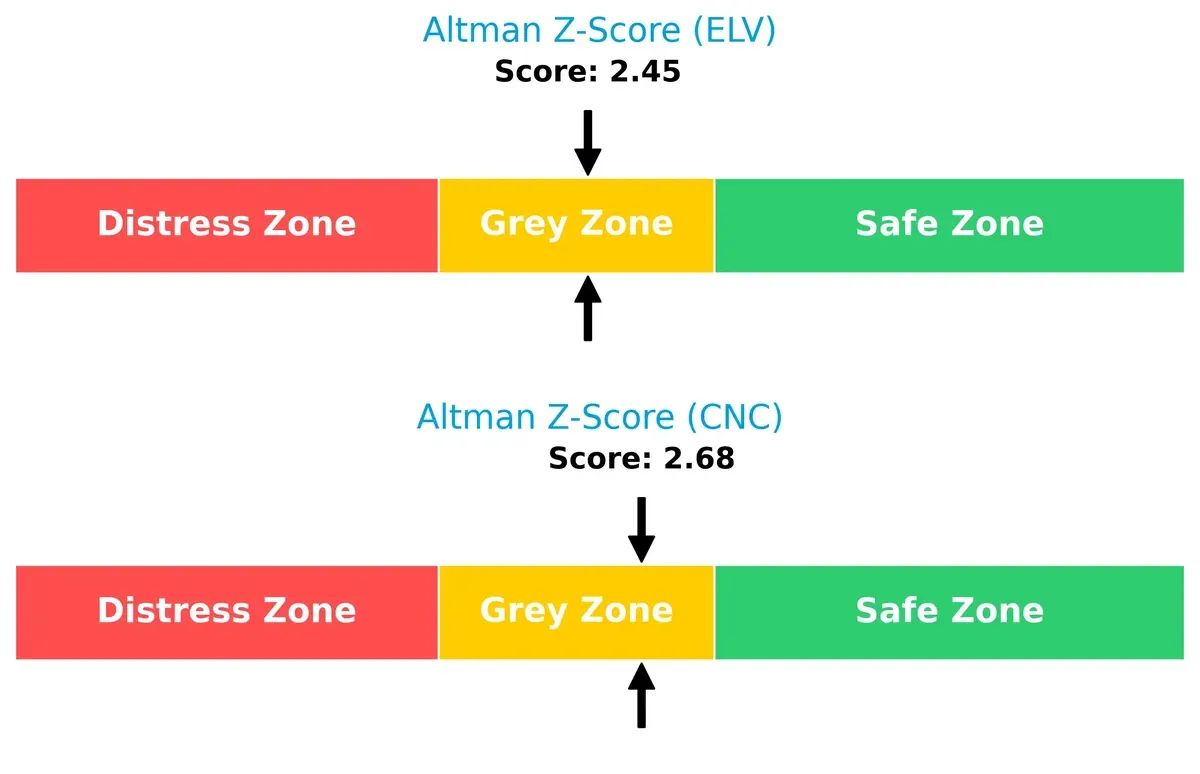
Both companies face financial uncertainty, but Centene’s marginally higher Z-Score suggests a slightly stronger buffer against distress. Investors should monitor leverage closely, especially Elevance’s elevated debt levels.
Financial Health: Quality of Operations
Piotroski F-Scores reveal Centene (6) edges out Elevance (5) by a small margin, indicating marginally better internal financial health and operational quality:
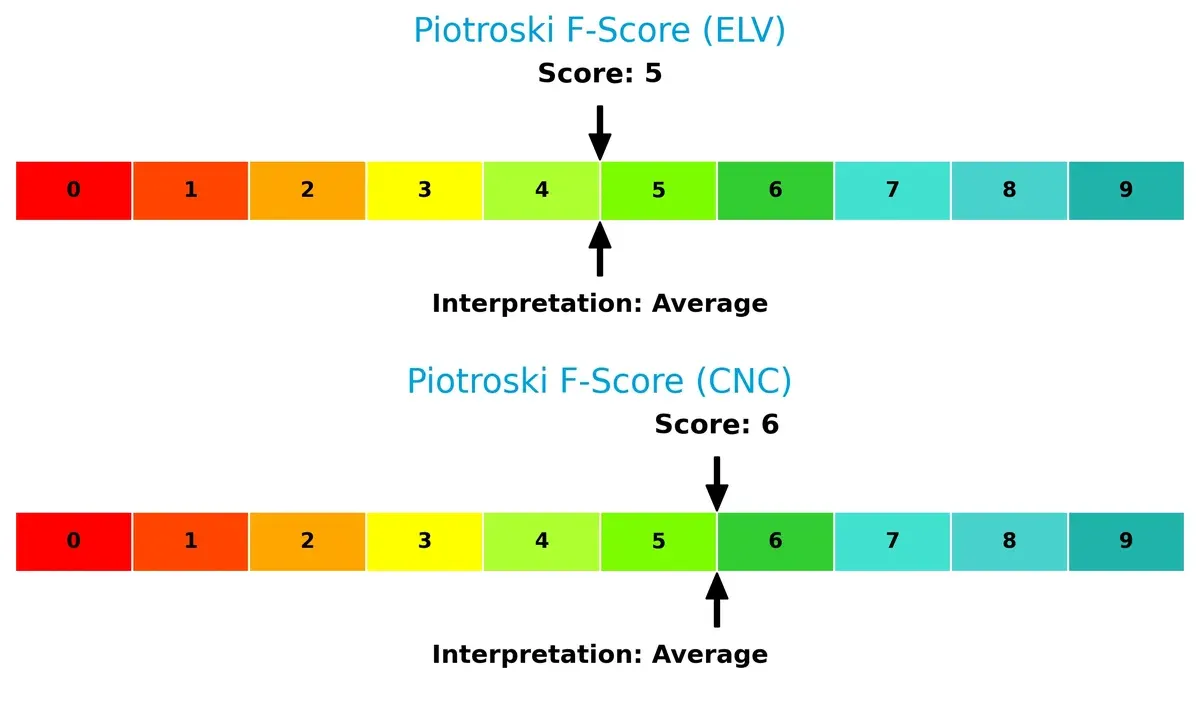
Scores in the mid-range signal average financial health for both, with no glaring red flags. However, neither company achieves high scores, suggesting room for operational improvements to strengthen shareholder value.
How are the two companies positioned?
This section dissects the operational DNA of Elevance Health and Centene by comparing their revenue distribution and internal dynamics. The goal is to confront their economic moats and identify which model delivers the most resilient competitive advantage today.
Revenue Segmentation: The Strategic Mix
This visual comparison dissects how Elevance Health Inc. and Centene Corporation diversify their income streams and where their primary sector bets lie:
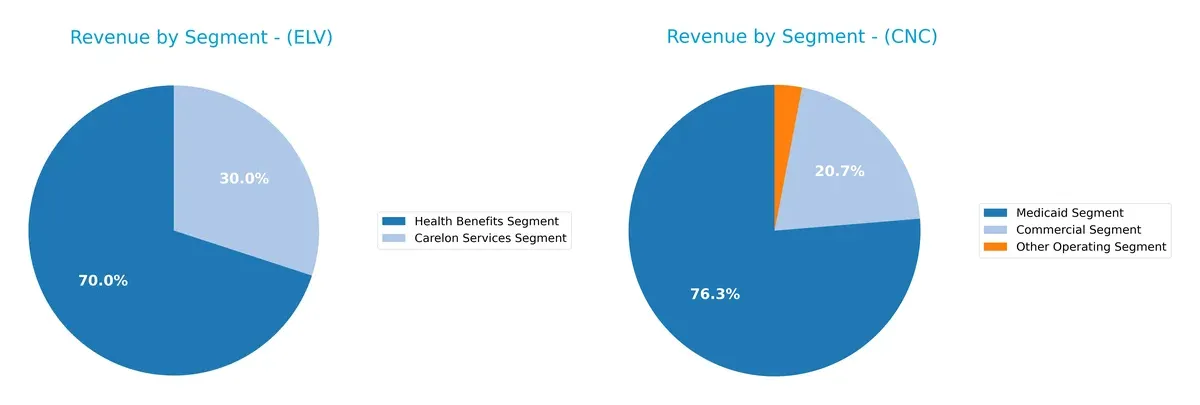
Elevance Health anchors its revenue in two segments: Health Benefits at $167B and Carelon Services at $71.7B, showing moderate diversification. Centene, however, heavily pivots on its Medicaid segment, generating $124.4B, with Commercial at $33.7B trailing far behind. Elevance’s balanced mix reduces concentration risk, while Centene’s Medicaid focus risks regulatory exposure but leverages strong government ties. This contrast highlights Elevance’s ecosystem lock-in versus Centene’s infrastructure dominance.
Strengths and Weaknesses Comparison
This table compares the Strengths and Weaknesses of Elevance Health Inc. and Centene Corporation based on key financial and strategic metrics:
Elevance Health Inc. Strengths
- Favorable WACC at 5.33% indicating efficient capital use
- Strong asset and fixed asset turnover suggesting operational efficiency
- Favorable current and quick ratios reflecting good short-term liquidity
- Diversified revenue streams from Carelon Services and Health Benefits segments
- Favorable debt-to-assets ratio at 26.38% supporting financial stability
Centene Corporation Strengths
- Favorable debt-to-assets at 22.67% implies manageable leverage
- High asset and fixed asset turnover indicating effective asset use
- Favorable quick ratio at 1.1 supports liquidity
- Presence in Medicaid and Commercial segments diversifies revenue
- Favorable price-to-book ratio near 1.01 suggesting undervaluation
Elevance Health Inc. Weaknesses
- Unfavorable net margin at 2.85% points to limited profitability
- Neutral ROE and ROIC suggest average capital returns
- Moderate debt-to-equity at 0.73 may limit financial flexibility
- No explicit geographic diversification data available
- Dividend yield neutral at 1.97% may be less attractive for income investors
Centene Corporation Weaknesses
- Negative net margin at -3.43% shows loss-making operations
- Highly unfavorable ROE at -33.44% and ROIC at -18.85% signal poor capital efficiency
- Negative interest coverage ratio at -9.46 indicates risk from debt servicing
- Zero dividend yield may deter income-focused investors
- No geographic diversification data limits growth visibility
Both companies show operational efficiency through asset turnover metrics, but Elevance Health maintains a stronger overall financial position with favorable liquidity and profitability metrics. Centene faces notable profitability and capital efficiency challenges that could impact its strategic options. Neither company discloses geographic diversification, which may constrain global growth potential insights.
The Moat Duel: Analyzing Competitive Defensibility
A structural moat is the only true shield protecting long-term profits from relentless competitive erosion. Let’s dissect the moats of two healthcare giants:
Elevance Health Inc.: Intangible Assets Powerhouse
Elevance’s primary moat lies in its vast network and brand equity, reflected in steady gross margins around 25%. However, declining ROIC signals vulnerability, though new digital health initiatives could reinforce its moat in 2026.
Centene Corporation: Cost Advantage Under Pressure
Centene leverages cost efficiency in government subsidized programs, but its negative EBIT margin and steep ROIC decline reveal a weakening moat. Expansion into specialty services offers growth, yet profitability challenges persist.
Intangible Assets vs. Cost Advantage: Which Moat Endures?
Elevance’s intangible asset moat remains wider and more resilient despite current profit pressures. Centene’s cost advantage faces deeper erosion, leaving Elevance better positioned to defend market share long term.
Which stock offers better returns?
The past year shows notable declines for both stocks, with recent modest recoveries signaling potential inflection points in trading dynamics.
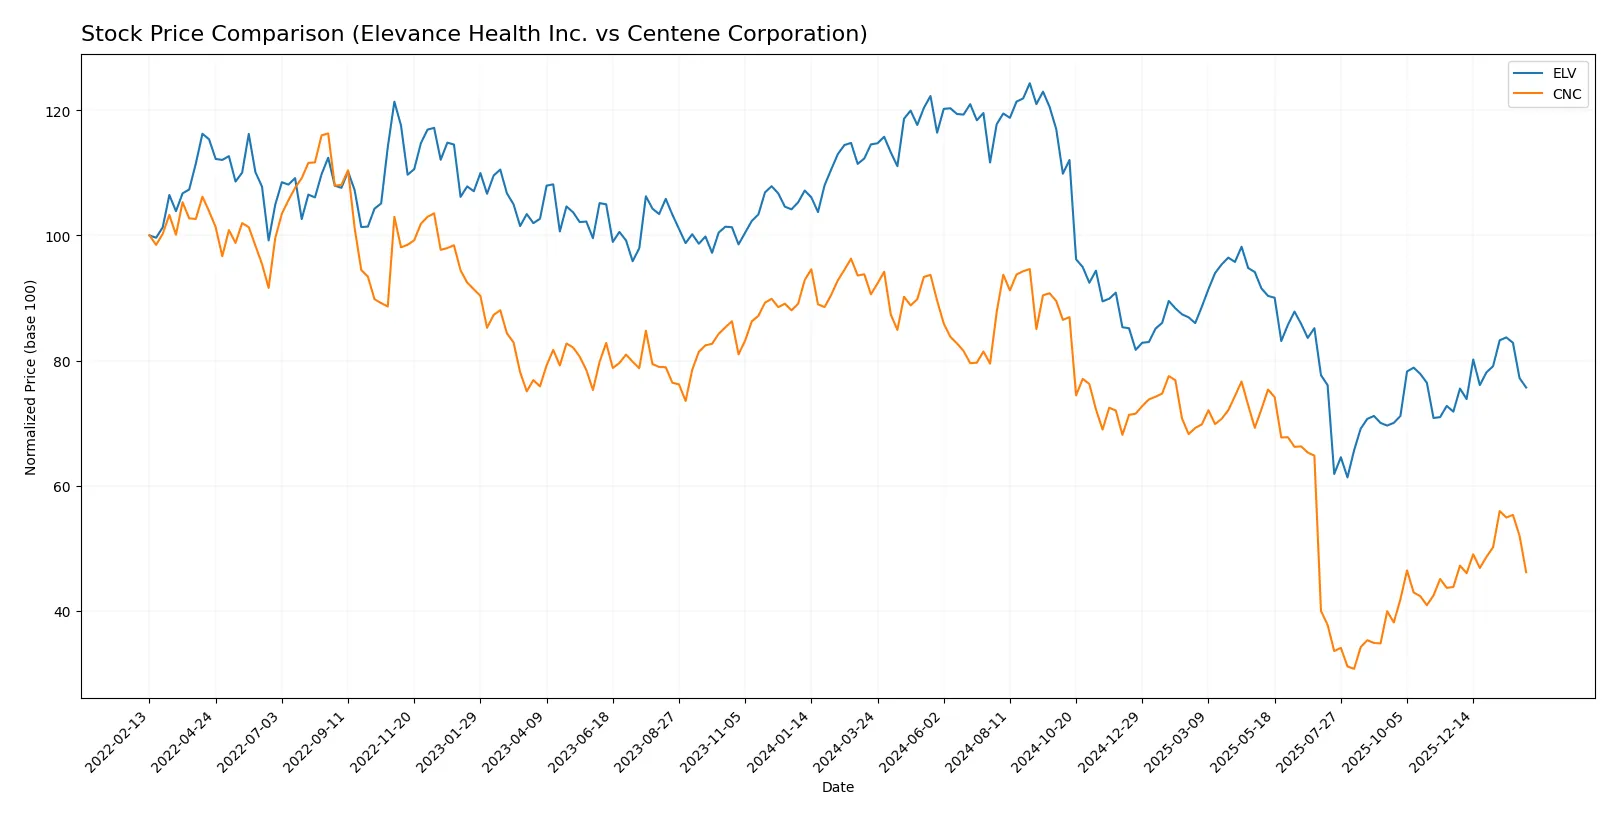
Trend Comparison
Elevance Health Inc. (ELV) experienced a 33.93% price drop over the past 12 months, confirming a bearish trend with accelerating decline and high volatility. Recent months show a 5.36% recovery, indicating a short-term bullish reversal.
Centene Corporation (CNC) posted a steeper 49.04% price decline over the same period, also bearish with accelerating losses but lower volatility than ELV. Recent gains of 5.37% suggest a nascent recovery phase.
Comparing trends, ELV outperformed CNC in market resilience, with a smaller overall decline and similar recent recovery gains, delivering relatively stronger market performance.
Target Prices
Analysts project moderate upside potential for Elevance Health Inc. and Centene Corporation based on current consensus targets.
| Company | Target Low | Target High | Consensus |
|---|---|---|---|
| Elevance Health Inc. | 332 | 425 | 387.14 |
| Centene Corporation | 38 | 59 | 45.67 |
Elevance Health’s consensus target of 387.14 implies roughly 14% upside from today’s 339 price. Centene’s 45.67 target suggests about 19% upside versus the current 38.46 price. Both stocks show room for gains but warrant monitoring given healthcare sector volatility.

Don’t Let Luck Decide Your Entry Point
Optimize your entry points with our advanced ProRealTime indicators. You’ll get efficient buy signals with precise price targets for maximum performance. Start outperforming now!
How do institutions grade them?
Elevance Health Inc. Grades
The following table summarizes recent grades from major financial institutions for Elevance Health Inc.:
| Grading Company | Action | New Grade | Date |
|---|---|---|---|
| JP Morgan | Maintain | Overweight | 2026-02-02 |
| Truist Securities | Maintain | Buy | 2026-02-02 |
| Barclays | Maintain | Overweight | 2026-01-30 |
| Wells Fargo | Maintain | Overweight | 2026-01-30 |
| Guggenheim | Maintain | Buy | 2026-01-29 |
| Guggenheim | Maintain | Buy | 2026-01-22 |
| Wolfe Research | Upgrade | Outperform | 2026-01-08 |
| Wells Fargo | Maintain | Overweight | 2026-01-07 |
| Barclays | Maintain | Overweight | 2026-01-05 |
| Deutsche Bank | Downgrade | Hold | 2025-12-19 |
Centene Corporation Grades
This table presents recent grades from recognized grading companies for Centene Corporation:
| Grading Company | Action | New Grade | Date |
|---|---|---|---|
| Wells Fargo | Maintain | Equal Weight | 2026-01-07 |
| Barclays | Upgrade | Overweight | 2026-01-05 |
| Bernstein | Maintain | Outperform | 2025-11-21 |
| Wells Fargo | Maintain | Equal Weight | 2025-11-12 |
| JP Morgan | Maintain | Neutral | 2025-11-04 |
| Barclays | Maintain | Equal Weight | 2025-11-04 |
| TD Cowen | Maintain | Hold | 2025-10-31 |
| Goldman Sachs | Maintain | Sell | 2025-10-31 |
| Cantor Fitzgerald | Maintain | Neutral | 2025-10-30 |
| Truist Securities | Maintain | Buy | 2025-10-30 |
Which company has the best grades?
Elevance Health consistently earns higher grades like Overweight and Buy, with an Outperform upgrade from Wolfe Research. Centene’s ratings are more mixed, including Equal Weight and Neutral, with some downgrades such as a Sell from Goldman Sachs. Investors may perceive Elevance as the stronger pick based on institutional confidence.
Risks specific to each company
The following categories identify the critical pressure points and systemic threats facing both firms in the 2026 market environment:
1. Market & Competition
Elevance Health Inc.
- Dominates with a $75B market cap and broad service portfolio. Faces intense competition but benefits from scale and brand.
Centene Corporation
- Smaller $19B market cap with focus on under-insured segments. Competitive pressure from larger insurers and regulatory shifts.
2. Capital Structure & Debt
Elevance Health Inc.
- Moderate debt-to-equity ratio at 0.73, interest coverage solid at 5.79 times, indicating manageable leverage.
Centene Corporation
- Slightly higher leverage at 0.87 D/E; negative interest coverage (-9.46) signals distress servicing debt.
3. Stock Volatility
Elevance Health Inc.
- Beta 0.50 reflects low volatility, stable trading range $273-$459, suitable for risk-averse investors.
Centene Corporation
- Beta 0.49 also low, but wider price range $25-$66 and recent negative price change (-3.6%) indicate higher short-term risk.
4. Regulatory & Legal
Elevance Health Inc.
- Faces regulatory scrutiny typical for large healthcare insurers but benefits from diversified product mix.
Centene Corporation
- Heavily exposed to Medicaid and government programs, increasing regulatory risk and reimbursement pressure.
5. Supply Chain & Operations
Elevance Health Inc.
- Strong operational efficiency with asset turnover of 1.64 and fixed asset turnover of 42.46, supporting cost control.
Centene Corporation
- More asset-intensive operations but higher asset turnover (2.54) and fixed asset turnover (95.62) suggesting operational agility.
6. ESG & Climate Transition
Elevance Health Inc.
- ESG focus aligns with investor expectations; dividend yield of 1.97% supports shareholder returns.
Centene Corporation
- No dividend yield, which may reflect less focus on shareholder returns and potentially slower ESG progress.
7. Geopolitical Exposure
Elevance Health Inc.
- Primarily US-based with limited international exposure, reducing geopolitical risk.
Centene Corporation
- Also US-focused but more vulnerable due to reliance on state-level programs sensitive to political shifts.
Which company shows a better risk-adjusted profile?
Elevance’s most impactful risk is modest net margin pressure amid stable financial health and strong debt coverage. Centene struggles with negative profitability and weak interest coverage, raising solvency concerns. Elevance’s robust capital structure and diversified model yield a superior risk-adjusted profile in 2026.
Final Verdict: Which stock to choose?
Elevance Health’s superpower lies in its robust operational efficiency and favorable cost of capital. Despite a slight decline in profitability metrics, it maintains solid liquidity and asset turnover. Its key point of vigilance is the negative free cash flow to equity, signaling caution for cash-sensitive investors. It suits portfolios seeking steady, efficient growth with moderate risk tolerance.
Centene Corporation offers a strategic moat through its attractive valuation and operational asset turnover. However, it struggles with profitability and value creation, reflecting a very unfavorable moat status. Relative to Elevance, Centene carries higher financial risk but could appeal to investors focused on deep value and turnaround potential within a risk-tolerant framework.
If you prioritize operational efficiency and stable capital allocation, Elevance Health is the compelling choice due to its favorable cost structure and liquidity. However, if you seek high-risk, deep value opportunities with potential for rebound, Centene offers a speculative but cheaper entry point. Both demand vigilant risk management given their bearish trends and profitability challenges.
Disclaimer: Investment carries a risk of loss of initial capital. The past performance is not a reliable indicator of future results. Be sure to understand risks before making an investment decision.
Go Further
I encourage you to read the complete analyses of Elevance Health Inc. and Centene Corporation to enhance your investment decisions: