Home > Comparison > Healthcare > CI vs CNC
The strategic rivalry between Cigna Corporation and Centene Corporation shapes the competitive landscape of the healthcare plans sector. Cigna operates as a diversified insurer with integrated health services, while Centene focuses on managed care for under-insured populations through government programs. This head-to-head pits broad-service scale against targeted government program expertise. This analysis aims to identify which operational model delivers a superior risk-adjusted return for a diversified portfolio in today’s evolving healthcare market.
Table of contents
Companies Overview
Cigna Corporation and Centene Corporation both command significant roles in the U.S. healthcare plans market.
Cigna Corporation: Integrated Healthcare Services Leader
Cigna dominates as a diversified healthcare provider with a focus on coordinated health services. Its revenue streams stem from medical, pharmacy, behavioral health, and dental plans, targeting insured and self-insured customers, including Medicare clients. In 2026, Cigna prioritizes expanding its Evernorth segment, emphasizing integrated care delivery and intelligence solutions to enhance cost efficiency and patient outcomes.
Centene Corporation: Government-Focused Managed Care Specialist
Centene operates as a multi-national healthcare enterprise, specializing in government-subsidized health programs like Medicaid and Medicare. Its Managed Care segment drives revenue by serving underinsured populations through comprehensive health plans and specialty services. In the current year, Centene sharpens its focus on scaling its Medicaid offerings and expanding services to correctional systems and military health beneficiaries.
Strategic Collision: Similarities & Divergences
Both firms compete in healthcare plans but diverge sharply in business philosophy. Cigna builds a closed ecosystem focused on integrated care and commercial insurance clients. Centene embraces an open infrastructure targeting public sector programs and vulnerable populations. Their battleground centers on the balance between commercial and government healthcare markets. Cigna presents a diversified, innovation-driven profile, while Centene offers growth tied to public healthcare policy and social services.
Income Statement Comparison
This data dissects the core profitability and scalability of both corporate engines to reveal who dominates the bottom line:
| Metric | Cigna Corporation (CI) | Centene Corporation (CNC) |
|---|---|---|
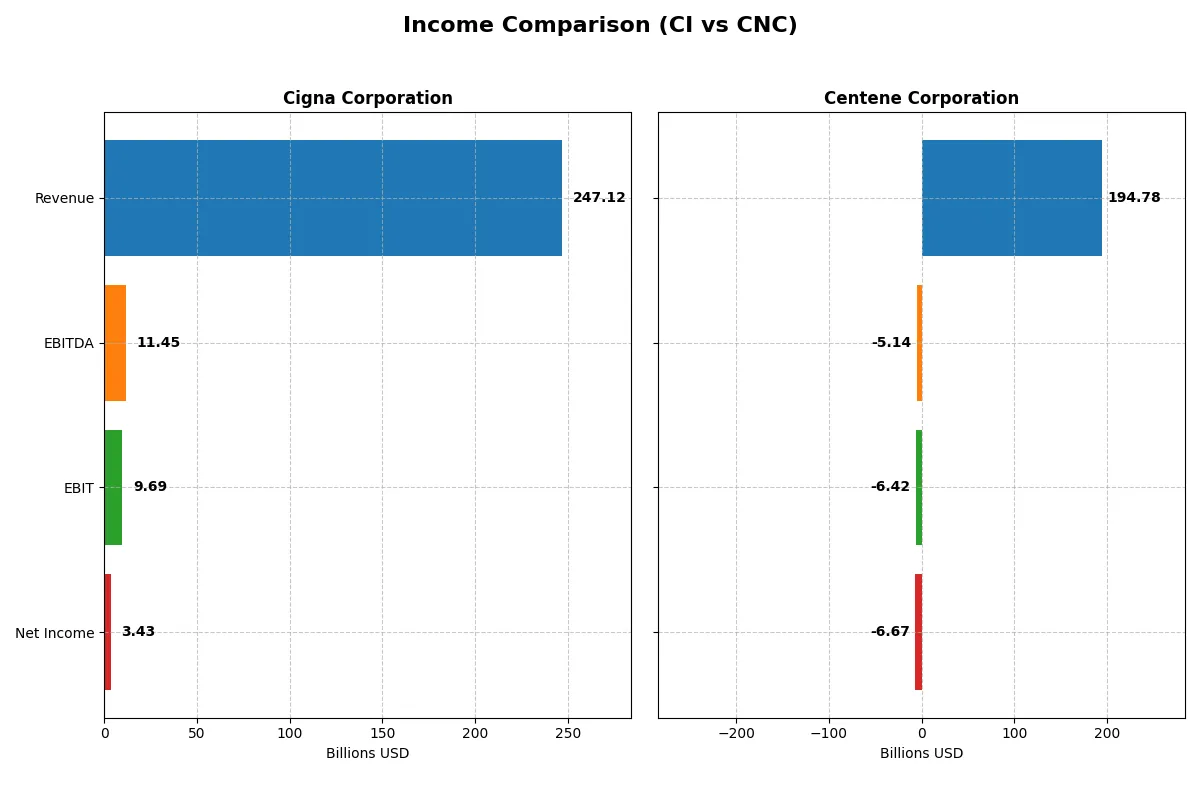
| Revenue | 247.1B | 194.8B |
| Cost of Revenue | 221.2B | 170.9B |
| Operating Expenses | 16.5B | 31.5B |
| Gross Profit | 25.9B | 23.8B |
| EBITDA | 11.4B | -5.1B |
| EBIT | 9.7B | -6.4B |
| Interest Expense | 1.4B | 0.7B |
| Net Income | 3.4B | -6.7B |
| EPS | 12.25 | -13.61 |
| Fiscal Year | 2024 | 2025 |
Income Statement Analysis: The Bottom-Line Duel
This income statement comparison reveals which company runs a more efficient and profitable business engine amid sector challenges.
Cigna Corporation Analysis
Cigna’s revenue surged 26.6% to $247B in 2024, reflecting strong top-line growth. Gross margin held steady near 10.5%, while net income declined 33%, signaling margin compression. Despite a 7.3% rise in EBIT, net margin fell to 1.39%, indicating rising costs dented profitability in the latest year.
Centene Corporation Analysis
Centene posted 19.4% revenue growth to $195B in 2025, with gross margin improving to 12.2%. However, EBIT swung to a negative margin of -3.3%, dragging net income into a $6.7B loss. The sharp margin deterioration offset top-line gains, reflecting operational struggles and inefficiencies in the latest fiscal year.
Margin Stability vs. Profit Volatility
Cigna leads with consistent revenue growth and positive EBIT margins, though net income and margins contracted recently. Centene’s revenue growth is promising, but severe margin erosion and net losses dominate its financial picture. For investors, Cigna’s stable profitability offers a more reliable profile amid volatile sector dynamics.
Financial Ratios Comparison
These vital ratios act as a diagnostic tool to expose the underlying fiscal health, valuation premiums, and capital efficiency of the companies compared below:
| Ratios | Cigna Corporation (CI) | Centene Corporation (CNC) |
|---|---|---|
| ROE | 8.37% | -33.44% |
| ROIC | 6.69% | -18.85% |
| P/E | 22.54 | -3.03 |
| P/B | 1.89 | 1.01 |
| Current Ratio | 0.84 | 1.10 |
| Quick Ratio | 0.73 | 1.10 |
| D/E | 0.78 | 0.87 |
| Debt-to-Assets | 20.5% | 22.7% |
| Interest Coverage | 6.56 | -11.24 |
| Asset Turnover | 1.59 | 2.54 |
| Fixed Asset Turnover | 298.46 | 95.62 |
| Payout ratio | 45.63% | 0% |
| Dividend yield | 2.02% | 0% |
| Fiscal Year | 2024 | 2025 |
Efficiency & Valuation Duel: The Vital Signs
Ratios serve as a company’s DNA, uncovering hidden risks and revealing operational strengths critical for investment decisions.
Cigna Corporation
Cigna delivers modest profitability with an 8.37% ROE and a slim 1.39% net margin, signaling efficiency challenges. Its P/E of 22.54 and P/B of 1.89 indicate a fairly valued stock, neither stretched nor cheap. The company supports shareholders with a 2.02% dividend yield, reflecting steady returns amid cautious reinvestment.
Centene Corporation
Centene shows deep profitability weaknesses with a -33.44% ROE and a negative net margin of -3.43%, marking operational struggles. Despite a low P/B of 1.01 and a negative P/E, the valuation appears attractive but risky. It pays no dividend, focusing on preserving cash flow for growth or restructuring.
Balanced Strength vs. Distressed Value
Cigna offers a more balanced risk-reward profile with stable profitability and shareholder returns. Centene’s financials expose significant risks despite cheaper valuation metrics. Investors seeking steady income may lean toward Cigna, while those tolerating volatility might explore Centene’s turnaround potential.
Which one offers the Superior Shareholder Reward?
I observe that Cigna Corporation (CI) delivers steady dividends with a 2.02% yield and a 46% payout ratio, supported by solid free cash flow coverage of 86%. Its buyback program adds further shareholder value, indicating a balanced distribution model. Centene Corporation (CNC) pays no dividends but reinvests heavily, focusing on growth amid volatile margins. Buybacks are limited, reflecting a conservative capital return. Given CNC’s negative recent profitability and lack of yield, I conclude CI offers a more attractive and sustainable total shareholder return profile in 2026.
Comparative Score Analysis: The Strategic Profile
The radar chart reveals the fundamental DNA and strategic trade-offs of Cigna Corporation and Centene Corporation:
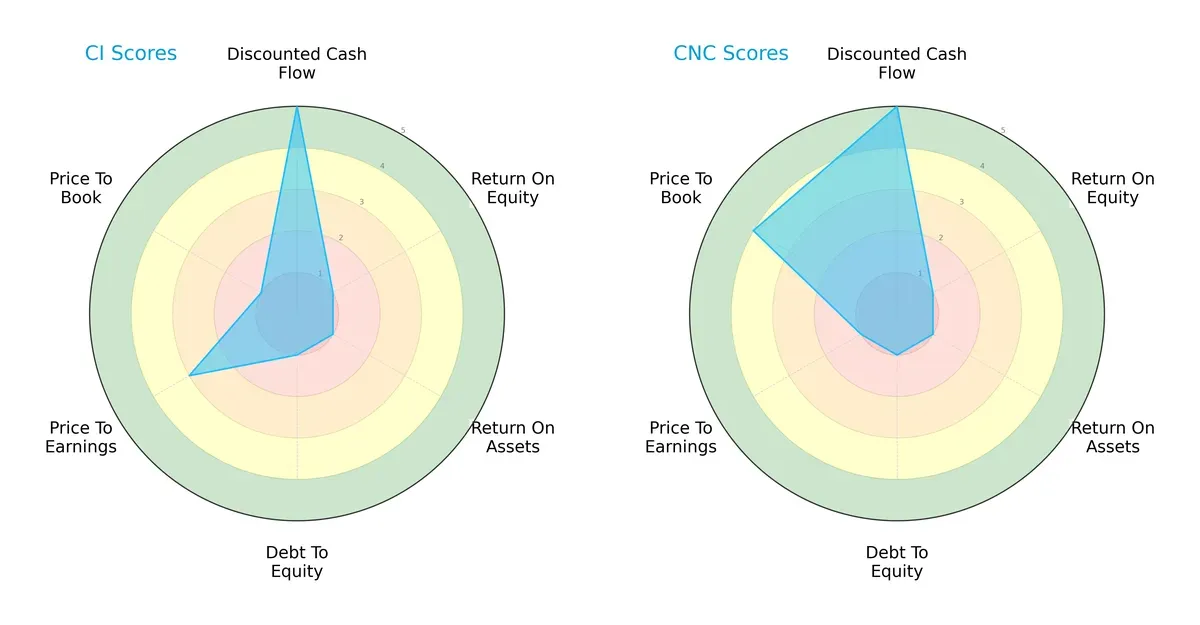
Both firms share very favorable discounted cash flow scores of 5, signaling robust cash flow expectations. However, each struggles with low returns on equity and assets, scoring 1 in both categories, reflecting operational challenges. Debt-to-equity scores also sit at 1, indicating high leverage and elevated financial risk for both. Valuation metrics diverge: Cigna holds a moderate price-to-earnings score of 3 but suffers from a very unfavorable price-to-book score of 1. Conversely, Centene fares poorly on price-to-earnings with a score of 1 but enjoys a favorable price-to-book score of 4. Neither company presents a balanced profile; each relies on a specific valuation edge—Cigna on P/E and Centene on P/B.
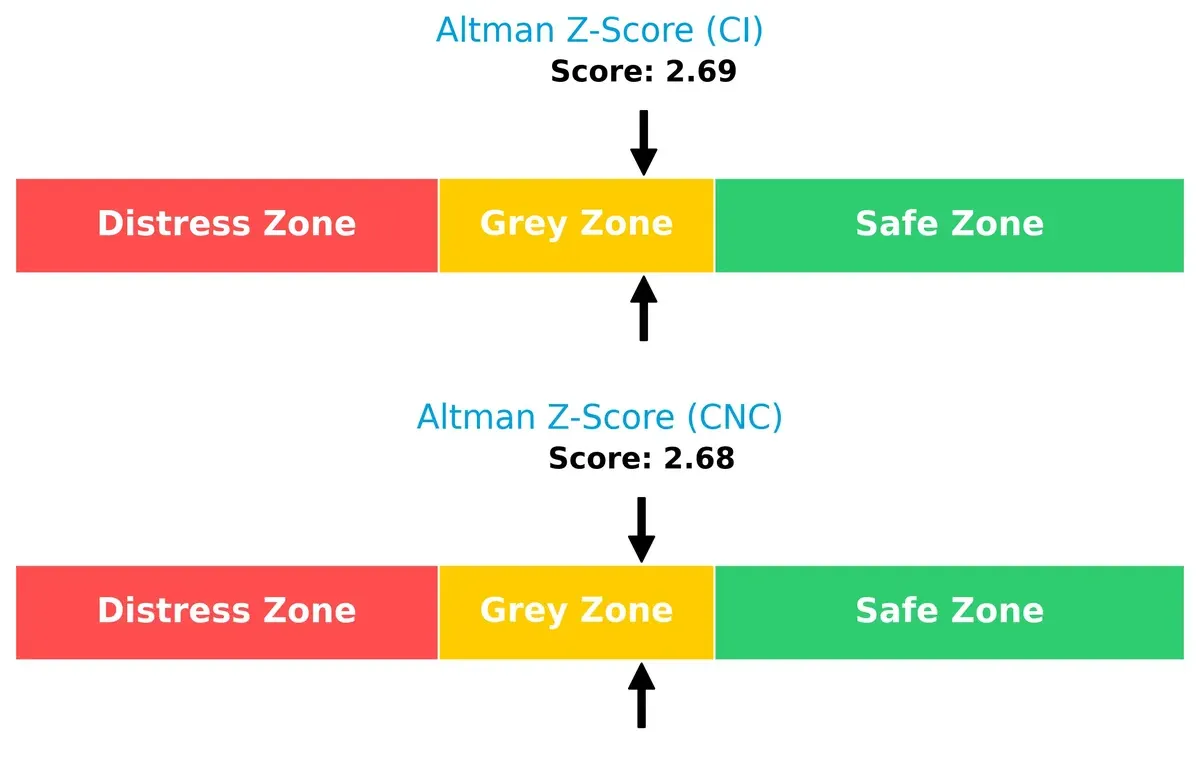
Bankruptcy Risk: Solvency Showdown
The Altman Z-Scores place Cigna at 2.69 and Centene at 2.68, both residing in the grey zone, indicating moderate bankruptcy risk in this economic cycle:
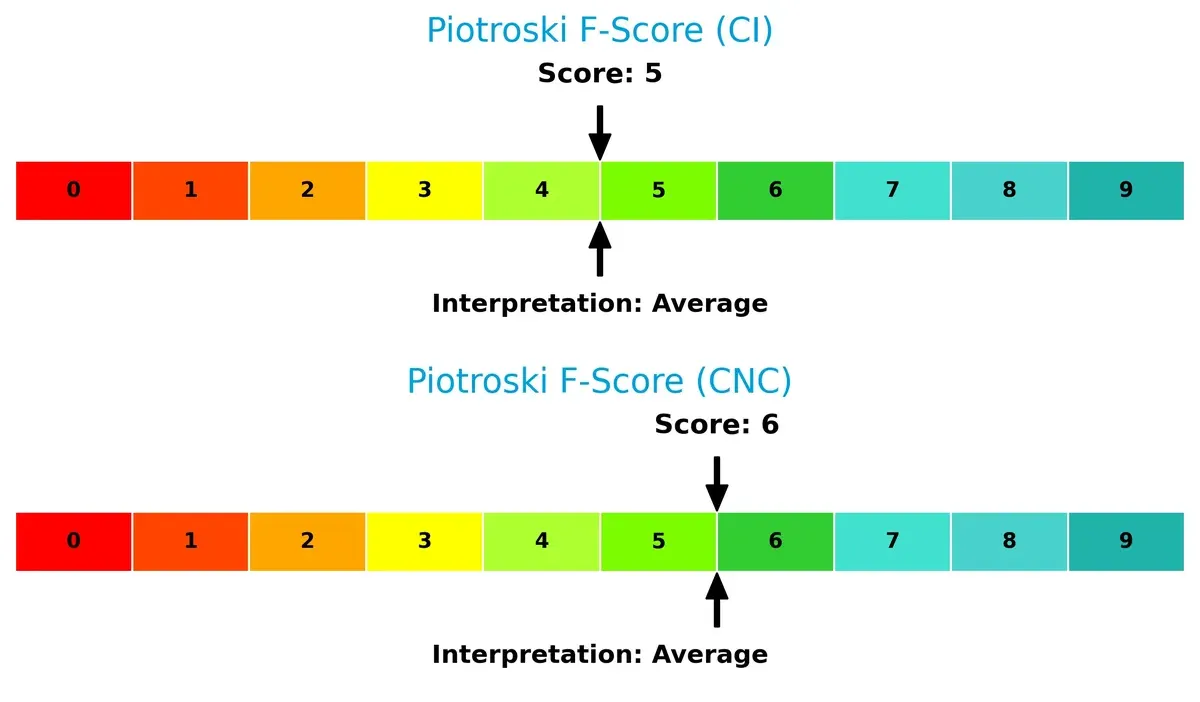
Financial Health: Quality of Operations
Cigna’s Piotroski F-Score of 5 and Centene’s score of 6 both signal average financial health, with Centene showing a slight edge but no major red flags for either firm:
How are the two companies positioned?
This section dissects the operational DNA of CI and CNC by comparing revenue distribution by segment and internal dynamics, including strengths and weaknesses. The goal is to confront their economic moats and identify which model offers the most resilient, sustainable advantage today.
Revenue Segmentation: The Strategic Mix
The visual comparison below dissects how Cigna Corporation and Centene Corporation diversify their income streams and where their primary sector bets lie:
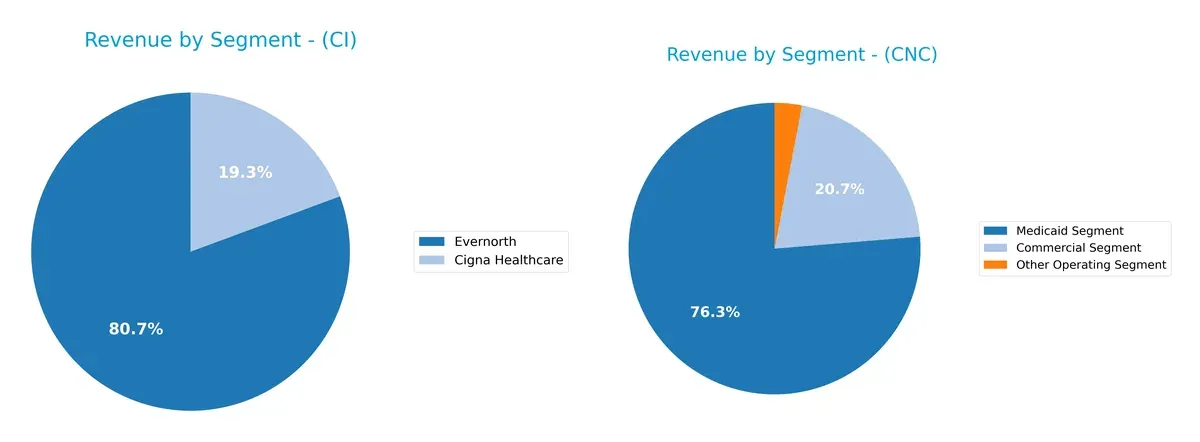
Cigna leans heavily on its Evernorth segment, with $198B in 2024, dwarfing its $47.5B Cigna Healthcare unit. Centene shows a more balanced split, anchoring $124B in Medicaid and $33.7B in Commercial. Cigna’s concentration in Evernorth signals infrastructure dominance but raises concentration risk. Centene’s mix pivots on Medicaid diversity, reducing reliance on any single segment and enhancing ecosystem lock-in.
Strengths and Weaknesses Comparison
This table compares the Strengths and Weaknesses of Cigna Corporation and Centene Corporation:
Cigna Corporation Strengths
- Favorable debt-to-assets ratio at 20.51%
- Strong interest coverage at 6.75
- High asset turnover of 1.59
- Diverse revenue streams including Evernorth and Cigna Healthcare
- Solid dividend yield at 2.02%
Centene Corporation Strengths
- Favorable weighted average cost of capital at 4.6%
- Higher asset turnover at 2.54
- Favorable price-to-book ratio at 1.01
- Favorable quick ratio at 1.1 indicating liquidity
- Diverse Medicaid and Commercial segments contributing over 150B in revenue
Cigna Corporation Weaknesses
- Low current ratio at 0.84 signals potential liquidity risk
- Unfavorable net margin at 1.39%
- Unfavorable return on equity at 8.37%
- Unfavorable quick ratio below 1 at 0.73
- Neutral to unfavorable profitability ratios
Centene Corporation Weaknesses
- Negative net margin at -3.43% indicates losses
- Negative return on equity at -33.44% and negative ROIC at -18.85%
- Negative interest coverage at -9.46 signals financial distress
- Zero dividend yield
- Higher debt-to-equity ratio at 0.87 compared to CI
Cigna demonstrates solid operational efficiency and financial stability with good asset utilization and manageable debt levels. Centene shows strengths in liquidity and segment diversification but faces significant profitability and financial risk challenges. Both companies have room to improve profitability metrics to enhance shareholder value.
The Moat Duel: Analyzing Competitive Defensibility
A structural moat is the only true shield protecting long-term profits from relentless competitive erosion. Let’s dissect how two healthcare giants defend their turf:
Cigna Corporation: Intangible Assets and Integrated Solutions Moat
Cigna leverages its integrated healthcare services and strong brand recognition to sustain high ROIC over WACC by 2%, signaling value creation. Its Evernorth segment deepens this moat by expanding care coordination and pharmacy benefits in 2026.
Centene Corporation: Cost Advantage and Government Program Focus
Centene’s moat relies on scale in government-subsidized programs, but a negative ROIC compared to WACC reveals value destruction and margin pressures. Its financial weakness contrasts sharply with Cigna’s stability, though Medicaid expansion offers growth opportunities.
Verdict: Integrated Care Ecosystem vs. Government Program Scale
Cigna’s growing ROIC and diversified service moat prove deeper and more sustainable than Centene’s shrinking returns and reliance on cost advantages. Cigna stands better poised to defend market share amid healthcare complexity.
Which stock offers better returns?
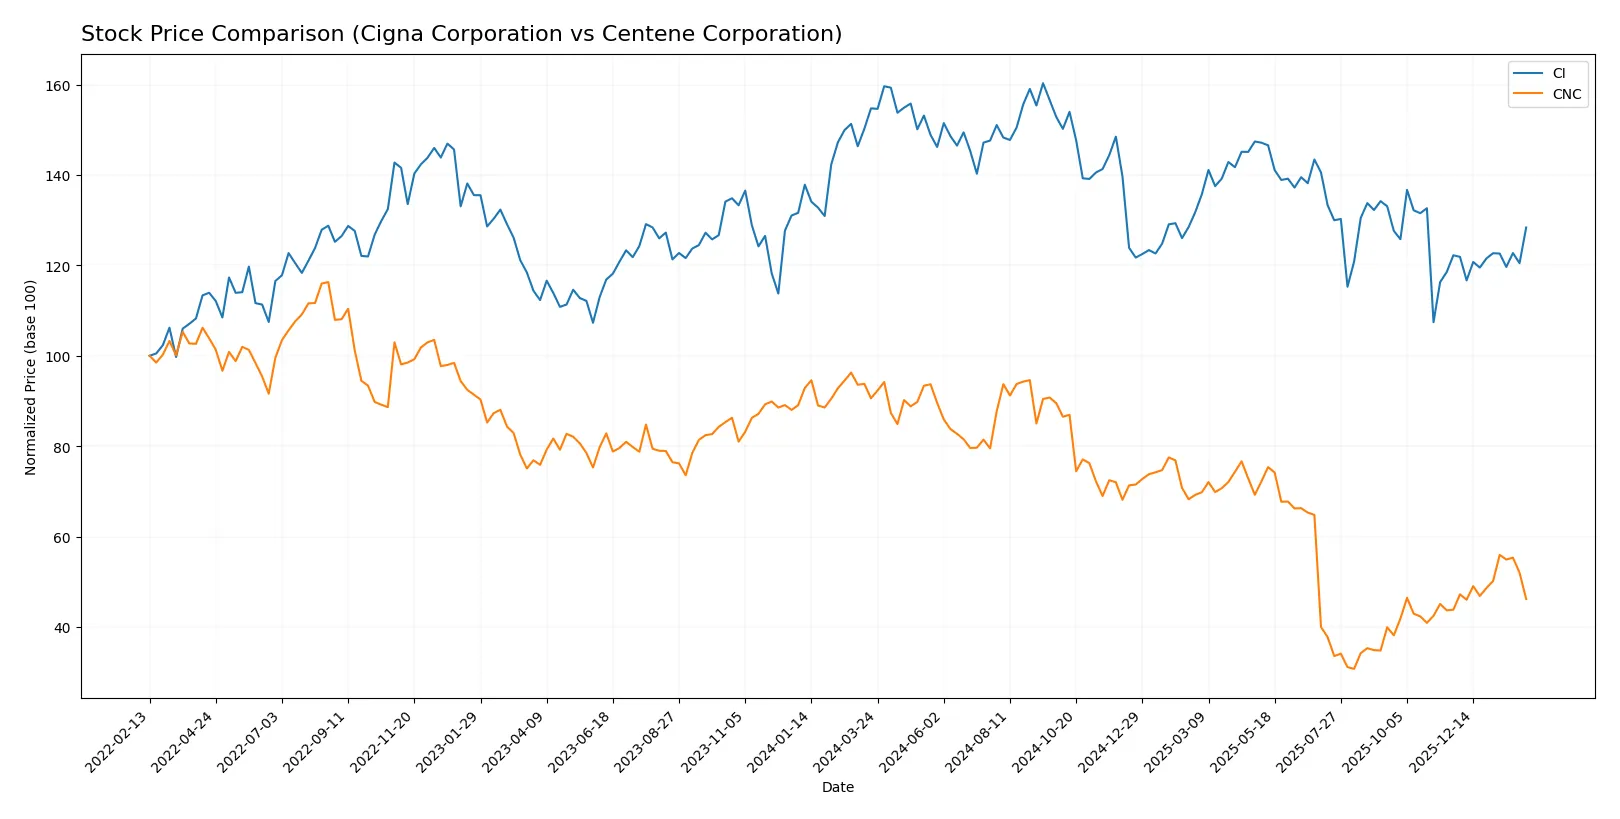
Over the past 12 months, both Cigna Corporation and Centene Corporation experienced sharp declines followed by recent modest recoveries, reflecting volatile trading dynamics and accelerating bearish trends.
Trend Comparison
Cigna Corporation’s stock fell 17.04% over the past year, marking a bearish trend with accelerating losses. The price fluctuated between $244.41 and $364.72, showing high volatility with a standard deviation of 28.52. Recently, it gained 5.02% with a moderate upward slope.
Centene Corporation’s stock declined 49.04% over the same period, also bearish with accelerating downward momentum. It traded between $25.59 and $78.83, exhibiting less volatility than Cigna (std dev 15.86). The recent 5.37% rise suggests a slight recovery phase.
Centene’s stock delivered the larger overall loss but a slightly stronger recent rebound. Between the two, Cigna showed less severe decline and higher volatility across the year.
Target Prices
Analysts present a clear target price consensus for both Cigna Corporation and Centene Corporation.
| Company | Target Low | Target High | Consensus |
|---|---|---|---|
| Cigna Corporation | 294 | 372 | 322.25 |
| Centene Corporation | 38 | 59 | 45.67 |
Cigna’s consensus target price of 322.25 implies a modest upside from the current 292.05, signaling confidence in its healthcare strategy. Centene’s target consensus at 45.67 also suggests potential growth beyond its current 38.46 price, reflecting optimism in managed care expansion.

Don’t Let Luck Decide Your Entry Point
Optimize your entry points with our advanced ProRealTime indicators. You’ll get efficient buy signals with precise price targets for maximum performance. Start outperforming now!
How do institutions grade them?
Cigna Corporation Grades
The following table shows recent grades assigned to Cigna Corporation by major grading firms.
| Grading Company | Action | New Grade | Date |
|---|---|---|---|
| RBC Capital | Maintain | Outperform | 2026-02-06 |
| Barclays | Maintain | Overweight | 2026-02-06 |
| Guggenheim | Maintain | Buy | 2026-02-06 |
| Guggenheim | Maintain | Buy | 2026-02-02 |
| Barclays | Maintain | Overweight | 2026-01-05 |
| Truist Securities | Maintain | Buy | 2026-01-05 |
| Bernstein | Maintain | Market Perform | 2025-11-12 |
| Wells Fargo | Maintain | Equal Weight | 2025-11-05 |
| Goldman Sachs | Maintain | Buy | 2025-11-04 |
| TD Cowen | Maintain | Buy | 2025-11-04 |
Centene Corporation Grades
Below are recent institutional grades for Centene Corporation from recognized grading firms.
| Grading Company | Action | New Grade | Date |
|---|---|---|---|
| Wells Fargo | Maintain | Equal Weight | 2026-01-07 |
| Barclays | Upgrade | Overweight | 2026-01-05 |
| Bernstein | Maintain | Outperform | 2025-11-21 |
| Wells Fargo | Maintain | Equal Weight | 2025-11-12 |
| JP Morgan | Maintain | Neutral | 2025-11-04 |
| Barclays | Maintain | Equal Weight | 2025-11-04 |
| TD Cowen | Maintain | Hold | 2025-10-31 |
| Goldman Sachs | Maintain | Sell | 2025-10-31 |
| UBS | Maintain | Neutral | 2025-10-30 |
| Cantor Fitzgerald | Maintain | Neutral | 2025-10-30 |
Which company has the best grades?
Cigna Corporation consistently earns buy and outperform ratings from multiple top firms. Centene receives a mixed range from sell to outperform but fewer strong buy signals. Investors may view Cigna’s grades as indicating stronger analyst confidence.
Risks specific to each company
The following categories identify the critical pressure points and systemic threats facing both firms in the 2026 market environment:
1. Market & Competition
Cigna Corporation
- Faces intense competition in diversified healthcare services with strong brand equity.
Centene Corporation
- Competes primarily in government-subsidized plans, facing pricing pressures and regulatory scrutiny.
2. Capital Structure & Debt
Cigna Corporation
- Maintains moderate leverage with favorable debt-to-assets and strong interest coverage.
Centene Corporation
- Higher debt levels with negative interest coverage signal elevated financial risk.
3. Stock Volatility
Cigna Corporation
- Exhibits low beta (0.28), indicating relative stock stability versus market volatility.
Centene Corporation
- Beta of 0.49 reflects higher stock price fluctuations and market sensitivity.
4. Regulatory & Legal
Cigna Corporation
- Subject to healthcare regulations but benefits from diversified product offerings.
Centene Corporation
- Heavy exposure to Medicaid and Medicare programs increases regulatory compliance risks.
5. Supply Chain & Operations
Cigna Corporation
- Integrated care delivery reduces operational disruptions and supply chain risks.
Centene Corporation
- Reliance on government contracts and outsourced services heightens operational complexity.
6. ESG & Climate Transition
Cigna Corporation
- Growing focus on sustainability initiatives, but limited disclosure on climate risks.
Centene Corporation
- ESG efforts improving, yet exposure to social determinants of health adds complexity.
7. Geopolitical Exposure
Cigna Corporation
- Primarily US-focused with limited international exposure, reducing geopolitical risks.
Centene Corporation
- US-centric operations with some state-level political risk due to Medicaid dependence.
Which company shows a better risk-adjusted profile?
Cigna’s strongest risk is its low liquidity ratios, which could constrain short-term maneuverability. Centene suffers from negative profitability and weak interest coverage, posing solvency concerns. Despite Centene’s higher leverage and volatility, Cigna’s low current and quick ratios signal a more immediate financial strain. Overall, Cigna offers a slightly better risk-adjusted profile due to more stable debt metrics and market position, while Centene’s deep profitability challenges remain a red flag.
Final Verdict: Which stock to choose?
Cigna Corporation’s superpower lies in its proven ability to create value through a sustainable competitive advantage. Its growing ROIC above WACC signals disciplined capital allocation and operational efficiency. The point of vigilance is its weaker liquidity position, which could pressure short-term flexibility. This stock suits investors targeting steady, value-driven growth.
Centene Corporation’s strategic moat centers on its market position and asset turnover, showing operational intensity despite current profitability challenges. It offers a comparatively stronger liquidity profile than Cigna, signaling better near-term financial safety. This stock fits investors willing to tolerate volatility for turnaround potential and deep value opportunities.
If you prioritize durable value creation and operational discipline, Cigna outshines with its consistent profitability and capital efficiency. However, if you seek a higher-risk, potential-reward scenario with a focus on liquidity and asset utilization, Centene offers better stability amid its restructuring. Both present distinct analytical scenarios for different investor appetites.
Disclaimer: Investment carries a risk of loss of initial capital. The past performance is not a reliable indicator of future results. Be sure to understand risks before making an investment decision.
Go Further
I encourage you to read the complete analyses of Cigna Corporation and Centene Corporation to enhance your investment decisions: