Cencora, Inc. (COR) and Henry Schein, Inc. (HSIC) are leading players in the medical distribution industry, serving diverse healthcare markets with innovative solutions. While Cencora focuses on pharmaceutical and biopharmaceutical distribution worldwide, Henry Schein specializes in dental and medical product supply alongside technology services. This comparison highlights their market approaches and innovation strategies to help you decide which company aligns best with your investment goals.
Table of contents
Companies Overview
I will begin the comparison between Cencora, Inc. and Henry Schein, Inc. by providing an overview of these two companies and their main differences.
Cencora Overview
Cencora, Inc. operates in the healthcare sector, focusing on sourcing and distributing pharmaceutical products both in the U.S. and internationally. The company’s diverse offerings include generic and injectable pharmaceuticals, vaccines, pharmacy management services, and supply management software, serving hospitals, pharmacies, and healthcare providers. Founded in 1871 and headquartered in Pennsylvania, Cencora is a major player with a market cap of 65B USD.
Henry Schein Overview
Henry Schein, Inc. also operates in the medical distribution industry, providing healthcare products and services primarily to dental and medical practitioners worldwide. Its segments include Health Care Distribution, offering dental and medical supplies, and Technology and Value-Added Services, which delivers practice management software and financial services. Founded in 1932 and based in New York, Henry Schein has a market cap of approximately 9.5B USD.
Key similarities and differences
Both companies specialize in healthcare product distribution and serve multiple healthcare providers, including dental and medical professionals. Cencora has a broader pharmaceutical and biopharmaceutical focus with extensive services in drug sourcing and logistics, while Henry Schein emphasizes dental products and technology-driven practice management solutions. Additionally, Cencora is significantly larger by market capitalization and employee count than Henry Schein.
Income Statement Comparison
The table below compares the most recent fiscal year income statement metrics for Cencora, Inc. and Henry Schein, Inc., highlighting key financial figures for investors’ evaluation.
| Metric | Cencora, Inc. (COR) | Henry Schein, Inc. (HSIC) |
|---|---|---|
| Market Cap | 65B | 9.5B |
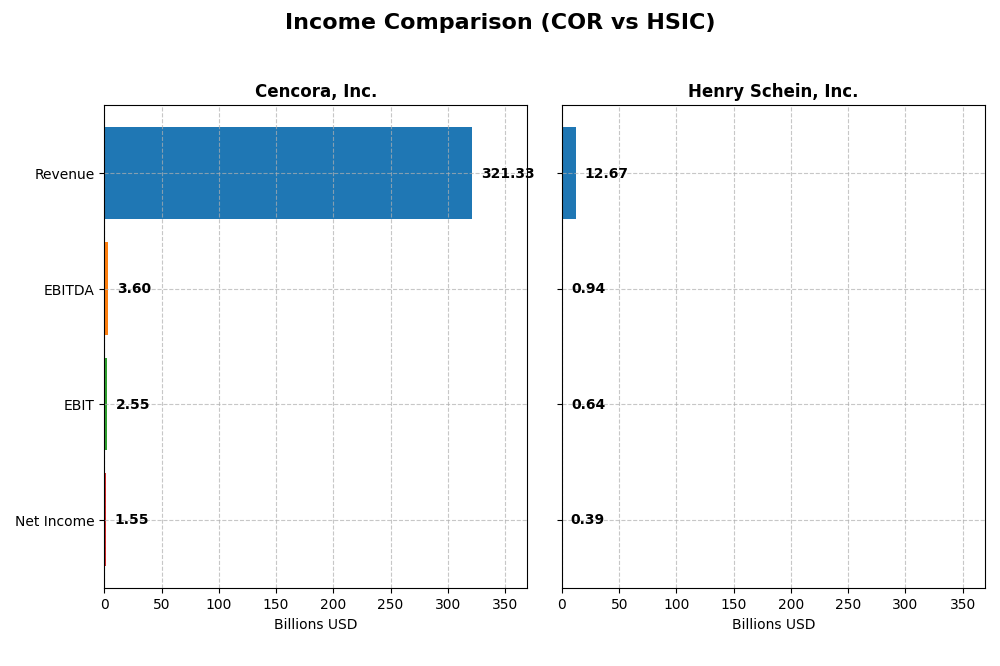
| Revenue | 321.3B | 12.7B |
| EBITDA | 3.6B | 941M |
| EBIT | 2.55B | 644M |
| Net Income | 1.55B | 390M |
| EPS | 8.02 | 3.07 |
| Fiscal Year | 2025 | 2024 |
Income Statement Interpretations
Cencora, Inc.
Cencora’s revenue grew significantly by 50.16% from 2021 to 2025, reaching $321B in 2025, while net income showed marginal growth of 0.92%, totaling $1.55B. Margins remained mostly stable, with a gross margin around 3.57% and a net margin of 0.48%. In 2025, revenue growth accelerated by 9.31%, gross profit rose 17.21%, but net margin declined by 5.79%, indicating pressure on profitability despite top-line expansion.
Henry Schein, Inc.
Henry Schein’s revenue increased by 25.24% over 2020-2024, reaching $12.67B in 2024, but net income decreased by 3.04% to $390M. Gross margin remained favorable at 29.71%, while net margin was neutral at 3.08%. The latest year showed slower revenue growth of 2.71%, slight gross profit improvement, but net margin fell 8.72%, with EPS declining by 3.48%, reflecting challenges in maintaining profitability.
Which one has the stronger fundamentals?
Cencora demonstrates stronger revenue growth and a favorable overall income statement evaluation, with stable margins and improved EPS despite a slight net margin dip. Henry Schein, while maintaining a higher gross margin, faces unfavorable trends in net income and margins with weaker recent growth. Overall, Cencora’s fundamentals appear more robust based on income statement metrics.
Financial Ratios Comparison
The following table compares the most recent financial ratios available for Cencora, Inc. (COR) and Henry Schein, Inc. (HSIC), highlighting key performance and financial health metrics for fiscal year 2025 for COR and fiscal year 2024 for HSIC.
| Ratios | Cencora, Inc. (COR) | Henry Schein, Inc. (HSIC) |
|---|---|---|
| ROE | 1.03 | 0.11 |
| ROIC | 9.66% | 6.73% |
| P/E | 38.98 | 22.89 |
| P/B | 40.17 | 2.63 |
| Current Ratio | 0.90 | 1.42 |
| Quick Ratio | 0.55 | 0.78 |
| D/E (Debt-to-Equity) | 5.08 | 0.85 |
| Debt-to-Assets | 10.00% | 28.09% |
| Interest Coverage | 9.02 | 5.56 |
| Asset Turnover | 4.20 | 1.24 |
| Fixed Asset Turnover | 126.56 | 15.38 |
| Payout Ratio | 28.12% | 0% |
| Dividend Yield | 0.72% | 0% |
Interpretation of the Ratios
Cencora, Inc.
Cencora’s ratios show a mix of strengths and weaknesses. While the company boasts a very strong return on equity at 103.06% and favorable asset turnover metrics, concerns arise from an unfavorable net margin of 0.48%, a low current ratio of 0.9, and high debt-to-equity at 5.08. Dividend yield is modest at 0.72%, with payouts supported but somewhat pressured by cash flow.
Henry Schein, Inc.
Henry Schein presents a more balanced ratio profile, with neutral returns on equity (11.49%) and invested capital (6.73%), alongside a favorable weighted average cost of capital at 6.91%. The company does not pay dividends, reflecting a strategic reinvestment focus or growth phase. Liquidity appears adequate with a neutral current ratio of 1.42, though the quick ratio is slightly unfavorable at 0.78.
Which one has the best ratios?
Henry Schein holds a slightly favorable overall ratio assessment, benefiting from a balanced capital structure and neutral profitability measures, whereas Cencora experiences a slightly unfavorable rating due to liquidity issues and valuation concerns despite strong equity returns. Thus, Henry Schein appears to have more stable and consistent financial ratios in the latest fiscal periods.
Strategic Positioning
This section compares the strategic positioning of Cencora, Inc. and Henry Schein, Inc. including Market position, Key segments, and disruption:
Cencora, Inc.
- Leading pharmaceutical distributor with large scale, facing moderate competitive pressure in the medical distribution sector.
- Diversified segments including pharmaceutical distribution, commercialization services, animal health, and consulting.
- Exposure to technological disruption via software solutions and logistics for biopharmaceuticals, supporting healthcare providers.
Henry Schein, Inc.
- Smaller healthcare products and services distributor focused on dental and medical practitioners globally.
- Concentrated on healthcare distribution and technology services, targeting dental and medical markets.
- Exposure through technology and value-added services, including practice management software and consulting.
Cencora, Inc. vs Henry Schein, Inc. Positioning
Cencora pursues a diversified strategy across pharmaceuticals, animal health, and services, offering broad market coverage. Henry Schein focuses on a more concentrated approach in healthcare distribution and technology services, targeting niches like dental and medical practitioners.
Which has the best competitive advantage?
Cencora shows a slightly favorable moat with positive value creation despite declining profitability. Henry Schein exhibits a very unfavorable moat, shedding value with declining returns on invested capital, indicating weaker competitive advantage.
Stock Comparison
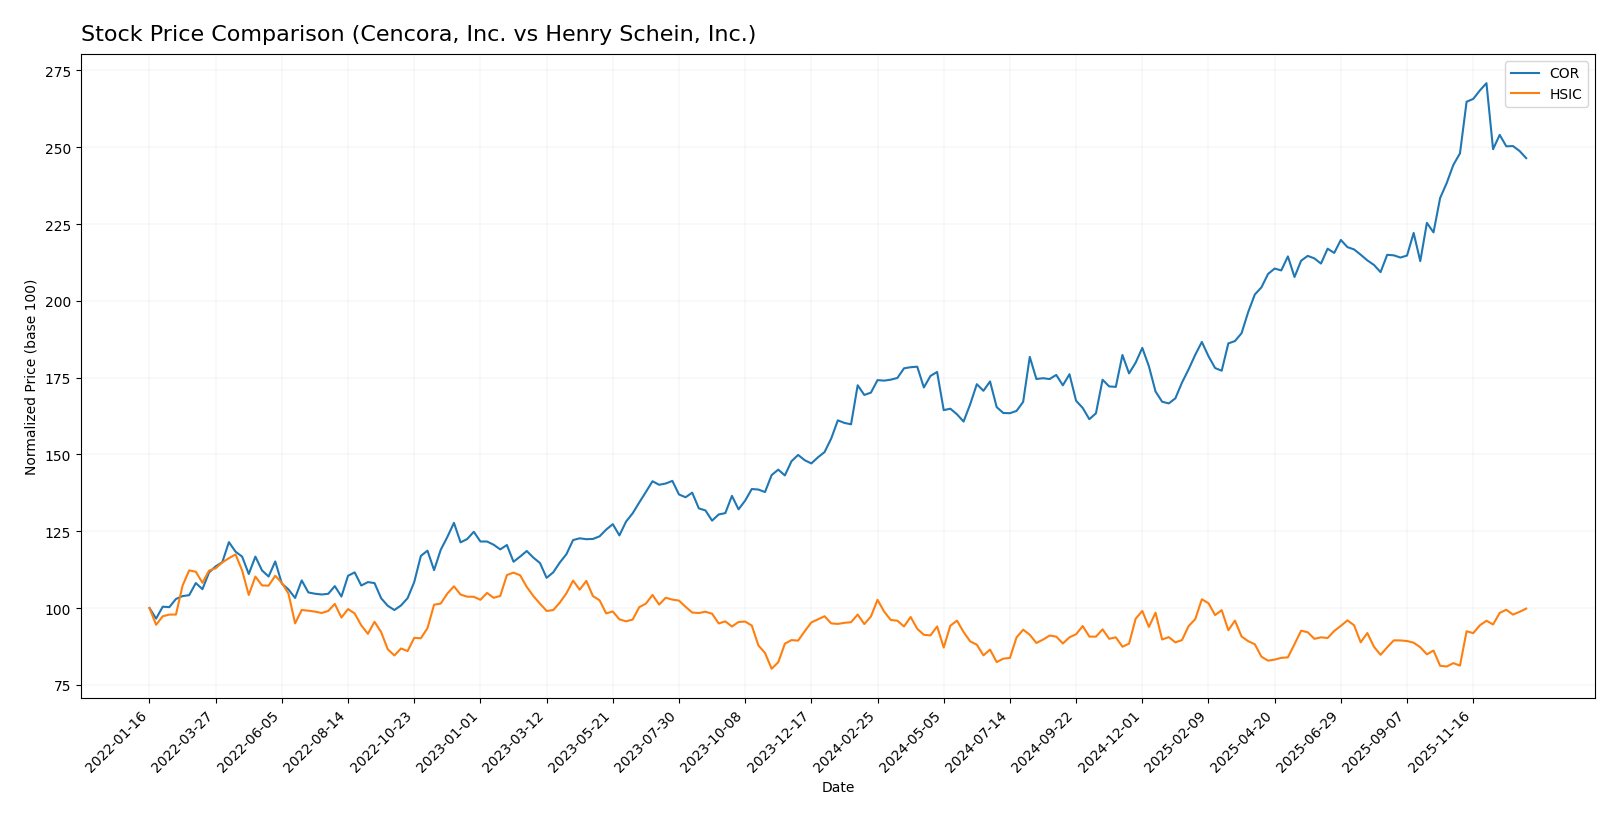
The stock price movements of Cencora, Inc. and Henry Schein, Inc. over the past 12 months reveal distinct bullish trends, with Cencora showing a strong overall gain and Henry Schein accelerating more recently in its price appreciation.
Trend Analysis
Cencora, Inc. experienced a 44.87% price increase over the past year, indicating a bullish trend with deceleration in momentum. The stock ranged between 218.89 and 368.93, showing high volatility with a standard deviation of 40.3.
Henry Schein, Inc. recorded a 2.63% price increase over 12 months, also bullish but less pronounced. The trend is accelerating with recent gains of 21.62% and lower volatility, standard deviation at 3.92, trading between 62.98 and 80.0.
Comparing both, Cencora has delivered the highest market performance with a substantially larger overall gain, despite Henry Schein’s recent acceleration in price growth.
Target Prices
Analysts present a solid consensus on target prices for Cencora, Inc. and Henry Schein, Inc., indicating potential upside from current levels.
| Company | Target High | Target Low | Consensus |
|---|---|---|---|
| Cencora, Inc. | 415 | 330 | 375.86 |
| Henry Schein, Inc. | 90 | 75 | 82.5 |
The consensus target prices suggest moderate upside potential, with Cencora’s target consensus about 12% above its current price of $335.69, and Henry Schein’s about 6% above its current price of $77.64. Analysts expect steady performance in these healthcare distribution companies.
Analyst Opinions Comparison
This section compares analysts’ ratings and grades for Cencora, Inc. (COR) and Henry Schein, Inc. (HSIC):
Rating Comparison
COR Rating
- Rating: B, regarded as Very Favorable overall.
- Discounted Cash Flow Score: 5, indicating a Very Favorable valuation outlook.
- ROE Score: 5, showing very efficient profit generation from equity.
- ROA Score: 3, reflecting moderate asset utilization efficiency.
- Debt To Equity Score: 1, considered Very Unfavorable due to higher financial risk.
HSIC Rating
- Rating: B, regarded as Very Favorable overall.
- Discounted Cash Flow Score: 4, indicating a Favorable valuation outlook.
- ROE Score: 4, showing favorable profit generation from equity.
- ROA Score: 3, reflecting moderate asset utilization efficiency.
- Debt To Equity Score: 1, also Very Unfavorable indicating similar financial risk.
Which one is the best rated?
Both COR and HSIC share the same overall rating of B and moderate overall scores. COR has higher scores in discounted cash flow and ROE, while HSIC’s scores are slightly lower in these areas. Both face similar concerns regarding debt-to-equity risk.
Scores Comparison
The scores comparison between Cencora, Inc. and Henry Schein, Inc. highlights their financial stability and strength evaluations:
COR Scores
- Altman Z-Score: 4.87, indicating a safe zone with low bankruptcy risk.
- Piotroski Score: 7, reflecting strong financial health.
HSIC Scores
- Altman Z-Score: 2.82, placing the company in the grey zone with moderate risk.
- Piotroski Score: 6, considered average financial strength.
Which company has the best scores?
Based strictly on the provided data, Cencora, Inc. has better scores with a higher Altman Z-Score in the safe zone and a stronger Piotroski Score compared to Henry Schein, Inc., which is in the grey zone with average Piotroski results.
Grades Comparison
The following section presents a comparison of the recent grades awarded to Cencora, Inc. and Henry Schein, Inc. by established grading companies:
Cencora, Inc. Grades
This table summarizes the latest grades from recognized financial institutions for Cencora, Inc.:
| Grading Company | Action | New Grade | Date |
|---|---|---|---|
| B of A Securities | Maintain | Neutral | 2026-01-05 |
| Wells Fargo | Maintain | Overweight | 2025-11-11 |
| JP Morgan | Maintain | Overweight | 2025-11-11 |
| TD Cowen | Maintain | Buy | 2025-11-10 |
| UBS | Maintain | Buy | 2025-11-07 |
| Baird | Maintain | Outperform | 2025-11-06 |
| Mizuho | Maintain | Outperform | 2025-11-06 |
| Mizuho | Maintain | Outperform | 2025-10-30 |
| UBS | Maintain | Buy | 2025-10-27 |
| Mizuho | Maintain | Outperform | 2025-10-16 |
Overall, Cencora, Inc. has a predominantly positive rating trend, with most actions maintaining Buy, Overweight, or Outperform grades.
Henry Schein, Inc. Grades
The table below details the recent grades assigned to Henry Schein, Inc. by reputable grading companies:
| Grading Company | Action | New Grade | Date |
|---|---|---|---|
| Morgan Stanley | Maintain | Underweight | 2025-11-05 |
| Barrington Research | Maintain | Outperform | 2025-11-05 |
| JP Morgan | Maintain | Overweight | 2025-11-05 |
| Evercore ISI Group | Maintain | Outperform | 2025-11-05 |
| Wells Fargo | Maintain | Equal Weight | 2025-11-05 |
| Barrington Research | Maintain | Outperform | 2025-10-22 |
| Barrington Research | Maintain | Outperform | 2025-09-23 |
| Evercore ISI Group | Upgrade | Outperform | 2025-08-26 |
| JP Morgan | Maintain | Overweight | 2025-08-07 |
| UBS | Maintain | Neutral | 2025-08-06 |
Henry Schein, Inc.’s grades show a mixed pattern, ranging from Underweight to Outperform, with several Maintain actions and one recent upgrade.
Which company has the best grades?
Cencora, Inc. has received generally stronger and more consistent positive grades, including multiple Buy and Outperform ratings, compared to Henry Schein, Inc., whose ratings vary more widely. This disparity may influence investors’ risk assessments and portfolio strategies differently.
Strengths and Weaknesses
The table below compares key strengths and weaknesses of Cencora, Inc. (COR) and Henry Schein, Inc. (HSIC) based on recent financial and operational data.
| Criterion | Cencora, Inc. (COR) | Henry Schein, Inc. (HSIC) |
|---|---|---|
| Diversification | Highly diversified with pharmaceutical distribution as core, plus global commercialization and animal health segments | Moderate diversification, mostly healthcare distribution with some technology segment |
| Profitability | Creating value (ROIC > WACC by 3.2%), but profitability is declining; net margin very low at 0.48% | Shedding value (ROIC < WACC by 0.18%), declining profitability; net margin better than COR but still low at 3.08% |
| Innovation | Neutral ROIC trend suggests limited recent innovation impact | Very unfavorable ROIC trend indicates challenges in innovation or operational efficiency |
| Global presence | Strong global reach, especially in pharmaceutical distribution with revenues over 198B USD | More regional presence focused on healthcare distribution, revenues around 12.7B USD in healthcare segment |
| Market Share | Dominant player in pharmaceutical distribution with extensive scale | Smaller market share, focused on healthcare distribution and technology |
In summary, Cencora shows strong scale and value creation despite declining profitability, while Henry Schein faces profitability challenges and a shrinking economic moat. Investors should weigh COR’s size and stable value creation against HSIC’s need for strategic improvements.
Risk Analysis
Below is a comparison of key risks for Cencora, Inc. (COR) and Henry Schein, Inc. (HSIC) based on the most recent data from 2025 and 2024 respectively:
| Metric | Cencora, Inc. (COR) | Henry Schein, Inc. (HSIC) |
|---|---|---|
| Market Risk | Beta 0.665 (lower volatility) | Beta 0.884 (moderate volatility) |
| Debt Level | High debt-to-equity 5.08 (unfavorable) | Moderate debt-to-equity 0.85 (neutral) |
| Regulatory Risk | High, given pharmaceutical distribution | Moderate, dental/medical product regulations |
| Operational Risk | Complex global supply chains, 47K employees | Diverse healthcare products, 25K employees |
| Environmental Risk | Moderate, pharmaceutical logistics impact | Moderate, medical product manufacturing impact |
| Geopolitical Risk | Exposure to international markets | Less international exposure, mainly US |
Cencora’s most significant risks stem from its high leverage and complex regulatory environment, which could impact operational efficiency and financial stability despite a strong Altman Z-Score indicating low bankruptcy risk. Henry Schein faces moderate market volatility and operational risks but shows a more balanced debt profile and moderate financial health, though its Altman score suggests caution with some bankruptcy risk. Investors should weigh Cencora’s leverage and regulatory exposure against Henry Schein’s operational scale and market sensitivity.
Which Stock to Choose?
Cencora, Inc. (COR) shows favorable income growth with a 50.16% revenue increase over five years and a moderate net margin of 0.48%. Its financial ratios are slightly unfavorable overall, despite strong ROE (103%) and WACC (6.46%), with high debt-to-equity and low liquidity ratios. The company is creating value with a slightly favorable moat rating and a very favorable overall rating.
Henry Schein, Inc. (HSIC) exhibits moderate income growth with a 25.24% revenue increase and a higher gross margin of 29.71%, but net margin and EPS growth are unfavorable. Its financial ratios are slightly favorable overall, with moderate ROE (11.49%), neutral debt-to-equity, and better liquidity. The company is shedding value with a very unfavorable moat rating, yet maintains a very favorable overall rating.
Investors focused on growth might find COR’s strong income growth and value creation signals appealing, while those prioritizing financial stability and more balanced ratios could view HSIC’s profile as more favorable despite its declining profitability. The choice could depend on an investor’s risk tolerance and strategy emphasis.
Disclaimer: Investment carries a risk of loss of initial capital. The past performance is not a reliable indicator of future results. Be sure to understand risks before making an investment decision.
Go Further
I encourage you to read the complete analyses of Cencora, Inc. and Henry Schein, Inc. to enhance your investment decisions: