Home > Comparison > Technology > CLS vs TRMB
The strategic rivalry between Celestica Inc. and Trimble Inc. shapes the evolving landscape of technology hardware and solutions. Celestica operates as a capital-intensive manufacturer and supply chain integrator, while Trimble focuses on high-margin, software-driven precision solutions across construction, agriculture, and transportation. This analysis pits manufacturing scale against technological specialization to identify which trajectory delivers superior risk-adjusted returns for diversified portfolios in today’s competitive environment.

Table of contents
Companies Overview
Celestica Inc. and Trimble Inc. shape critical segments of the hardware and technology equipment landscape with distinct market focuses.
Celestica Inc.: Hardware and Supply Chain Powerhouse
Celestica commands the hardware manufacturing and supply chain services market with a $32.3B market cap. It generates revenue by designing, engineering, and assembling complex electronic products across multiple industries. In 2026, Celestica emphasizes expanding its Advanced Technology and Connectivity & Cloud Solutions, targeting aerospace, defense, and hyperscalers for diversified growth.
Trimble Inc.: Precision Technology Innovator
Trimble operates at the intersection of technology solutions and field automation with a $16.1B market cap. Its core income stems from software and systems for construction, agriculture, geospatial, and transportation sectors. The company’s strategic thrust in 2026 focuses on integrating advanced mobility, asset management, and autonomous systems to enhance workflow efficiency globally.
Strategic Collision: Similarities & Divergences
Celestica and Trimble both thrive in hardware and technology but diverge sharply in approach: Celestica offers a broad contract manufacturing ecosystem, while Trimble builds proprietary software-driven precision solutions. Their battleground lies in delivering integrated, scalable services to capital-intensive industries. This contrast defines distinct investment profiles—Celestica as a supply chain enabler, Trimble as a technology innovator.
Income Statement Comparison
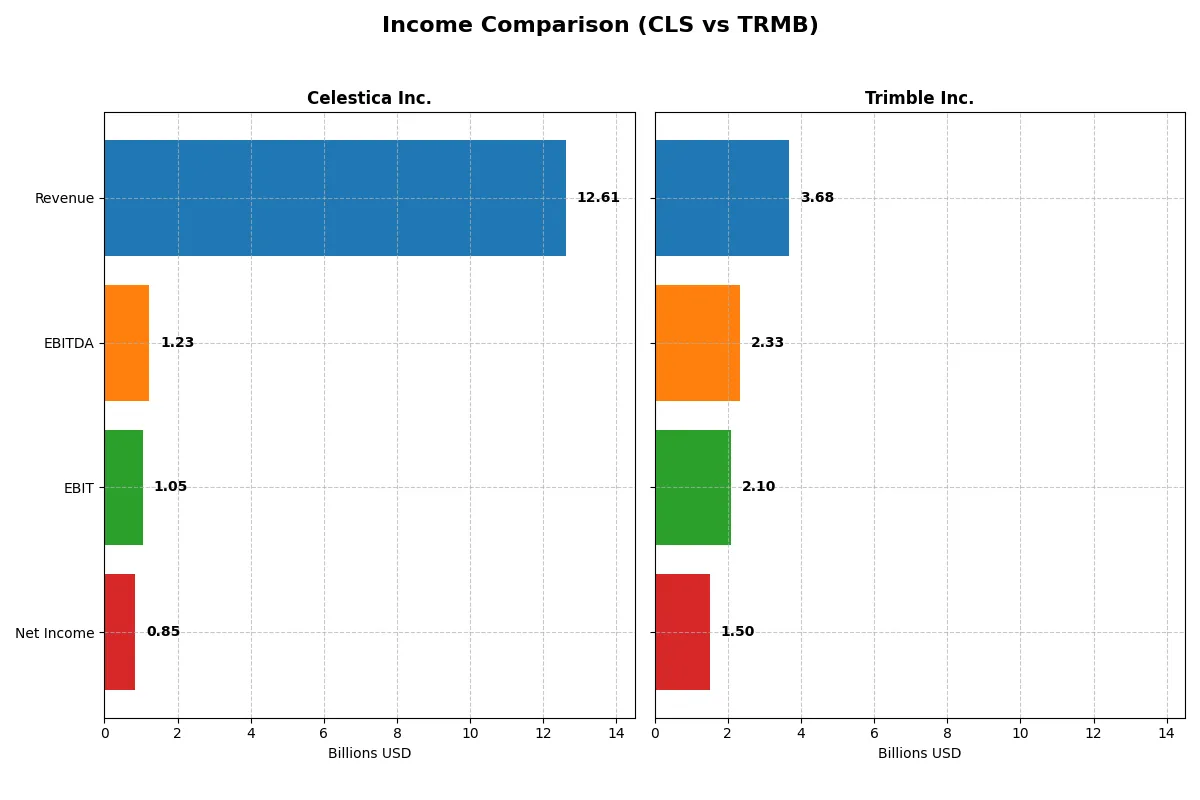
This data dissects the core profitability and scalability of both corporate engines to reveal who dominates the bottom line:
| Metric | Celestica Inc. (CLS) | Trimble Inc. (TRMB) |
|---|---|---|
| Revenue | 12.6B | 3.7B |
| Cost of Revenue | 11.1B | 1.3B |
| Operating Expenses | 385M | 1.9B |
| Gross Profit | 1.5B | 2.4B |
| EBITDA | 1.2B | 2.3B |
| EBIT | 1.1B | 2.1B |
| Interest Expense | 54M | 91M |
| Net Income | 847M | 1.5B |
| EPS | 7.22 | 6.13 |
| Fiscal Year | 2025 | 2024 |
Income Statement Analysis: The Bottom-Line Duel
This income statement comparison reveals which company drives greater efficiency and profitability in their business models.
Celestica Inc. Analysis
Celestica’s revenue surged from 5.6B in 2021 to 12.6B in 2025, with net income rising sharply to 847M. Gross margins hover around 11.7%, reflecting tight cost control in a competitive sector. The 2025 results show strong momentum, with an 80% EBIT growth and net margin expanding to 6.7%, highlighting improved operational leverage.
Trimble Inc. Analysis
Trimble’s revenue peaked at 3.8B in 2023 but declined slightly to 3.7B in 2024, with net income rebounding impressively to 1.5B in 2024. The company maintains robust gross margins above 65%, signaling powerful pricing power. Despite a 3% revenue dip, EBIT and net margins soared over 300%, fueled by disciplined expense management and operational efficiency gains.
Margin Power vs. Revenue Scale
Celestica demonstrates superior revenue growth and a consistent climb in net income, though with modest margins typical of its sector. Trimble excels with exceptional profitability and margin expansion but faces recent revenue softness. For investors, Celestica offers growth momentum, while Trimble presents a high-margin profile with strong earnings resilience.
Financial Ratios Comparison
These vital ratios act as a diagnostic tool to expose underlying fiscal health, valuation premiums, and capital efficiency of the companies compared below:
| Ratios | Celestica Inc. (CLS) | Trimble Inc. (TRMB) |
|---|---|---|
| ROE | 22.57% | 26.18% |
| ROIC | 16.10% | 4.49% |
| P/E | 25.47 | 11.52 |
| P/B | 5.75 | 3.02 |
| Current Ratio | 1.49 | 1.27 |
| Quick Ratio | 0.91 | 1.16 |
| D/E | 0.42 | 0.26 |
| Debt-to-Assets | 13.30% | 15.96% |
| Interest Coverage | 11.50x | 5.08x |
| Asset Turnover | 1.61 | 0.39 |
| Fixed Asset Turnover | 14.58 | 11.81 |
| Payout Ratio | 0 | 0 |
| Dividend Yield | 0 | 0 |
| Fiscal Year | 2024 | 2024 |
Efficiency & Valuation Duel: The Vital Signs
Ratios serve as a company’s DNA, revealing hidden risks and operational excellence that raw numbers alone cannot capture.
Celestica Inc.
Celestica’s return on equity stands strong at 22.57%, signaling solid profitability despite a modest net margin of 4.44%. The stock trades at a stretched P/E of 25.47 and a high P/B of 5.75, suggesting premium valuation. It pays no dividend, likely reinvesting in growth initiatives. Debt levels remain conservative, supporting financial stability.
Trimble Inc.
Trimble excels with a robust net margin of 40.84% and an even higher ROE of 26.18%. Its P/E ratio of 11.52 implies an attractive valuation relative to earnings. However, a lower asset turnover of 0.39 signals operational inefficiency. The company also pays no dividend, channeling capital into R&D and innovation. Debt metrics remain manageable and interest coverage is strong.
Premium Valuation vs. Operational Safety
Trimble offers a more favorable valuation and superior profitability but struggles with asset efficiency. Celestica shows solid profitability and stronger asset turnover but carries a stretched valuation. Investors seeking growth with operational discipline may prefer Celestica’s profile, while those favoring margin strength and valuation might lean toward Trimble.
Which one offers the Superior Shareholder Reward?
Celestica Inc. (CLS) and Trimble Inc. (TRMB) both eschew dividends, instead focusing on buybacks and reinvestment. CLS maintains no dividend payout with zero yield, channeling free cash flow (2.57/share in 2024) into modest buybacks amid improving margins. TRMB also pays no dividends but boasts higher net income per share (6.13 in 2024) and stronger free cash flow coverage (0.94 FCF/OCF ratio). Trimble’s buyback intensity is more pronounced, supported by a robust operating cash flow margin (14.4%) versus CLS’s 4.9%. TRMB’s capital allocation favors long-term value through R&D and selective buybacks, while CLS emphasizes stable cash flow and cautious leverage. I find Trimble’s model delivers superior total shareholder return potential in 2026, driven by sustainable buybacks and higher profitability despite a higher valuation multiple.
Comparative Score Analysis: The Strategic Profile
The radar chart reveals the fundamental DNA and trade-offs of both firms, highlighting their financial strengths and valuation challenges:
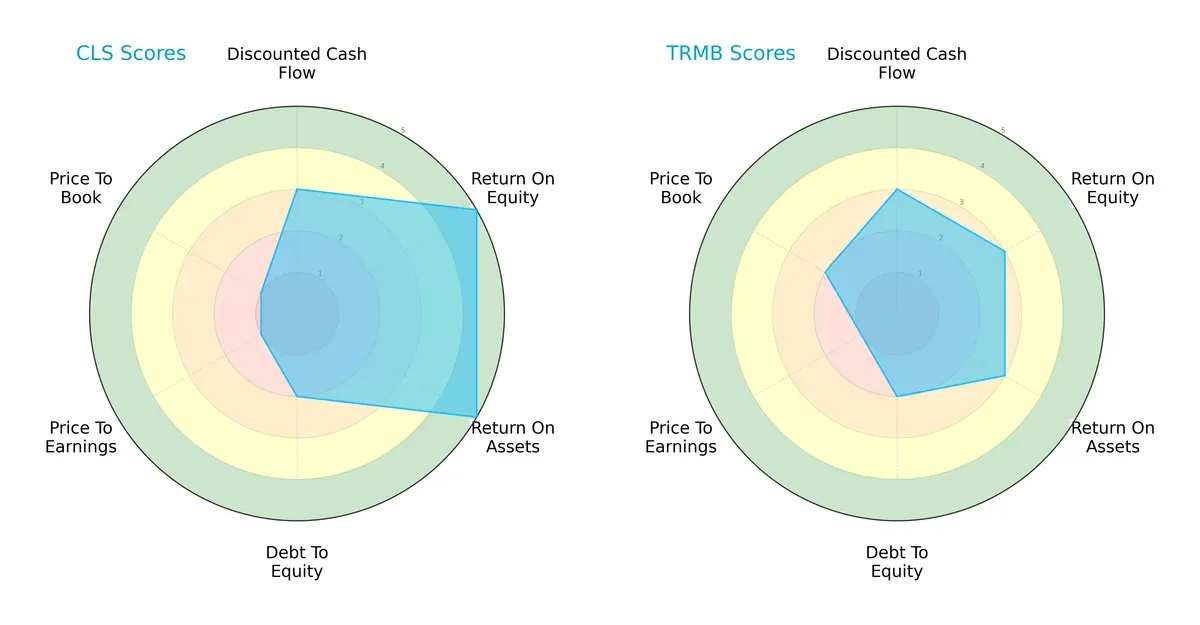
Celestica Inc. (CLS) leads with superior profitability metrics, scoring 5 in ROE and ROA, compared to Trimble Inc.’s (TRMB) moderate scores of 3. Both firms share moderate debt-to-equity risk at 2, but CLS’s valuation metrics (P/E and P/B scores at 1) indicate significant market undervaluation. TRMB displays a more balanced profile across metrics, while CLS relies heavily on operational efficiency amid valuation concerns.
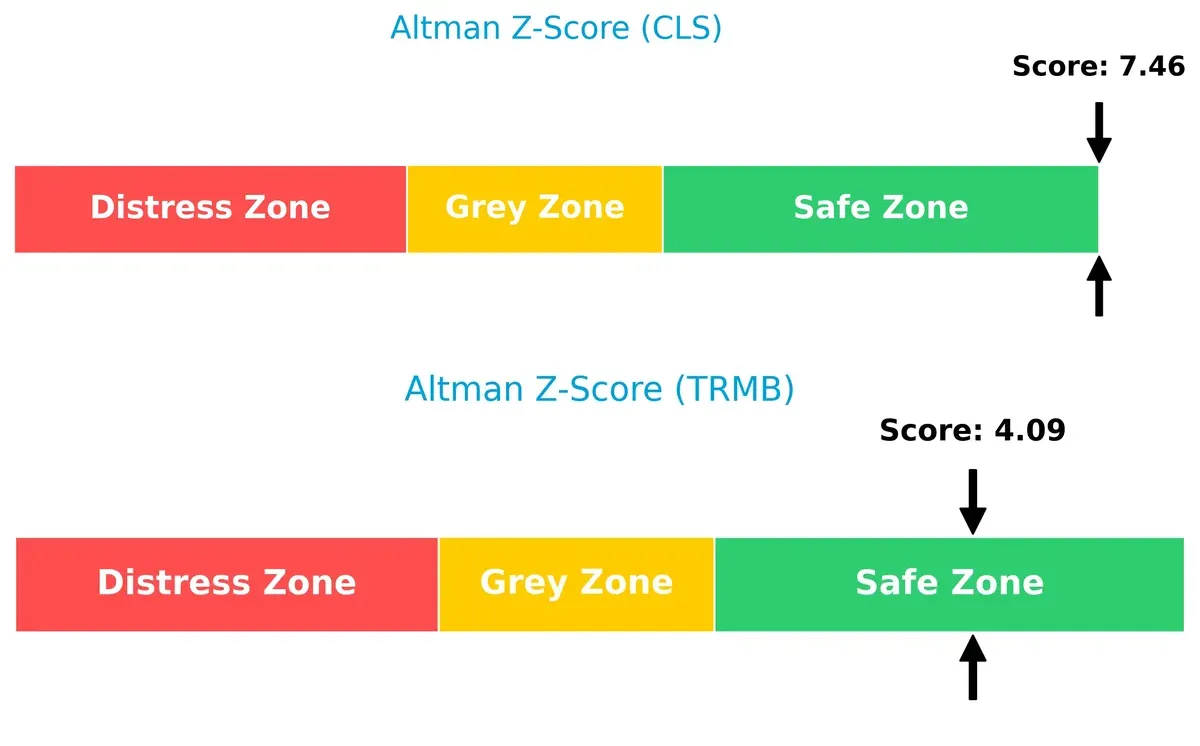
Bankruptcy Risk: Solvency Showdown
The Altman Z-Score difference suggests both companies maintain strong solvency, but CLS’s 7.46 far exceeds TRMB’s 4.09, indicating greater financial safety in this cycle:
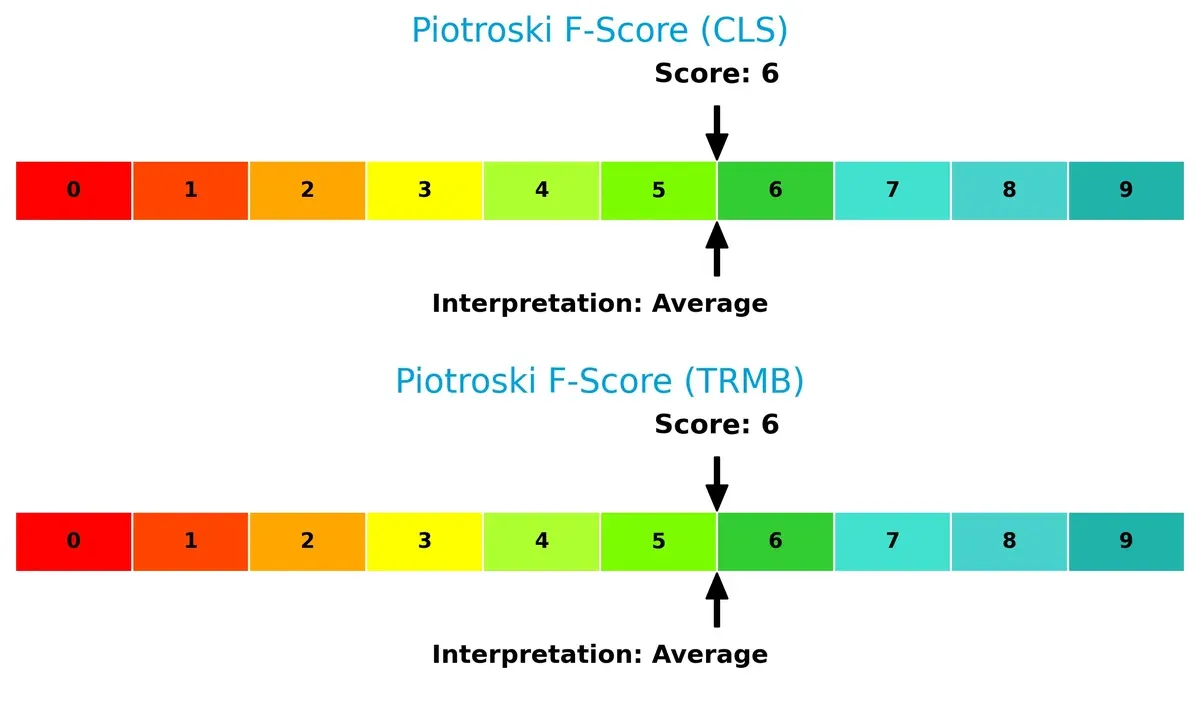
Financial Health: Quality of Operations
Both CLS and TRMB score a 6 on the Piotroski F-Score, signaling average operational quality without glaring red flags in internal financial metrics:
How are the two companies positioned?
This section dissects the operational DNA of Celestica and Trimble by comparing revenue distribution by segment and internal strengths and weaknesses. The goal: to confront their economic moats and identify which model offers the most resilient, sustainable advantage today.
Revenue Segmentation: The Strategic Mix
This visual comparison dissects how Celestica Inc. and Trimble Inc. diversify their income streams and reveals their primary sector bets:
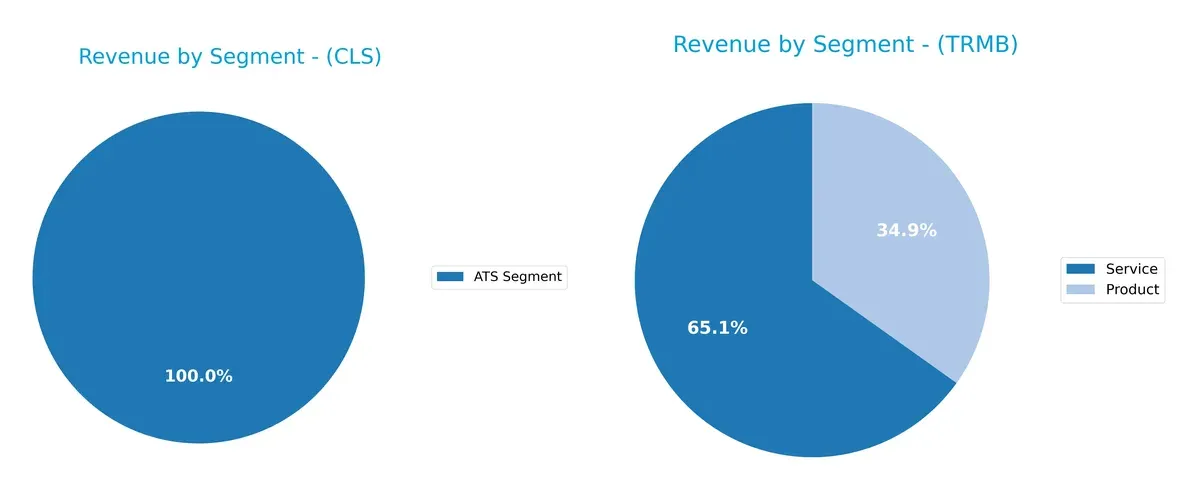
Celestica leans heavily on its ATS Segment with $3.16B, showing a concentrated revenue base. In contrast, Trimble splits $1.28B in Product and $2.40B in Service segments, reflecting a more balanced and diversified mix. Trimble’s dual focus reduces concentration risk and supports ecosystem lock-in via services, while Celestica’s reliance on ATS signals exposure to that single market’s cycles.
Strengths and Weaknesses Comparison
This table compares the strengths and weaknesses of Celestica Inc. and Trimble Inc.:
Celestica Inc. Strengths
- Favorable return on equity of 22.57%
- Low debt-to-equity ratio at 0.42
- Strong interest coverage at 19.69
- High asset turnover at 1.61
- Diverse revenue from ATS segment valued at $3.16B
Trimble Inc. Strengths
- Strong net margin of 40.84%
- Favorable return on equity at 26.18%
- High interest coverage at 23.12
- Diverse revenue streams from product and service segments totaling $3.68B
- Established global presence across North America, Europe, Asia Pacific, and Rest of World
Celestica Inc. Weaknesses
- Low net margin at 4.44%
- Unfavorable P/E at 25.47 and high P/B at 5.75
- Unavailable ROIC and WACC metrics hinder capital efficiency assessment
- No dividend yield
Trimble Inc. Weaknesses
- Unfavorable ROIC at 4.49% and WACC at 10.78% indicate weaker capital efficiency
- Unfavorable price-to-book at 3.02
- Lower asset turnover at 0.39
- No dividend yield
Both companies show solid profitability through ROE and manageable debt levels. Trimble’s diverse product and geographic reach underpin its stronger net margin and favorable P/E ratio. Celestica’s higher asset turnover contrasts with weaker profit margins and missing capital efficiency data. These dynamics highlight differing strategic focuses and financial profiles.
The Moat Duel: Analyzing Competitive Defensibility
A structural moat is the only reliable shield protecting long-term profits from relentless competition erosion. Let’s dissect the moats of Celestica Inc. and Trimble Inc.:
Celestica Inc.: Supply Chain Integration Moat
Celestica’s competitive edge stems from deep supply chain capabilities and advanced manufacturing. This manifests in solid margin stability and rapid revenue growth of 124% over five years. Expansion into cloud and connectivity markets in 2026 could further widen its moat.
Trimble Inc.: Technology Ecosystem Moat
Trimble leans on software-driven solutions and integrated hardware, creating high switching costs unlike Celestica’s manufacturing moat. Despite a recent revenue dip, its 65% gross margin and strong EBIT growth signal robust competitive positioning. Growth in geospatial and transportation tech offers new moat-deepening avenues.
Supply Chain Integration vs. Technology Ecosystem: The Moat Verdict
Celestica’s moat benefits from accelerating ROIC trends and scaling revenues, while Trimble struggles with declining ROIC and value destruction. I see Celestica’s supply chain integration as the deeper moat, better poised to defend market share amid intensifying sector competition.
Which stock offers better returns?
The past year shows Celestica Inc. surging with a strong overall gain but recent deceleration, while Trimble Inc. records modest growth with a similar recent decline in momentum.
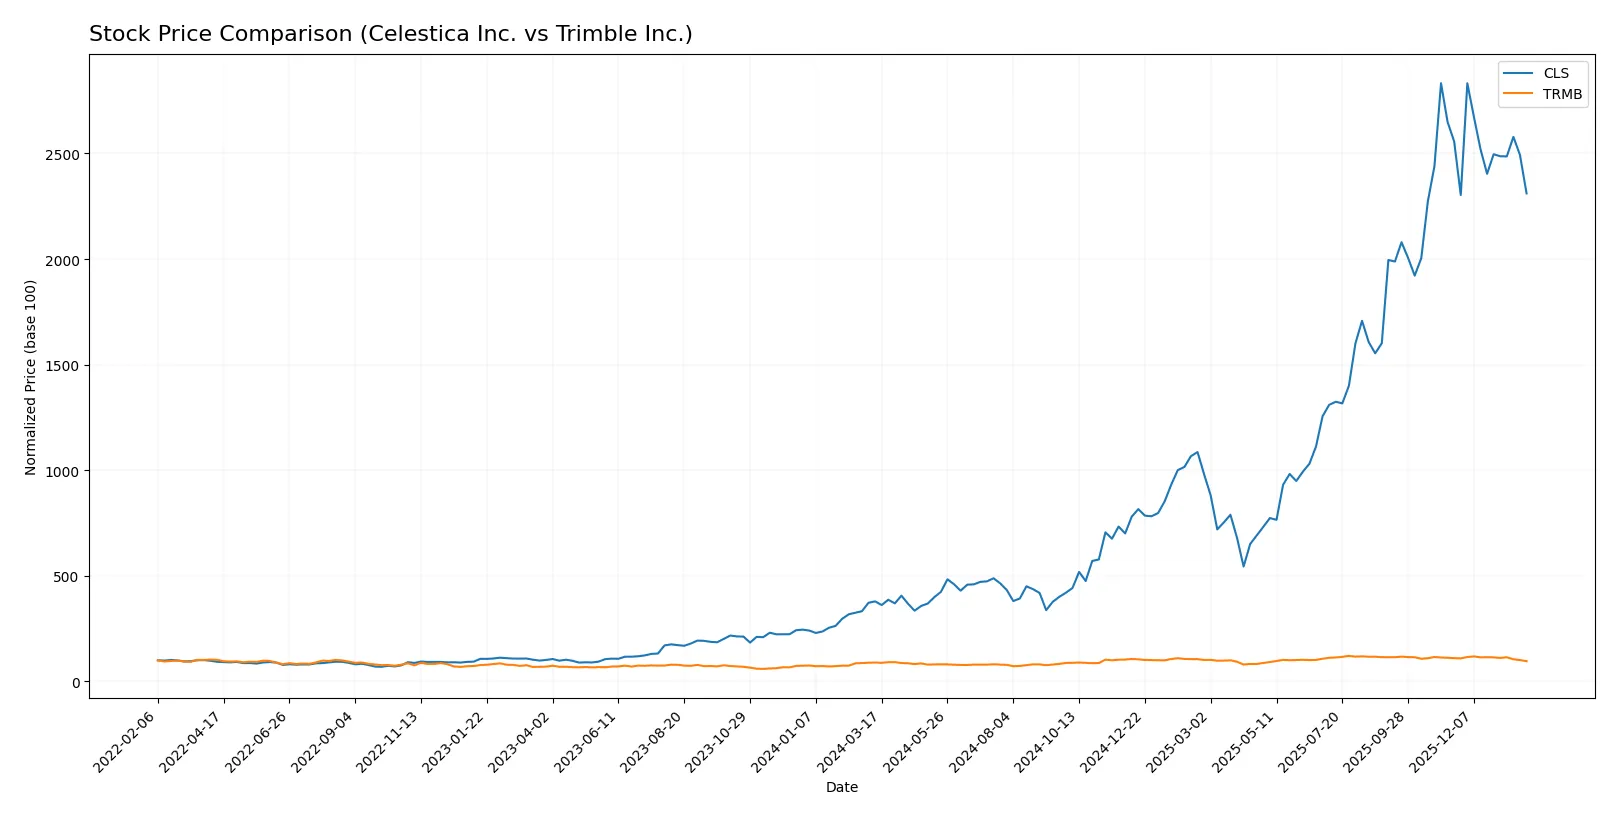
Trend Comparison
Celestica Inc. posts a bullish trend over the last 12 months with a 509.52% price increase, though recent months show a -9.61% decline and decelerating momentum. Trimble Inc. also maintains a bullish stance over 12 months with a 7.15% gain, facing a sharper recent drop of -12.84% and slowing trend acceleration. Comparing both, Celestica clearly outperforms Trimble in overall market returns despite recent downward pressure on both stocks.
Target Prices
Analysts present a cautiously optimistic consensus on Celestica Inc. and Trimble Inc.
| Company | Target Low | Target High | Consensus |
|---|---|---|---|
| Celestica Inc. | 300 | 440 | 365.6 |
| Trimble Inc. | 94 | 102 | 98.2 |
Celestica’s target consensus of 365.6 implies a 30% upside from its current 281 price. Trimble’s consensus near 98 suggests a 45% potential gain over its current 67.6 price.

Don’t Let Luck Decide Your Entry Point
Optimize your entry points with our advanced ProRealTime indicators. You’ll get efficient buy signals with precise price targets for maximum performance. Start outperforming now!
How do institutions grade them?
Here is a detailed comparison of recent grades assigned to Celestica Inc. and Trimble Inc.:
Celestica Inc. Grades
The following table summarizes Celestica Inc.’s latest institutional grades and actions:
| Grading Company | Action | New Grade | Date |
|---|---|---|---|
| Citigroup | Maintain | Buy | 2026-01-30 |
| Barclays | Maintain | Overweight | 2026-01-30 |
| Goldman Sachs | Maintain | Buy | 2025-12-01 |
| Barclays | Maintain | Overweight | 2025-11-14 |
| Citigroup | Upgrade | Buy | 2025-11-10 |
| Goldman Sachs | Maintain | Buy | 2025-10-29 |
| CIBC | Maintain | Outperform | 2025-10-29 |
| Stifel | Maintain | Buy | 2025-10-29 |
| Barclays | Maintain | Overweight | 2025-10-29 |
| JP Morgan | Maintain | Overweight | 2025-10-29 |
Trimble Inc. Grades
The following table presents the recent institutional grades and actions for Trimble Inc.:
| Grading Company | Action | New Grade | Date |
|---|---|---|---|
| Barclays | Maintain | Overweight | 2026-01-12 |
| Keybanc | Upgrade | Overweight | 2025-12-16 |
| Piper Sandler | Maintain | Overweight | 2025-11-07 |
| JP Morgan | Maintain | Overweight | 2025-09-19 |
| Raymond James | Maintain | Outperform | 2025-08-07 |
| Oppenheimer | Maintain | Outperform | 2025-08-07 |
| JP Morgan | Maintain | Overweight | 2025-08-07 |
| Oppenheimer | Maintain | Outperform | 2025-07-17 |
| JP Morgan | Maintain | Overweight | 2025-07-10 |
| JP Morgan | Maintain | Overweight | 2025-05-14 |
Which company has the best grades?
Both Celestica Inc. and Trimble Inc. enjoy generally positive grades, mostly in the Buy, Outperform, and Overweight categories. Celestica’s grades show a consistent Buy and Overweight stance from major firms. Trimble’s grades include several Outperform ratings, indicating a slightly more bullish institutional outlook. This difference may influence investors seeking stronger growth signals from analyst opinions.
Risks specific to each company
The following categories identify the critical pressure points and systemic threats facing both firms in the 2026 market environment:
1. Market & Competition
Celestica Inc.
- Faces intense competition in hardware manufacturing with thin net margins of 4.44%.
Trimble Inc.
- Benefits from strong market niche in software and precision tech, boasting a 40.84% net margin.
2. Capital Structure & Debt
Celestica Inc.
- Maintains a conservative debt-to-equity ratio of 0.42, signaling moderate leverage.
Trimble Inc.
- Shows slightly lower leverage at 0.26 debt-to-equity, enhancing financial flexibility.
3. Stock Volatility
Celestica Inc.
- Beta of 1.46 indicates above-market volatility, increasing investment risk.
Trimble Inc.
- Higher beta at 1.59 suggests greater susceptibility to market swings.
4. Regulatory & Legal
Celestica Inc.
- Exposure to multi-jurisdictional regulations due to global operations in hardware supply chains.
Trimble Inc.
- Faces complex regulatory environments across software, transportation, and agriculture sectors.
5. Supply Chain & Operations
Celestica Inc.
- Dependent on global component sourcing, vulnerable to geopolitical disruptions.
Trimble Inc.
- Operates diversified segments yet relies on hardware components subject to supply chain fragility.
6. ESG & Climate Transition
Celestica Inc.
- Increasing pressure to improve sustainability in manufacturing and energy consumption.
Trimble Inc.
- Faces challenges integrating ESG in agriculture and transportation tech but has innovation opportunities.
7. Geopolitical Exposure
Celestica Inc.
- High exposure due to manufacturing in North America, Europe, and Asia amid trade tensions.
Trimble Inc.
- US-based with global reach, susceptible to tariffs and international policy shifts.
Which company shows a better risk-adjusted profile?
Celestica’s most impactful risk is its narrow profit margin amid intense hardware competition. Trimble’s key risk lies in high market volatility and supply chain complexity. Trimble’s higher net margin and favorable leverage profile grant it a better risk-adjusted stance. Yet, Trimble’s beta signals elevated market risk. Recent data confirms Trimble’s stronger profitability but warns of its stock’s greater sensitivity to market cycles.
Final Verdict: Which stock to choose?
Celestica’s superpower lies in its robust return on equity and steadily improving profitability, signaling efficient capital deployment and growth momentum. Its point of vigilance is the relatively elevated price multiples, which may challenge valuation discipline. This stock suits investors with an appetite for aggressive growth seeking operational leverage.
Trimble’s strategic moat is its commanding gross margins and resilient net profits, underpinned by recurring revenue streams and innovation in specialized technologies. Compared to Celestica, it offers better financial stability but faces pressure on invested capital returns. It fits well in a GARP portfolio that balances growth with valuation appeal.
If you prioritize dynamic growth with improving returns on equity, Celestica is the compelling choice due to its accelerating income and capital efficiency. However, if you seek steadier cash flows and a moat built on recurring revenues, Trimble offers better stability despite its declining ROIC trend. Both profiles demand careful risk assessment given recent price decelerations.
Disclaimer: Investment carries a risk of loss of initial capital. The past performance is not a reliable indicator of future results. Be sure to understand risks before making an investment decision.
Go Further
I encourage you to read the complete analyses of Celestica Inc. and Trimble Inc. to enhance your investment decisions: