Home > Comparison > Technology > CLS vs TDY
The strategic rivalry between Celestica Inc. and Teledyne Technologies defines the current trajectory of the technology hardware sector. Celestica operates as a capital-intensive provider of advanced manufacturing and supply chain solutions. In contrast, Teledyne focuses on high-technology instrumentation and digital imaging with a strong aerospace and defense presence. This analysis will assess which approach offers superior risk-adjusted returns and aligns better with diversified portfolio objectives in 2026.
Table of contents
Companies Overview
Celestica Inc. and Teledyne Technologies Incorporated both command significant roles in the global hardware and equipment sector.
Celestica Inc.: Global Supply Chain and Technology Solutions Leader
Celestica Inc. specializes in hardware platform and supply chain solutions across North America, Europe, and Asia. Its core revenue stems from product manufacturing and supply chain services, including design, engineering, assembly, and logistics. In 2026, Celestica focuses strategically on advancing its Advanced Technology and Connectivity & Cloud Solutions segments, targeting aerospace, defense, healthtech, and cloud-based industries.
Teledyne Technologies Incorporated: Advanced Industrial and Defense Technologies Provider
Teledyne Technologies operates primarily in enabling technologies for industrial growth markets worldwide. Its revenue engine revolves around instrumentation, digital imaging, aerospace electronics, and engineered systems. The company’s 2026 strategy emphasizes growth in defense electronics, sensor networks, and thermal imaging systems, leveraging innovation in aerospace, environmental, and energy applications.
Strategic Collision: Similarities & Divergences
Both companies serve technology-driven hardware markets but differ fundamentally in focus. Celestica emphasizes supply chain integration and manufacturing services, while Teledyne invests heavily in high-tech instrumentation and aerospace electronics. Their primary battleground lies in defense and industrial sectors, but Celestica leans toward scalable manufacturing, whereas Teledyne targets innovation-heavy product niches. This divergence shapes distinct investment profiles: Celestica is asset and operations-driven; Teledyne is innovation and technology-centric.
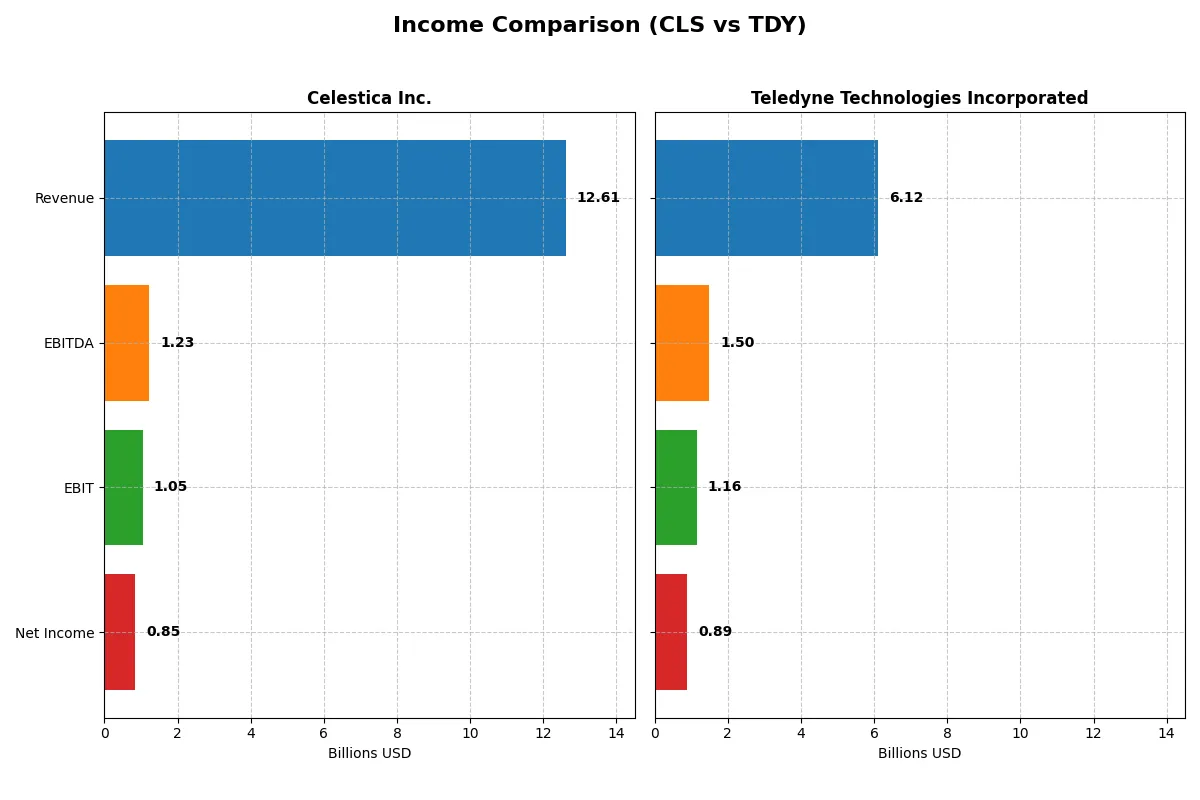
Income Statement Comparison
This data dissects the core profitability and scalability of both corporate engines to reveal who dominates the bottom line:
| Metric | Celestica Inc. (CLS) | Teledyne Technologies Incorporated (TDY) |
|---|---|---|
| Revenue | 12.6B | 6.12B |
| Cost of Revenue | 11.1B | 3.72B |
| Operating Expenses | 385M | 1.25B |
| Gross Profit | 1.47B | 2.40B |
| EBITDA | 1.23B | 1.50B |
| EBIT | 1.05B | 1.16B |
| Interest Expense | 54M | 60M |
| Net Income | 847M | 895M |
| EPS | 7.22 | 18.88 |
| Fiscal Year | 2025 | 2025 |
Income Statement Analysis: The Bottom-Line Duel
This income statement comparison unveils which company runs the most efficient and profitable corporate engine through recent fiscal performance.
Celestica Inc. Analysis
Celestica’s revenue surged from 5.6B in 2021 to 12.6B in 2025, more than doubling over five years. Net income expanded impressively from 104M to 847M, reflecting strong bottom-line growth. Its gross margin hovered around a modest 11.7%, while net margin improved to 6.7%, signaling solid margin expansion and operational leverage in 2025.
Teledyne Technologies Incorporated Analysis
Teledyne’s revenue rose steadily from 4.6B in 2021 to 6.1B in 2025, showing moderate growth. Net income grew from 445M to 895M, nearly doubling, with a strong gross margin of 39.2% and a robust net margin of 14.6% in 2025. Margins remain healthy despite a slight recent dip in gross profit growth, highlighting operational efficiency.
Steady Growth vs. Margin Strength
Celestica demonstrates exceptional top-line momentum and rapid net income growth, though with slimmer margins. Teledyne boasts superior profitability with high margins and consistent earnings growth. For investors, Celestica offers dynamic expansion potential, while Teledyne presents a more stable, margin-rich profile.
Financial Ratios Comparison
These vital ratios act as a diagnostic tool to expose the underlying fiscal health, valuation premiums, and capital efficiency of the companies compared:
| Ratios | Celestica Inc. (CLS) | Teledyne Technologies Inc. (TDY) |
|---|---|---|
| ROE | 22.57% | 8.51% |
| ROIC | 16.10% | 6.68% |
| P/E | 25.47 | 26.53 |
| P/B | 5.75 | 2.28 |
| Current Ratio | 1.49 | 2.33 |
| Quick Ratio | 0.91 | 1.61 |
| D/E | 0.42 | 0.29 |
| Debt-to-Assets | 13.30% | 19.64% |
| Interest Coverage | 11.50 | 17.08 |
| Asset Turnover | 1.61 | 0.40 |
| Fixed Asset Turnover | 14.58 | 7.61 |
| Payout ratio | 0 | 0 |
| Dividend yield | 0 | 0 |
| Fiscal Year | 2024 | 2024 |
Efficiency & Valuation Duel: The Vital Signs
Ratios serve as a company’s DNA, exposing hidden risks and operational strengths that raw numbers alone cannot reveal.
Celestica Inc.
Celestica exhibits a strong 22.6% ROE, signaling efficient shareholder equity use despite a modest 4.44% net margin. The stock appears stretched with a P/E of 25.5 and a high P/B of 5.75, reflecting premium valuation. The firm returns no dividend, focusing on reinvestment to sustain growth and R&D.
Teledyne Technologies Incorporated
Teledyne delivers a robust 14.6% net margin but a lower 8.5% ROE, suggesting moderate equity efficiency. Its P/E of 27.4 indicates an expensive stock, yet a reasonable P/B of 2.33 balances valuation. Like Celestica, it pays no dividend, channeling resources into R&D and operational expansion.
Premium Valuation vs. Operational Safety
Celestica offers higher equity returns but at a stretched valuation, while Teledyne boasts superior profitability and healthier liquidity. Celestica fits investors prioritizing growth efficiency; Teledyne suits those valuing margin strength and balance sheet resilience. Each profile presents distinct risk-return trade-offs.
Which one offers the Superior Shareholder Reward?
I observe Celestica Inc. (CLS) avoids dividends and buybacks, reinvesting 100% of FCF into capex and operations, reflecting a growth-focused strategy with free cash flow per share of 2.57 and zero payout. Teledyne Technologies Inc. (TDY) also pays no dividends but demonstrates aggressive buybacks, returning 93% of operating cash flow as buybacks, with free cash flow per share at 22.7. TDY’s robust margins (net margin ~14.6%) and sustainable free cash flow coverage of buybacks signal a shareholder-friendly capital allocation. I conclude TDY offers the superior total shareholder reward in 2026 due to its balanced reinvestment and capital return approach.
Comparative Score Analysis: The Strategic Profile
The radar chart reveals the fundamental DNA and trade-offs of Celestica Inc. and Teledyne Technologies Incorporated, highlighting their financial strengths and weaknesses:
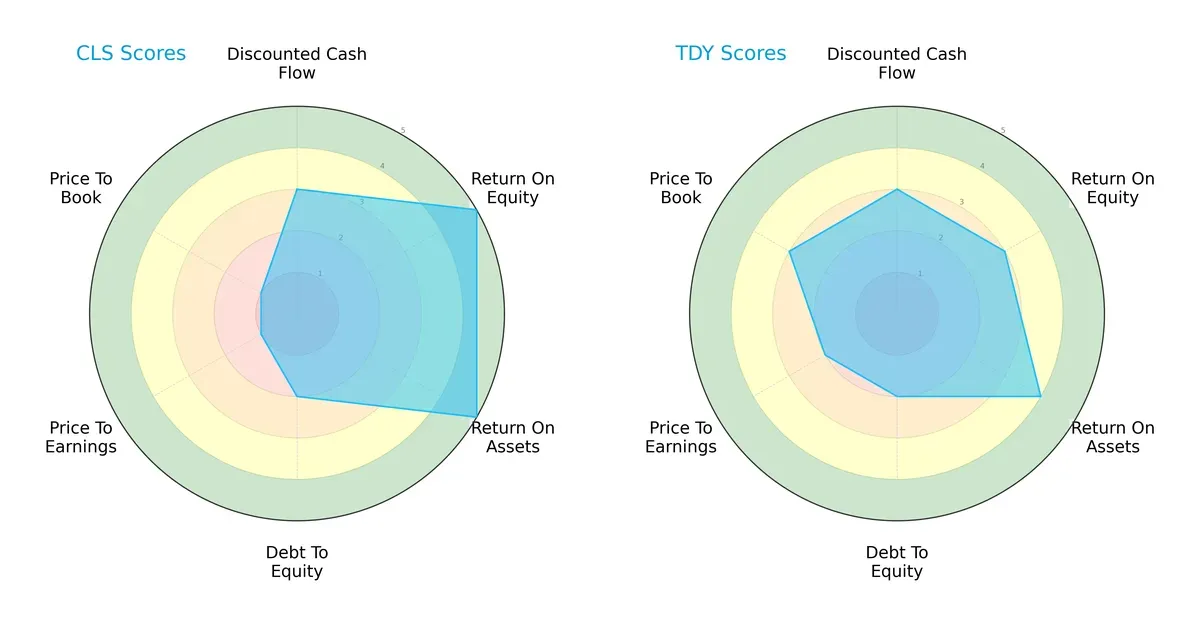
Celestica excels in profitability with top ROE and ROA scores (5 each), but shows valuation concerns with very unfavorable P/E and P/B scores (1 each). Teledyne offers a more balanced profile, with moderate profitability and better valuation scores, especially P/B (3). Both share similar debt risk (2). Celestica relies heavily on operational efficiency, while Teledyne balances valuation and asset utilization more evenly.
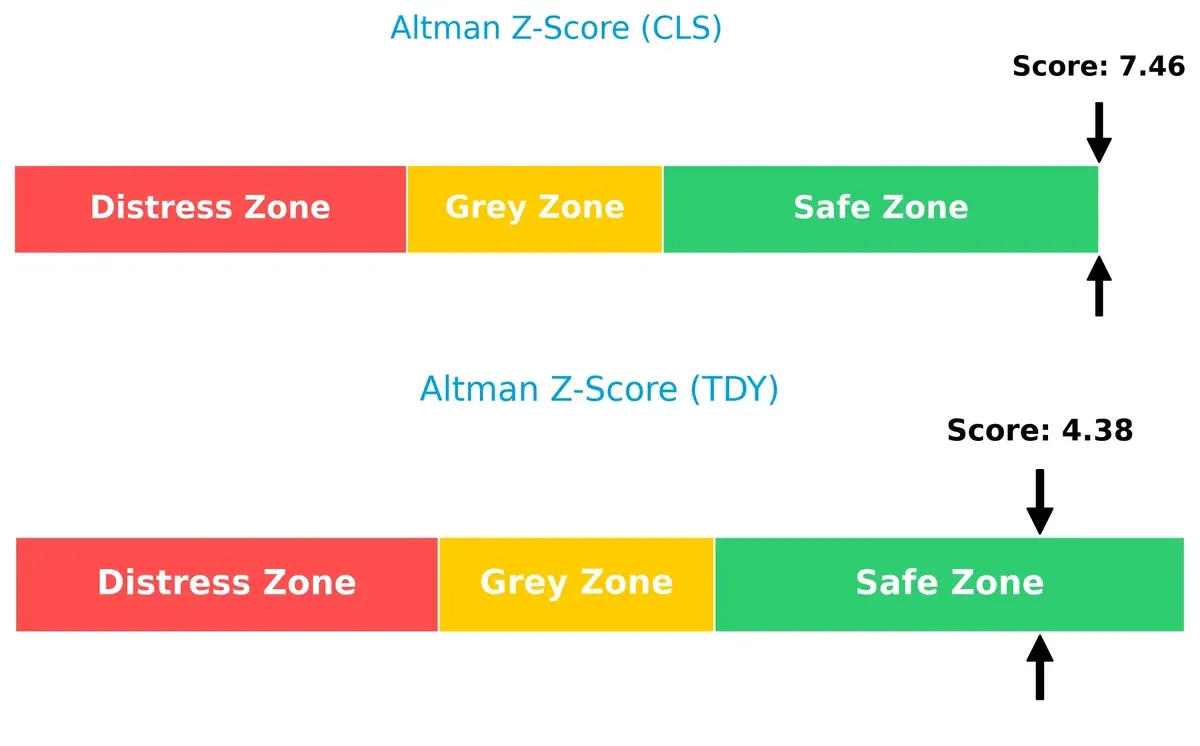
Bankruptcy Risk: Solvency Showdown
Celestica’s Altman Z-Score of 7.46 far outpaces Teledyne’s 4.38, signaling superior long-term solvency and lower bankruptcy risk in the current economic cycle:
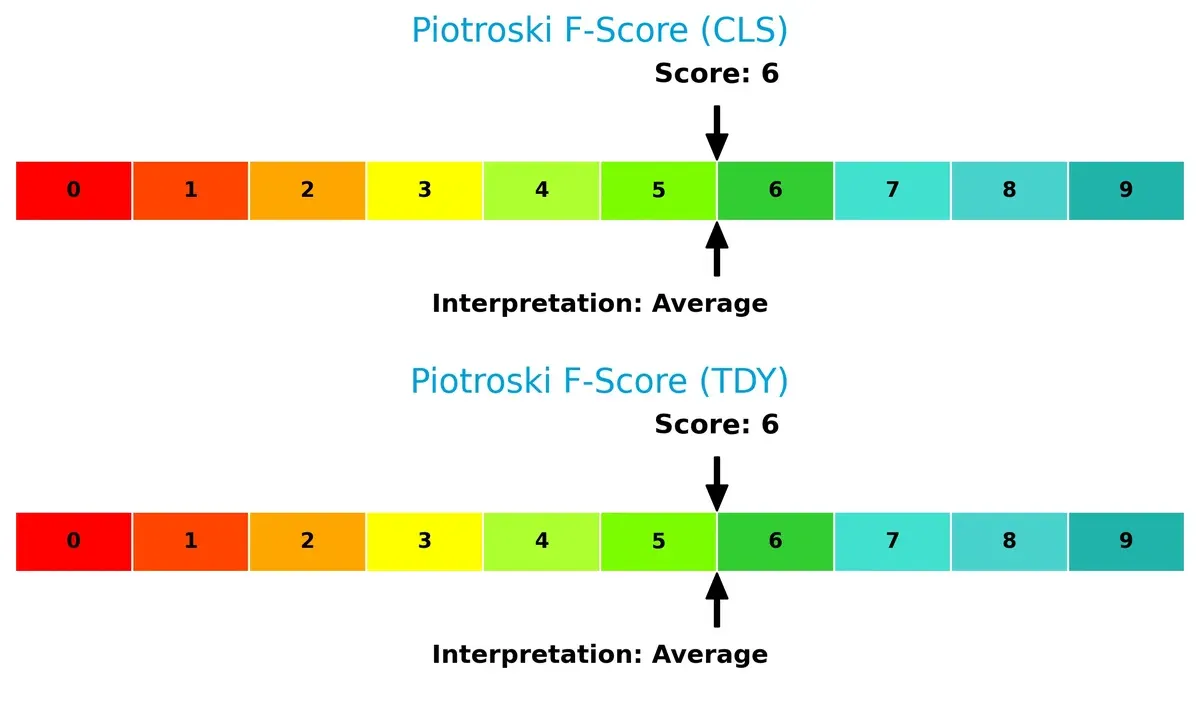
Financial Health: Quality of Operations
Both companies score a 6 on the Piotroski F-Score, indicating average financial health without significant red flags in internal metrics:
How are the two companies positioned?
This section dissects the operational DNA of Celestica Inc. and Teledyne Technologies by comparing their revenue distribution and internal strengths and weaknesses. The final objective is to confront their economic moats to identify which business model offers the most resilient and sustainable competitive advantage today.
Revenue Segmentation: The Strategic Mix
The following visual comparison dissects how Celestica Inc. and Teledyne Technologies Incorporated diversify their income streams and where their primary sector bets lie:
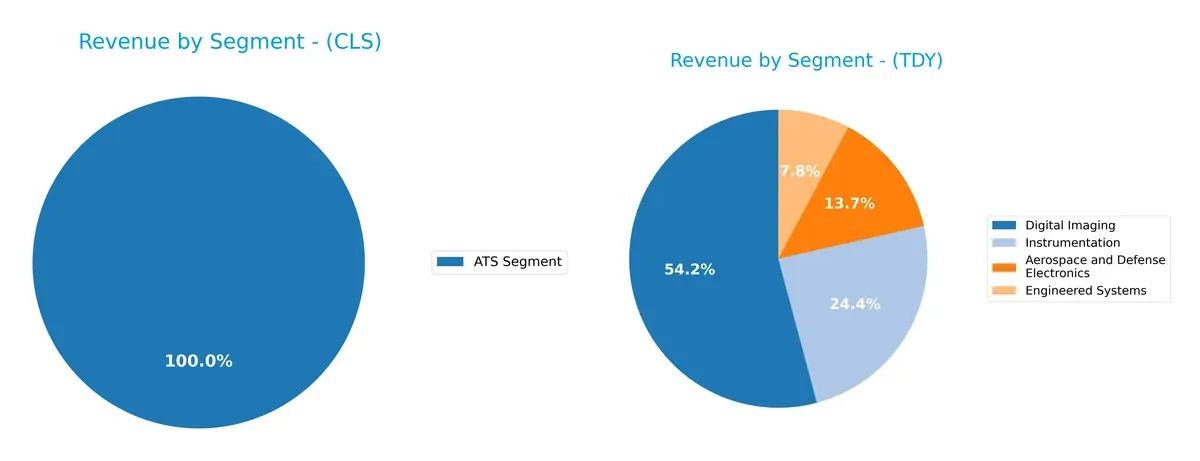
Celestica leans heavily on its ATS Segment, generating $3.16B, revealing a highly concentrated revenue base. In contrast, Teledyne spreads its $6.1B revenue across four segments: Digital Imaging ($3.07B), Instrumentation ($1.38B), Aerospace and Defense Electronics ($777M), and Engineered Systems ($440M). This diversification reduces Teledyne’s concentration risk and supports ecosystem lock-in, while Celestica’s reliance on a single segment signals vulnerability to industry shifts.
Strengths and Weaknesses Comparison
This table compares the strengths and weaknesses of Celestica Inc. (CLS) and Teledyne Technologies Incorporated (TDY):
CLS Strengths
- Strong ROE at 22.57%
- Low debt-to-equity ratio of 0.42
- High asset turnover at 1.61
- Robust fixed asset turnover at 14.58
- Favorable interest coverage at 19.69
TDY Strengths
- High net margin of 14.63%
- Strong current ratio at 1.64 and quick ratio at 1.08
- Low debt-to-equity ratio of 0.24
- Favorable fixed asset turnover at 7.29
- Diversified product segments including Aerospace, Digital Imaging, and Instrumentation
- Significant global presence across US, Europe, and Asia
CLS Weaknesses
- Low net margin at 4.44%
- Unfavorable P/E at 25.47 and P/B at 5.75
- No dividend yield
- Unavailable ROIC and WACC data
- Neutral liquidity ratios (quick ratio 0.91)
- Limited disclosed diversification, mainly ATS segment
TDY Weaknesses
- Lower ROE at 8.51%
- Unfavorable P/E at 27.35
- Low asset turnover at 0.4
- No dividend yield
- Neutral P/B at 2.33
- Higher debt to assets at 16.19% compared to CLS
Celestica excels in capital efficiency and profitability metrics like ROE but struggles with margins and market valuation. Teledyne shows strength in profitability and liquidity with diversified operations but faces challenges in ROE and asset turnover. Each company’s financial profile reveals different strategic focuses and operational risks.
The Moat Duel: Analyzing Competitive Defensibility
A structural moat is the essential barrier protecting long-term profits from relentless competitive erosion. Let’s compare two distinct moats:
Celestica Inc.: Supply Chain Integration Moat
Celestica’s advantage lies in complex supply chain and manufacturing scale, reflected in rapid revenue growth and margin expansion through 2025. New advanced tech segments could deepen its cost advantage.
Teledyne Technologies: Technological Innovation Moat
Teledyne relies on specialized instrumentation and aerospace tech, delivering higher margins but slower revenue growth. Its innovation pipeline supports steady profitability, though value destruction signals caution.
Scale and Innovation: Supply Chain Dominance vs. Tech Specialization
Celestica’s accelerating ROIC growth and revenue momentum suggest a widening moat versus Teledyne’s modest ROIC gains despite superior margins. Celestica appears better positioned to defend and expand market share.
Which stock offers better returns?
The stock prices of Celestica Inc. and Teledyne Technologies Incorporated show strong upward moves over the past year, with distinct trading volume dynamics and trend shifts.
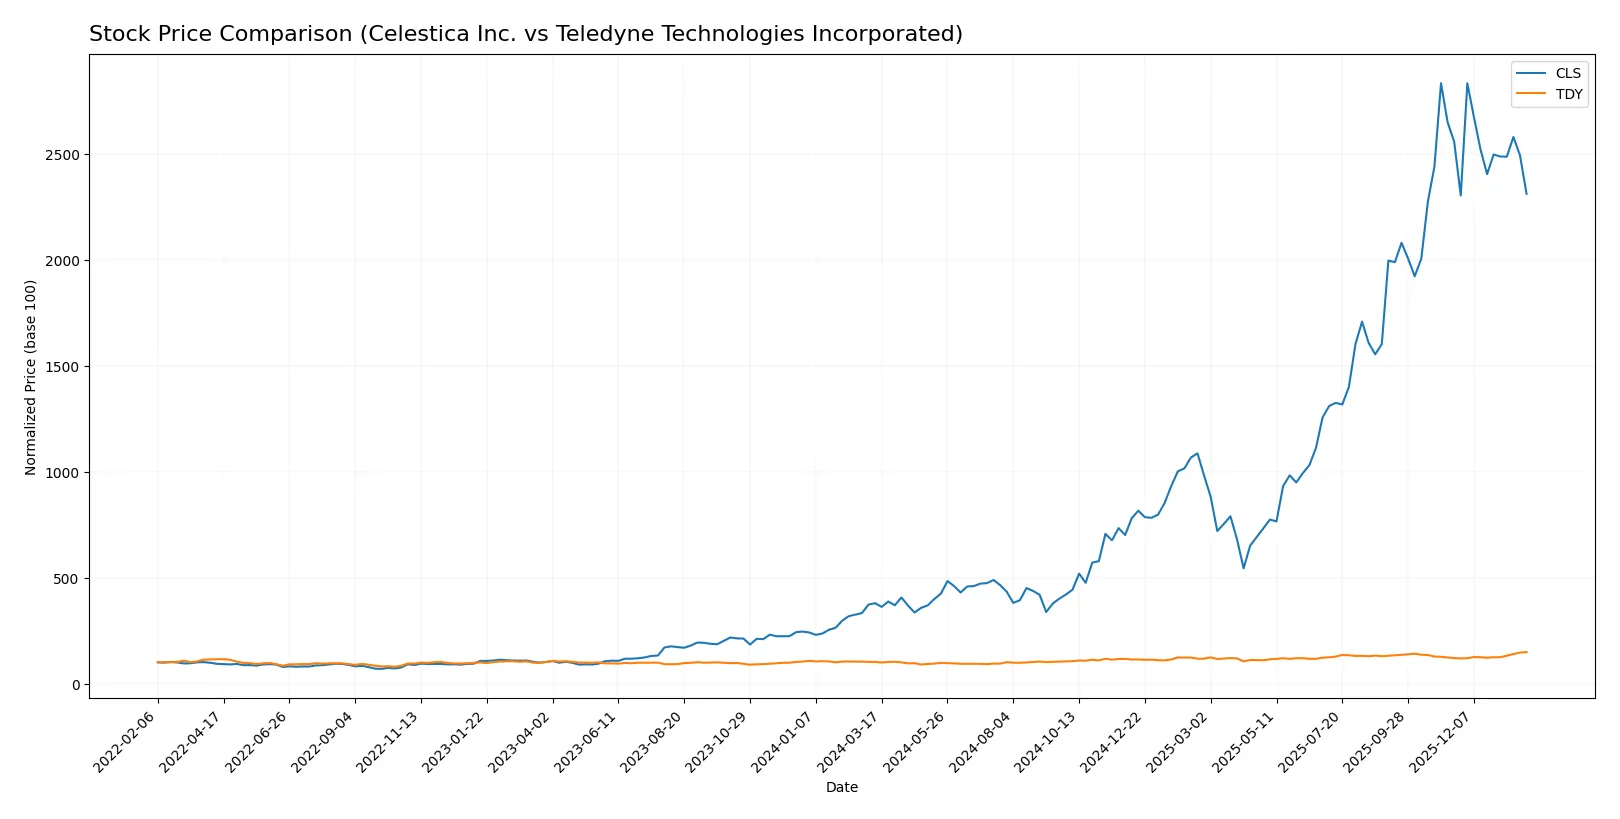
Trend Comparison
Celestica Inc. gained 510% over the past 12 months, reflecting a bullish trend but with decelerating momentum. It peaked at 344.48 and fell to 40.73, showing high volatility (92.63 std deviation). Recently, it declined 9.61%, signaling short-term weakness.
Teledyne Technologies rose 45.62% in the same period with accelerating momentum and moderate volatility (58.2 std deviation). It ranged between 374.64 and 620.3. Recently, it gained 23.76%, confirming a bullish short-term trend.
Celestica outperformed Teledyne significantly over 12 months. However, Teledyne showed stronger recent upward momentum, reflecting more consistent buying interest.
Target Prices
Analysts present a clear consensus on target prices for Celestica Inc. and Teledyne Technologies Incorporated.
| Company | Target Low | Target High | Consensus |
|---|---|---|---|
| Celestica Inc. | 300 | 440 | 365.6 |
| Teledyne Technologies Incorporated | 599 | 720 | 638.5 |
Celestica’s consensus target of 365.6 implies a 30% upside from its current 281 price, signaling strong growth potential. Teledyne’s 638.5 target suggests modest appreciation above its current 620 price, reflecting steady confidence.

Don’t Let Luck Decide Your Entry Point
Optimize your entry points with our advanced ProRealTime indicators. You’ll get efficient buy signals with precise price targets for maximum performance. Start outperforming now!
How do institutions grade them?
Here is the summary of institutional grades for Celestica Inc. and Teledyne Technologies Incorporated:
Celestica Inc. Grades
This table shows recent grades from major financial institutions for Celestica Inc.:
| Grading Company | Action | New Grade | Date |
|---|---|---|---|
| Citigroup | Maintain | Buy | 2026-01-30 |
| Barclays | Maintain | Overweight | 2026-01-30 |
| Goldman Sachs | Maintain | Buy | 2025-12-01 |
| Barclays | Maintain | Overweight | 2025-11-14 |
| Citigroup | Upgrade | Buy | 2025-11-10 |
| Goldman Sachs | Maintain | Buy | 2025-10-29 |
| CIBC | Maintain | Outperform | 2025-10-29 |
| Stifel | Maintain | Buy | 2025-10-29 |
| Barclays | Maintain | Overweight | 2025-10-29 |
| JP Morgan | Maintain | Overweight | 2025-10-29 |
Teledyne Technologies Incorporated Grades
This table shows recent grades from major financial institutions for Teledyne Technologies Incorporated:
| Grading Company | Action | New Grade | Date |
|---|---|---|---|
| Needham | Maintain | Buy | 2026-01-22 |
| Barclays | Maintain | Equal Weight | 2026-01-22 |
| Stifel | Maintain | Buy | 2026-01-22 |
| Citigroup | Maintain | Neutral | 2026-01-13 |
| Barclays | Maintain | Equal Weight | 2026-01-12 |
| Barclays | Maintain | Equal Weight | 2025-10-23 |
| Needham | Maintain | Buy | 2025-10-23 |
| Stifel | Maintain | Buy | 2025-10-23 |
| Morgan Stanley | Maintain | Equal Weight | 2025-10-15 |
| UBS | Maintain | Buy | 2025-07-24 |
Which company has the best grades?
Celestica Inc. consistently receives Buy or Overweight grades from top banks, signaling strong institutional confidence. Teledyne Technologies shows more mixed ratings, balancing Buy and Equal Weight grades. Investors may interpret Celestica’s stronger grades as greater analyst conviction, potentially affecting demand and valuation.
Risks specific to each company
The following categories identify critical pressure points and systemic threats facing Celestica Inc. and Teledyne Technologies Incorporated in the 2026 market environment:
1. Market & Competition
Celestica Inc.
- Faces intense competition in hardware and supply chain services; margin pressure evident with low net margin (4.44%).
Teledyne Technologies Incorporated
- Operates in specialized tech markets with stronger net margin (14.63%), but slower asset turnover signals operational challenges.
2. Capital Structure & Debt
Celestica Inc.
- Maintains conservative leverage (D/E 0.42) with strong interest coverage (19.69), supporting financial stability.
Teledyne Technologies Incorporated
- Lower leverage (D/E 0.24) and solid interest coverage (19.47) highlight prudent capital management amid growth investments.
3. Stock Volatility
Celestica Inc.
- Beta at 1.46 indicates higher stock volatility, increasing risk during market downturns.
Teledyne Technologies Incorporated
- Lower beta of 1.03 suggests moderate volatility, providing a steadier investment profile.
4. Regulatory & Legal
Celestica Inc.
- Exposure to global supply chains invites regulatory scrutiny, particularly in trade and export controls.
Teledyne Technologies Incorporated
- Defense and aerospace segments face stringent regulations, but diversified portfolio mitigates concentrated legal risks.
5. Supply Chain & Operations
Celestica Inc.
- Complex supply chain across multiple continents risks disruption, impacting timely delivery and costs.
Teledyne Technologies Incorporated
- Integrated manufacturing with focus on advanced tech systems reduces supply chain vulnerability.
6. ESG & Climate Transition
Celestica Inc.
- Pressure to enhance sustainability amid energy and electronic manufacturing footprint; ESG factors may affect capital access.
Teledyne Technologies Incorporated
- Active in defense and environmental sectors, with opportunities to lead in climate tech innovation.
7. Geopolitical Exposure
Celestica Inc.
- Operations span North America, Europe, and Asia, exposing it to trade tensions and geopolitical uncertainty.
Teledyne Technologies Incorporated
- US-centric but globally active, faces risks from defense policy shifts and international relations.
Which company shows a better risk-adjusted profile?
Teledyne’s stronger net margin and lower stock volatility offer a more balanced risk-adjusted profile. Celestica’s higher beta and supply chain complexity present greater vulnerability. However, Celestica’s robust ROE and asset turnover highlight operational efficiency despite margin pressures. The most impactful risk for Celestica is market competition compressing profitability. For Teledyne, regulatory and geopolitical risks tied to defense markets dominate. Teledyne’s steadier financial ratios and safer Altman Z-Score confirm it manages risk more effectively in 2026.
Final Verdict: Which stock to choose?
Celestica Inc. (CLS) shines with its accelerating return on equity and operating asset efficiency. Its core strength lies in scaling profitability amid rapid revenue growth, embodying a cash-generating machine. A point of vigilance is its stretched valuation multiples, which could pressure returns if growth slows. CLS suits aggressive growth portfolios seeking dynamic capital appreciation.
Teledyne Technologies Incorporated (TDY) commands a strategic moat through diversified industrial tech and robust recurring revenue streams. It offers greater balance sheet safety and consistent free cash flow, appealing to investors prioritizing stability. While its margins impress, the company faces challenges in asset turnover and value creation, fitting well within GARP (Growth at a Reasonable Price) portfolios.
If you prioritize rapid growth and operational leverage, Celestica appears the compelling choice due to its superior earnings momentum and efficiency gains. However, if you seek stability with steady income and a strong industrial franchise, Teledyne offers better durability and balance sheet resilience. Both present slightly favorable risk profiles but cater to distinct investor appetites.
Disclaimer: Investment carries a risk of loss of initial capital. The past performance is not a reliable indicator of future results. Be sure to understand risks before making an investment decision.
Go Further
I encourage you to read the complete analyses of Celestica Inc. and Teledyne Technologies Incorporated to enhance your investment decisions: