Home > Comparison > Technology > TEL vs CLS
The strategic rivalry between TE Connectivity Ltd. and Celestica Inc. shapes the trajectory of the hardware, equipment, and parts sector. TE Connectivity operates as a global manufacturer of connectivity and sensor solutions, emphasizing diversified industrial applications. In contrast, Celestica focuses on hardware platforms and comprehensive supply chain services with a technology-driven manufacturing model. This analysis evaluates which company offers a superior risk-adjusted return amid evolving sector dynamics for a balanced portfolio.
Table of contents
Companies Overview
TE Connectivity Ltd. and Celestica Inc. stand as key players shaping the hardware and equipment sector globally.
TE Connectivity Ltd.: Global Connectivity Innovator
TE Connectivity dominates the connectivity and sensor solutions market across multiple continents. Its core revenues derive from diversified segments: Transportation, Industrial, and Communications Solutions. In 2026, the company emphasizes expanding its sensor technology and integrated connectivity offerings for automotive and aerospace industries, reinforcing its competitive edge in high-reliability components.
Celestica Inc.: End-to-End Hardware Solutions Provider
Celestica leads in delivering comprehensive hardware platform and supply chain solutions across North America, Europe, and Asia. It generates income through Advanced Technology and Connectivity & Cloud Solutions segments. The firm focuses on enhancing its manufacturing agility and expanding service offerings for high-growth sectors like cloud infrastructure and healthtech in 2026, aiming to deepen customer partnerships.
Strategic Collision: Similarities & Divergences
Both firms compete in hardware and technology but diverge sharply in approach: TE Connectivity prioritizes proprietary sensor systems, while Celestica leverages broad supply chain integration. Their primary battleground lies in industrial and communications hardware markets. TE Connectivity offers a stable, diversified revenue base; Celestica targets dynamic, service-driven growth, reflecting distinct risk and return profiles.
Income Statement Comparison
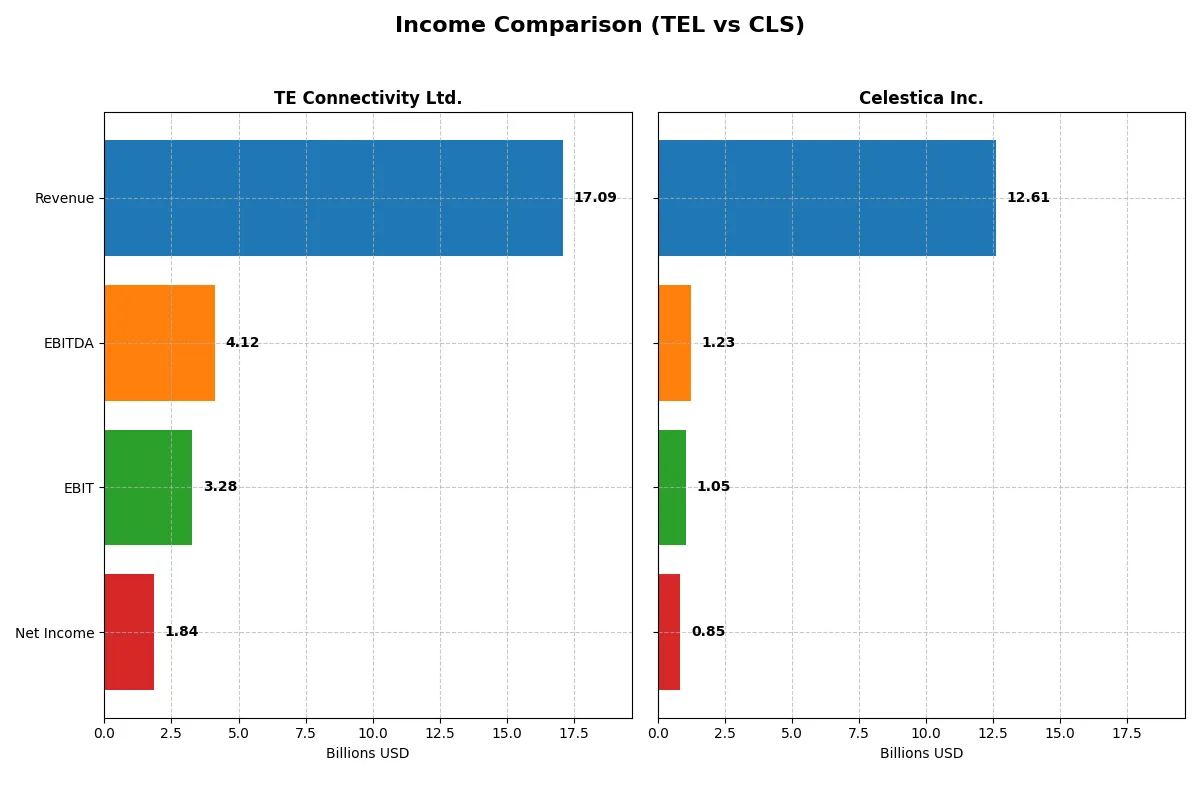
This table dissects the core profitability and scalability of both corporate engines to reveal who dominates the bottom line:
| Metric | TE Connectivity Ltd. (TEL) | Celestica Inc. (CLS) |
|---|---|---|
| Revenue | 17.1B | 12.6B |
| Cost of Revenue | 11.2B | 11.1B |
| Operating Expenses | 2.7B | 385M |
| Gross Profit | 5.9B | 1.5B |
| EBITDA | 4.1B | 1.2B |
| EBIT | 3.3B | 1.1B |
| Interest Expense | 77M | 54M |
| Net Income | 1.8B | 847M |
| EPS | 6.2 | 7.22 |
| Fiscal Year | 2025 | 2025 |
Income Statement Analysis: The Bottom-Line Duel
This income statement comparison reveals the true efficiency and momentum of TE Connectivity Ltd. and Celestica Inc. as corporate profit engines.
TE Connectivity Ltd. Analysis
TE Connectivity’s revenue grew modestly to $17.1B in 2025, yet net income declined to $1.84B, signaling margin pressure. Its gross margin remains strong at 34.6%, and the EBIT margin holds firm near 19.2%, showing operational resilience. However, a sharp net margin drop indicates recent profitability challenges despite solid revenue growth.
Celestica Inc. Analysis
Celestica surged revenue 31% to $12.6B in 2025, with net income doubling to $847M. Its gross margin at 11.7% and EBIT margin at 8.4% reflect leaner profitability but rapid improvement. The company’s impressive earnings and margin expansion showcase robust operational leverage and accelerating momentum over the last year.
Margin Strength vs. Growth Velocity
TE Connectivity dominates in margin quality and operating efficiency, while Celestica excels in high revenue and earnings growth. TE delivers consistent profitability with a 10.8% net margin, but Celestica’s 51% net margin growth signals stronger upward momentum. Investors seeking stable margins may prefer TE, whereas those favoring growth dynamics might lean toward Celestica.
Financial Ratios Comparison
These vital ratios act as a diagnostic tool to expose the underlying fiscal health, valuation premiums, and capital efficiency of the companies analyzed:
| Ratios | TE Connectivity Ltd. (TEL) | Celestica Inc. (CLS) |
|---|---|---|
| ROE | 14.6% | 22.6% |
| ROIC | 8.8% | 16.1% |
| P/E | 35.0 | 25.5 |
| P/B | 5.12 | 5.75 |
| Current Ratio | 1.56 | 1.49 |
| Quick Ratio | 1.03 | 0.91 |
| D/E (Debt to Equity) | 0.52 | 0.42 |
| Debt-to-Assets | 26.1% | 13.3% |
| Interest Coverage | 41.7 | 11.5 |
| Asset Turnover | 0.68 | 1.61 |
| Fixed Asset Turnover | 3.96 | 14.58 |
| Payout ratio | 43.6% | 0% |
| Dividend yield | 1.25% | 0% |
| Fiscal Year | 2025 | 2024 |
Efficiency & Valuation Duel: The Vital Signs
Financial ratios serve as a company’s DNA, exposing hidden risks and highlighting operational strengths crucial for investment insight.
TE Connectivity Ltd.
TE Connectivity posts a solid 14.6% ROE but only a neutral 8.8% ROIC versus a 9.1% WACC, suggesting limited capital efficiency. Its P/E of 35.0 and P/B of 5.12 mark the stock as stretched, reflecting high valuation. TE Connectivity offers a modest 1.25% dividend yield, balancing shareholder returns with steady R&D investment at 4.85% of revenue.
Celestica Inc.
Celestica delivers a strong 22.6% ROE but struggles with a low 4.44% net margin, indicating profitability challenges. Valuation metrics remain stretched, with a P/E of 25.5 and P/B of 5.75. The company pays no dividends, instead channeling resources into growth and operational efficiency, evidenced by a robust asset turnover of 1.61 and high fixed asset turnover of 14.58.
Premium Valuation vs. Operational Safety
TE Connectivity carries a premium valuation with balanced returns and dividend income, while Celestica shows higher ROE but weaker margins and no dividends. TE suits investors seeking steady returns and capital preservation; Celestica fits those prioritizing growth despite operational risks.
Which one offers the Superior Shareholder Reward?
I contrast TE Connectivity Ltd. (TEL) and Celestica Inc. (CLS) on distribution strategies and shareholder returns. TEL pays a dividend with a 1.25% yield and a 44% payout ratio, well-covered by free cash flow (FCF), supporting a sustainable model. Their active buyback program enhances total return. CLS pays no dividend, reinvesting FCF into growth and acquisitions, reflected in higher asset turnover but lower margins. CLS’s buybacks are less pronounced, limiting immediate shareholder reward. I find TEL’s balanced dividend and robust buybacks offer a superior total return profile for disciplined investors in 2026.
Comparative Score Analysis: The Strategic Profile
The radar chart reveals the fundamental DNA and trade-offs of TE Connectivity Ltd. and Celestica Inc., highlighting their distinct financial strengths and valuation challenges:
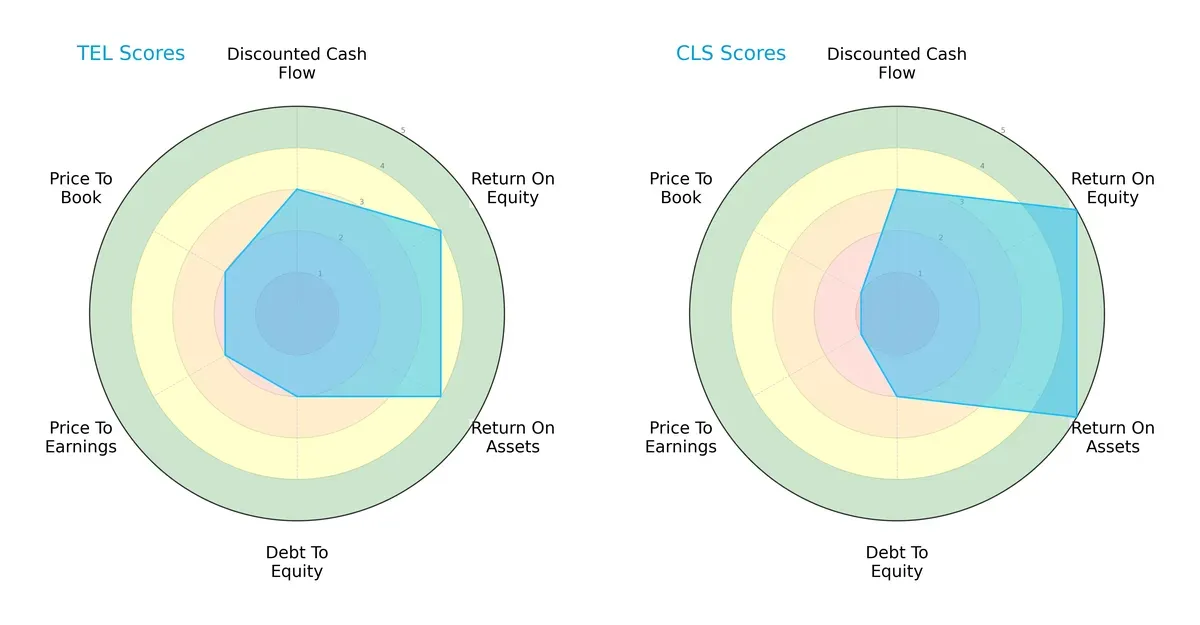
Both firms share a moderate overall score and equal DCF ratings, indicating similar cash flow expectations. Celestica excels in profitability with superior ROE (5 vs. 4) and ROA (5 vs. 4) scores, showing more efficient asset use. TE Connectivity offers a more balanced valuation profile, with higher P/E and P/B scores (2 vs. 1), suggesting less risk of overvaluation. Both have moderate debt-to-equity scores of 2, reflecting comparable leverage. TE Connectivity presents a steadier, balanced profile, while Celestica leverages a profitability edge but faces valuation headwinds.
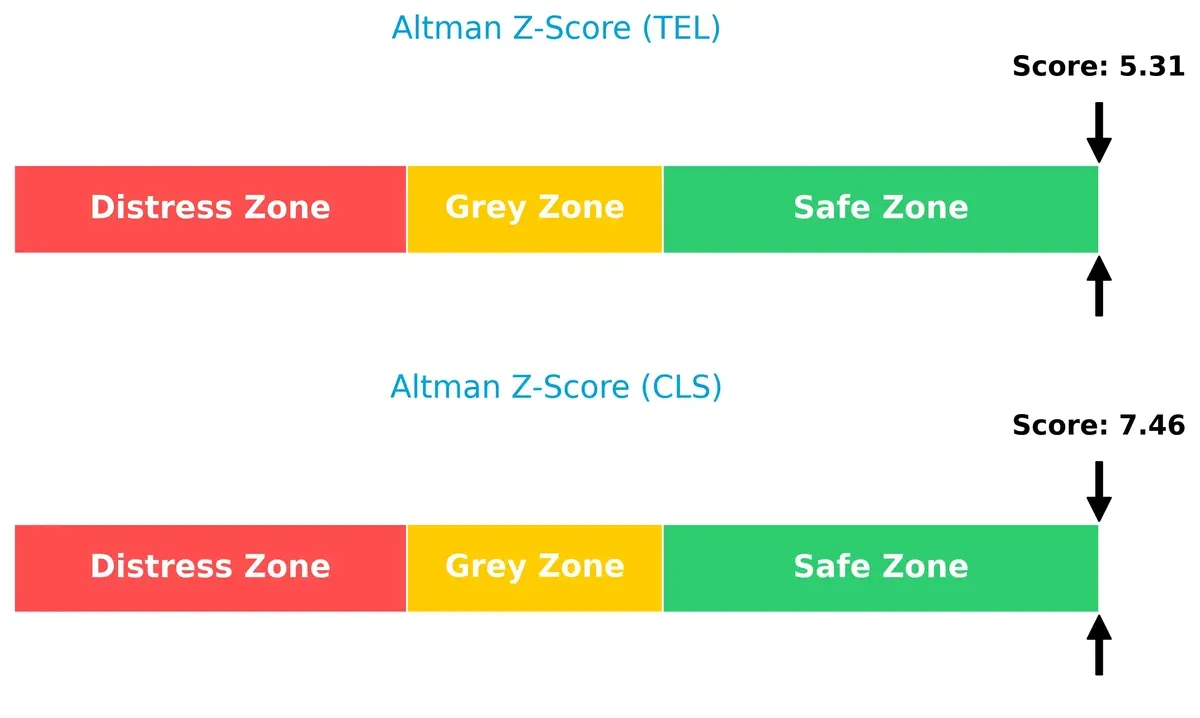
Bankruptcy Risk: Solvency Showdown
TE Connectivity and Celestica both reside securely in the safe zone, but Celestica’s higher Altman Z-Score (7.46 vs. 5.31) signals a stronger buffer against bankruptcy risks in this market cycle:
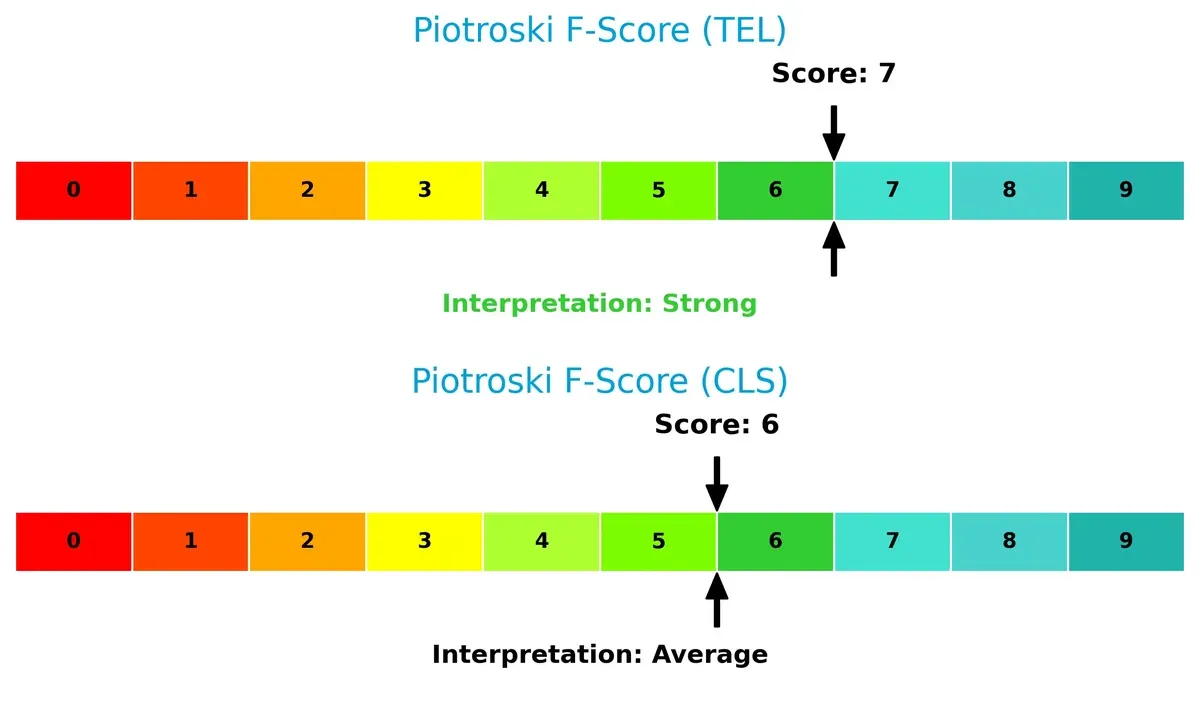
Financial Health: Quality of Operations
TE Connectivity’s Piotroski F-Score of 7 surpasses Celestica’s 6, indicating superior financial health and operational quality; Celestica’s lower score suggests some red flags in internal metrics relative to its peer:
How are the two companies positioned?
This section dissects the operational DNA of TEL and CLS by comparing their revenue distribution and internal dynamics, including strengths and weaknesses. The goal is to confront their economic moats to identify which model offers the most resilient competitive advantage in today’s market.
Revenue Segmentation: The Strategic Mix
The following visual comparison dissects how TE Connectivity Ltd. and Celestica Inc. diversify their income streams and where their primary sector bets lie:
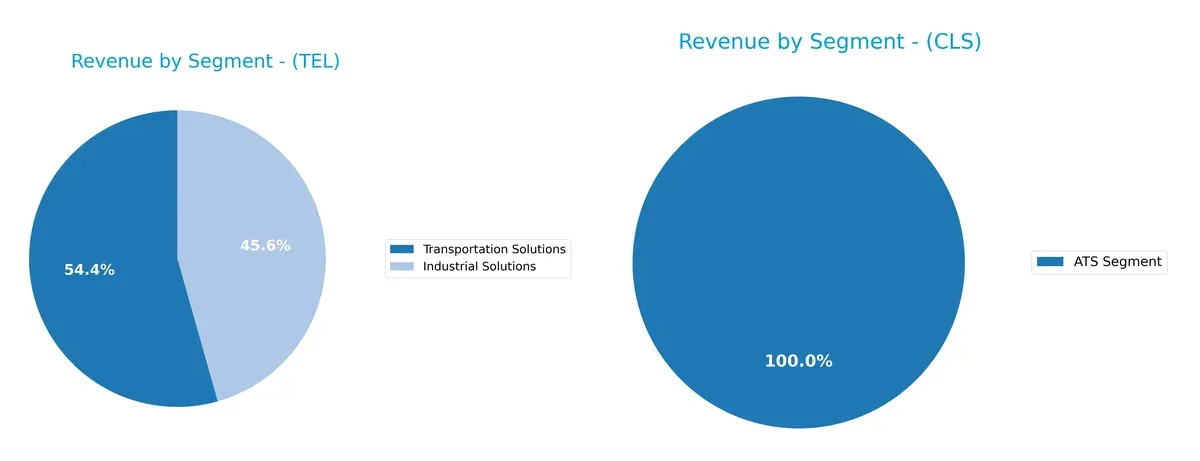
TE Connectivity anchors its revenue in Transportation Solutions at $9.4B and Industrial Solutions at $7.9B, reflecting a strong dual-segment focus. Celestica relies solely on its ATS Segment with $3.2B, showing no diversification. TE’s mix suggests ecosystem lock-in and infrastructure dominance, while Celestica faces concentration risk from dependence on one segment. This contrast highlights TE’s broader industrial footprint versus Celestica’s focused service model.
Strengths and Weaknesses Comparison
This table compares the Strengths and Weaknesses of TE Connectivity Ltd. (TEL) and Celestica Inc. (CLS):
TEL Strengths
- Diversified revenues across Industrial and Transportation Solutions
- Favorable net margin (10.78%)
- Strong liquidity ratios (current 1.56, quick 1.03)
- Low debt-to-assets ratio (26.12%)
- High interest coverage (42.61)
- Balanced geographic presence with strong China and US sales
CLS Strengths
- High return on equity (22.57%)
- Favorable debt-to-equity (0.42) and debt-to-assets (13.3%)
- Strong asset turnover (1.61) and fixed asset turnover (14.58)
- Favorable interest coverage (19.69)
- Focused revenue from ATS Segment
TEL Weaknesses
- Unfavorable valuation multiples (PE 35.0, PB 5.12)
- Neutral profitability ratios (ROE 14.64%, ROIC 8.82% near WACC)
- Moderate asset turnover (0.68)
- No clear innovation or market share data
CLS Weaknesses
- Low net margin (4.44%)
- Unavailable ROIC and WACC data hinder capital efficiency assessment
- Unfavorable valuation multiples (PE 25.47, PB 5.75)
- Neutral liquidity (current ratio 1.49, quick ratio 0.91)
- Zero dividend yield
Both companies show slightly favorable overall financial profiles but with distinct differences. TEL exhibits diversified revenue streams and stronger liquidity, while CLS benefits from higher equity returns and asset efficiency. Valuation multiples remain a caution for both.
The Moat Duel: Analyzing Competitive Defensibility
A structural moat is the only barrier protecting long-term profits from relentless competitive pressures. Here’s how TE Connectivity and Celestica defend their turf:
TE Connectivity Ltd.: Intangible Assets and Global Reach
TE Connectivity’s primary moat stems from its intangible assets and broad global footprint. This manifests in stable gross margins around 35% and a strong EBIT margin near 19%. However, declining ROIC versus WACC signals eroding value, posing risks if innovation or market expansion falters in 2026.
Celestica Inc.: Operational Agility and Growth Momentum
Celestica leverages operational efficiency and rapid revenue growth, evident from 30%+ annual revenue gains and a soaring ROIC trend. Unlike TE, Celestica’s moat is built on agility and scaling advanced technology services, positioning it well for market share gains and disruption opportunities ahead.
Moat Strength: Intangible Assets vs. Growth-Driven Agility
TE Connectivity’s wide moat from intangible assets is undermined by declining profitability, while Celestica’s rapidly growing ROIC signals a strengthening competitive edge. I see Celestica better equipped to defend and expand its market share in 2026.
Which stock offers better returns?
The past year reveals strong gains for both stocks, with CEL outperforming TEL by a wide margin despite recent pullbacks and decelerating momentum in both.
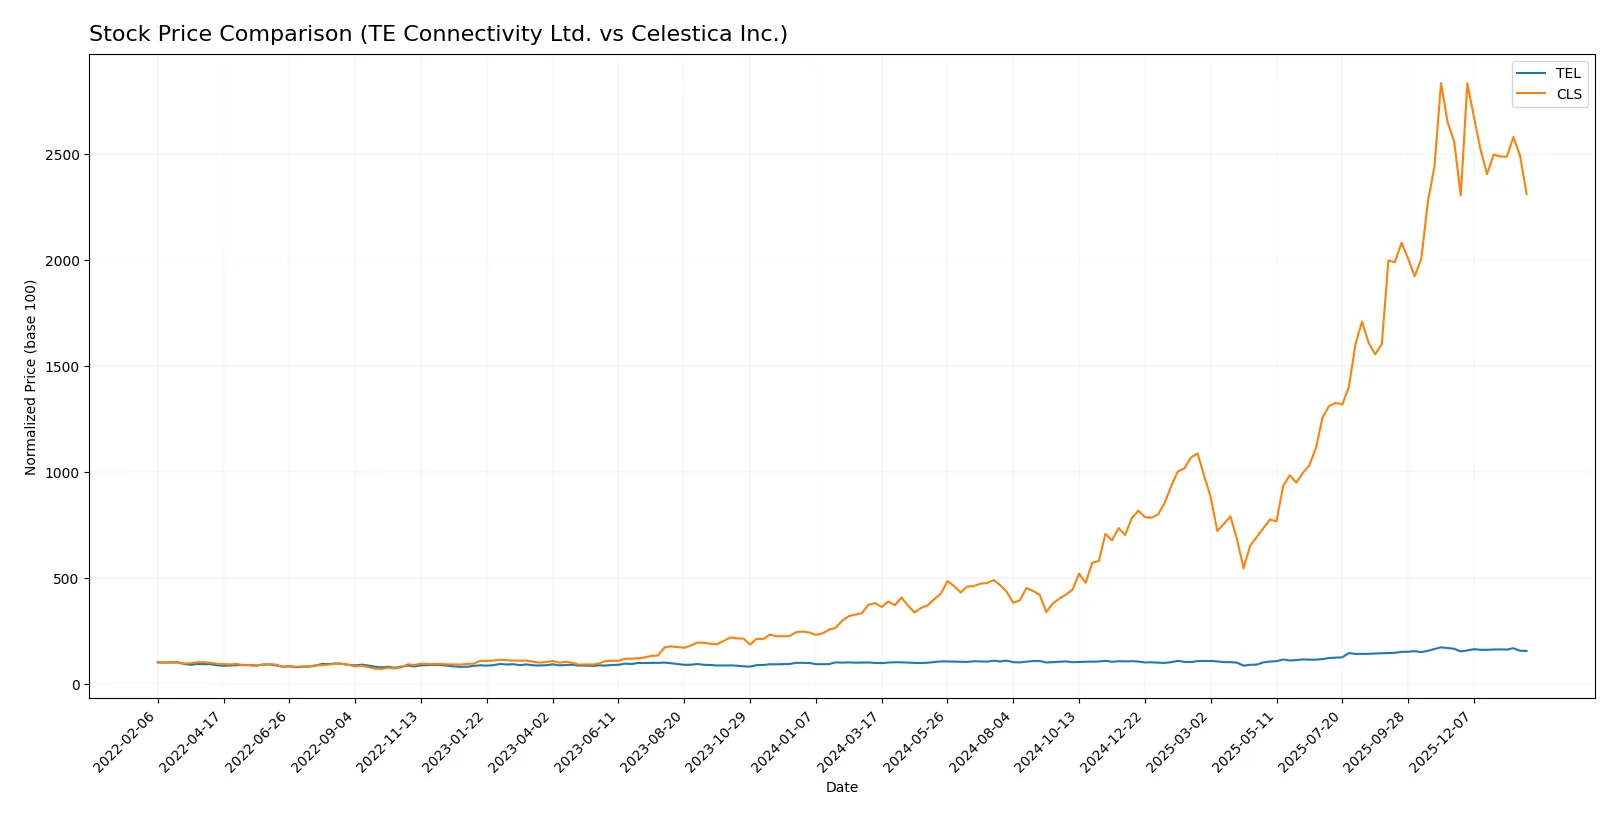
Trend Comparison
TE Connectivity Ltd. (TEL) shows a bullish trend over the past 12 months with a 58.53% gain, though the pace has decelerated recently, reflecting a slight 6.13% drop since November 2025.
Celestica Inc. (CLS) posted a robust 509.52% increase over the last year, also decelerating recently with a sharper 9.61% decline from November 2025 to February 2026.
Comparing both, CLS delivers the highest market performance, significantly outpacing TEL despite both facing recent downward corrections and seller dominance.
Target Prices
Analysts show a moderately bullish consensus for TE Connectivity Ltd. and Celestica Inc., suggesting upside potential relative to current prices.
| Company | Target Low | Target High | Consensus |
|---|---|---|---|
| TE Connectivity Ltd. | 238 | 306 | 270.29 |
| Celestica Inc. | 300 | 440 | 365.6 |
The target consensus for TE Connectivity Ltd. sits roughly 21% above its current price of $223, signaling moderate growth expectations. Celestica Inc.’s consensus price implies a stronger upside near 30%, reflecting greater optimism despite recent volatility.

Don’t Let Luck Decide Your Entry Point
Optimize your entry points with our advanced ProRealTime indicators. You’ll get efficient buy signals with precise price targets for maximum performance. Start outperforming now!
How do institutions grade them?
This section compares recent institutional grades assigned to TE Connectivity Ltd. and Celestica Inc.:
TE Connectivity Ltd. Grades
Here are the latest grades from reputable financial institutions for TE Connectivity Ltd.:
| Grading Company | Action | New Grade | Date |
|---|---|---|---|
| Oppenheimer | Upgrade | Outperform | 2026-01-27 |
| Barclays | Maintain | Overweight | 2026-01-23 |
| Wells Fargo | Maintain | Equal Weight | 2026-01-22 |
| Truist Securities | Maintain | Hold | 2026-01-22 |
| UBS | Maintain | Buy | 2026-01-14 |
Celestica Inc. Grades
Below are recent institutional grades provided for Celestica Inc.:
| Grading Company | Action | New Grade | Date |
|---|---|---|---|
| Citigroup | Maintain | Buy | 2026-01-30 |
| Barclays | Maintain | Overweight | 2026-01-30 |
| Goldman Sachs | Maintain | Buy | 2025-12-01 |
| Barclays | Maintain | Overweight | 2025-11-14 |
| Citigroup | Upgrade | Buy | 2025-11-10 |
Which company has the best grades?
Both companies receive predominantly positive grades. TE Connectivity holds a recent Outperform from Oppenheimer, while Celestica maintains consistent Buy and Overweight ratings. TE Connectivity’s upgrade signals strong momentum, potentially attracting growth-focused investors.
Risks specific to each company
The following categories identify critical pressure points and systemic threats facing TE Connectivity Ltd. and Celestica Inc. in the 2026 market environment:
1. Market & Competition
TE Connectivity Ltd.
- Operates globally in connectivity and sensors with strong segment diversity. Faces mature competition in hardware & parts.
Celestica Inc.
- Focuses on hardware platforms and supply chain solutions, exposed to intense competition and pricing pressures.
2. Capital Structure & Debt
TE Connectivity Ltd.
- Moderate leverage (D/E 0.52), strong interest coverage (42.6x), signaling solid debt management.
Celestica Inc.
- Lower leverage (D/E 0.42) and healthy interest coverage (19.7x) support financial flexibility despite smaller size.
3. Stock Volatility
TE Connectivity Ltd.
- Beta 1.24 implies moderate volatility aligned with technology hardware sector norms.
Celestica Inc.
- Higher beta 1.46 indicates greater stock sensitivity to market swings, increasing risk.
4. Regulatory & Legal
TE Connectivity Ltd.
- Operates across 140 countries with exposure to complex global regulatory environments, increasing compliance costs.
Celestica Inc.
- Global operations in North America, Europe, Asia expose it to multi-jurisdictional regulations and trade policies.
5. Supply Chain & Operations
TE Connectivity Ltd.
- Integrated manufacturing with direct sales supports supply chain control but vulnerable to global disruptions.
Celestica Inc.
- Heavy reliance on supply chain services and component sourcing heightens exposure to operational bottlenecks.
6. ESG & Climate Transition
TE Connectivity Ltd.
- Increasing pressure to meet ESG standards in energy and transportation sectors affects capital allocation.
Celestica Inc.
- ESG initiatives critical due to exposure in aerospace, defense, and energy sectors with growing climate transition risks.
7. Geopolitical Exposure
TE Connectivity Ltd.
- Swiss base with global footprint subjects it to geopolitical tensions impacting supply chains and markets.
Celestica Inc.
- Canadian headquarters and broad geographic sales expose it to North American trade policies and Asia-Pacific risks.
Which company shows a better risk-adjusted profile?
TE Connectivity Ltd. confronts significant geopolitical and regulatory complexity but leverages strong debt metrics and diversified operations for resilience. Celestica Inc. faces heightened stock volatility and supply chain vulnerabilities despite superior ROE and Altman Z-score. Overall, TE Connectivity’s balanced financial stability and operational breadth suggest a better risk-adjusted profile in 2026. The pronounced market volatility in Celestica’s stock (-6.3% recent drop) underscores investor caution amid competitive pressures.
Final Verdict: Which stock to choose?
TE Connectivity’s superpower lies in its operational robustness and consistent cash flow generation, which supports steady dividends and business resilience. However, its declining return on invested capital signals a point of vigilance for value creation over the long term. It fits well in portfolios seeking stable income with moderate growth.
Celestica shines with a strategic moat built on accelerating revenue growth and improving profitability metrics. Its leaner balance sheet and growing ROIC suggest better capital efficiency and scalability compared to TE. This stock suits investors targeting growth with a reasonable margin of safety, blending momentum and value.
If you prioritize stable cash generation and income, TE Connectivity is the compelling choice due to its operational efficiency and favorable income statement. However, if you seek growth driven by improving returns and expanding revenue, Celestica offers better scalability and a more dynamic growth profile despite higher volatility. Both present analytical scenarios aligned with distinct investor risk tolerances.
Disclaimer: Investment carries a risk of loss of initial capital. The past performance is not a reliable indicator of future results. Be sure to understand risks before making an investment decision.
Go Further
I encourage you to read the complete analyses of TE Connectivity Ltd. and Celestica Inc. to enhance your investment decisions: