Home > Comparison > Technology > CLS vs SANM
The rivalry between Celestica Inc. and Sanmina Corporation shapes the competitive dynamics of the technology hardware sector. Celestica operates as a diversified hardware platform and supply chain solutions provider, focusing on advanced technology and cloud connectivity. Sanmina emphasizes integrated manufacturing solutions and component services with a broader industrial and defense orientation. This analysis weighs their contrasting operational models to identify which offers superior risk-adjusted returns for a diversified portfolio in 2026.
Table of contents
Companies Overview
Celestica and Sanmina stand as pivotal players in the global hardware manufacturing and supply chain sector.
Celestica Inc.: Advanced Hardware & Supply Chain Solutions
Celestica dominates as a provider of hardware platforms and supply chain services across North America, Europe, and Asia. Its core revenue stems from manufacturing, engineering, and logistics for sectors like aerospace, defense, healthtech, and cloud providers. In 2026, Celestica focuses strategically on expanding its Advanced Technology and Connectivity & Cloud Solutions segments to capture growth in digital infrastructure.
Sanmina Corporation: Integrated Manufacturing & Component Solutions
Sanmina serves as a global leader in integrated manufacturing and component production with a broad footprint in industrial, medical, defense, and cloud industries. Its revenue engine revolves around design, prototyping, assembly, and after-market services for OEMs worldwide. In 2026, Sanmina prioritizes innovation in interconnect systems and cloud-based manufacturing execution software to enhance operational efficiency.
Strategic Collision: Similarities & Divergences
Both companies compete fiercely in hardware manufacturing and supply chain services but diverge in their business philosophies. Celestica emphasizes advanced technology integration and cloud connectivity, while Sanmina leans on a broader product scope including precision components and software solutions. Their primary battleground is the expanding digital infrastructure market. Investment profiles differ as Celestica targets specialized tech growth, whereas Sanmina offers diversified manufacturing exposure.
Income Statement Comparison
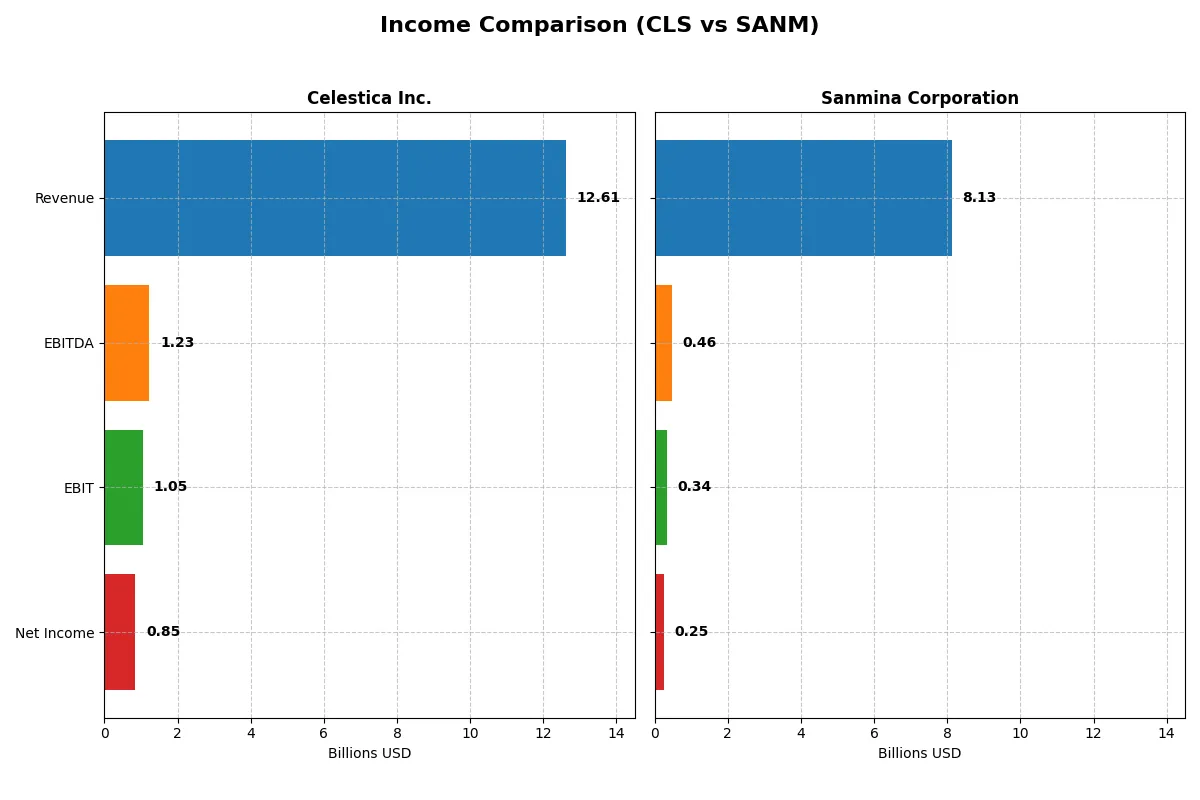
This data dissects the core profitability and scalability of both corporate engines to reveal who dominates the bottom line:
| Metric | Celestica Inc. (CLS) | Sanmina Corporation (SANM) |
|---|---|---|
| Revenue | 12.6B | 8.13B |
| Cost of Revenue | 11.1B | 7.41B |
| Operating Expenses | 385M | 362M |
| Gross Profit | 1.47B | 716M |
| EBITDA | 1.23B | 463M |
| EBIT | 1.05B | 344M |
| Interest Expense | 54M | 4.3M |
| Net Income | 847M | 246M |
| EPS | 7.22 | 4.56 |
| Fiscal Year | 2025 | 2025 |
Income Statement Analysis: The Bottom-Line Duel
This income statement comparison reveals which company converts revenue into profit most efficiently, exposing the true strength of their business models.
Celestica Inc. Analysis
Celestica’s revenue surged from 5.6B in 2021 to over 12.6B in 2025, with net income jumping from 104M to 847M. Its gross margin hovers around 11.7%, while net margin improves to 6.7%, signaling robust profitability. The 2025 figures highlight accelerating momentum and operational leverage, with EBIT soaring 80% year-over-year.
Sanmina Corporation Analysis
Sanmina’s revenue grew moderately to 8.1B in 2025 from 6.7B in 2021, but net income declined slightly, settling at 246M in 2025. Gross margin stands at 8.8%, and net margin lags at 3.0%, reflecting tighter profitability. Operating income dipped marginally in 2025, indicating challenges in scaling expense control alongside revenue growth.
Margin Power vs. Revenue Scale
Celestica dominates with a higher growth trajectory, stronger margins, and accelerating profitability. Sanmina shows stable but subdued expansion and weaker margin profiles. For investors, Celestica’s profile offers more compelling earnings momentum and margin improvement potential in this sector’s current cycle.
Financial Ratios Comparison
These vital ratios act as a diagnostic tool to expose the underlying fiscal health, valuation premiums, and capital efficiency of the companies compared below:
| Ratios | Celestica Inc. (CLS) | Sanmina Corporation (SANM) |
|---|---|---|
| ROE | 22.57% | 10.45% |
| ROIC | 16.10% | 9.04% |
| P/E | 25.47 | 25.59 |
| P/B | 5.75 | 2.67 |
| Current Ratio | 1.49 | 1.99 |
| Quick Ratio | 0.91 | 1.25 |
| D/E (Debt to Equity) | 0.42 | 0.17 |
| Debt-to-Assets | 13.30% | 6.73% |
| Interest Coverage | 11.50 | 82.53 |
| Asset Turnover | 1.61 | 1.57 |
| Fixed Asset Turnover | 14.58 | 10.91 |
| Payout ratio | 0 | 0 |
| Dividend yield | 0 | 0 |
| Fiscal Year | 2024 | 2024 |
Efficiency & Valuation Duel: The Vital Signs
Financial ratios serve as a company’s DNA, revealing hidden risks and operational excellence that raw numbers alone cannot capture.
Celestica Inc.
Celestica posts a strong ROE of 22.57%, signaling efficient equity use, but a thin net margin of 4.44% flags profitability challenges. The stock trades at a stretched P/E of 25.47 and a high P/B of 5.75, indicating premium valuation. With no dividends, the company prioritizes reinvestment, focusing on growth and R&D.
Sanmina Corporation
Sanmina shows moderate profitability with a 10.45% ROE and a slimmer net margin at 3.03%. Its valuation is similarly stretched, with a P/E of 25.59 but a more reasonable P/B of 2.67. The firm returns value through solid balance sheet health and reinvests earnings into operations, signaling a cautious but growth-oriented capital allocation.
Premium Valuation vs. Operational Safety
Celestica offers higher profitability but at a costlier valuation and lacks direct shareholder payouts. Sanmina balances moderate returns with stronger liquidity and lower leverage. Investors seeking aggressive growth may prefer Celestica’s profile; more risk-averse investors might lean toward Sanmina’s financial stability.
Which one offers the Superior Shareholder Reward?
Celestica and Sanmina both forgo dividends, prioritizing capital reinvestment and buybacks. Celestica’s 2024 free cash flow per share stands at 2.57 with no dividends but modest buyback activity. Sanmina’s 2025 free cash flow per share is much higher at 8.58, also without dividends, but it runs a more aggressive buyback program. Sanmina’s superior free cash flow and stronger cash ratios support a more sustainable buyback-driven return. I see Sanmina offering a better total shareholder return profile in 2026 due to its robust cash generation and disciplined capital allocation.
Comparative Score Analysis: The Strategic Profile
The radar chart reveals the fundamental DNA and trade-offs of Celestica Inc. and Sanmina Corporation, highlighting their core financial strengths and vulnerabilities:
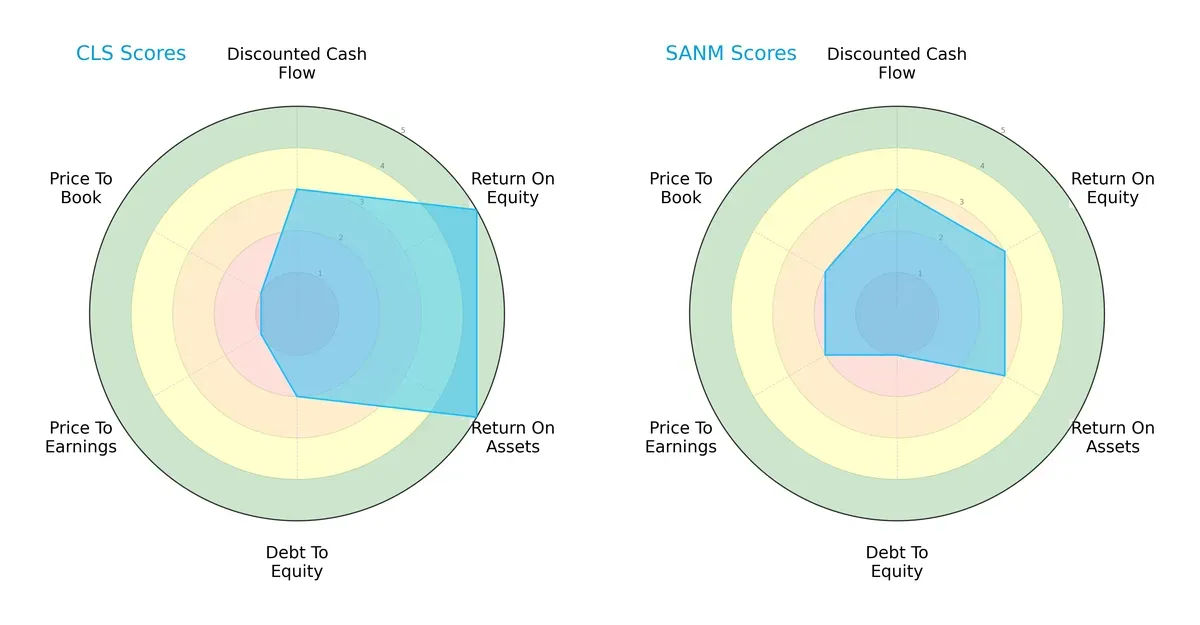
Celestica exhibits superior operational efficiency with higher ROE (5 vs. 3) and ROA (5 vs. 3) scores, signaling stronger profit generation and asset utilization. Sanmina lags in financial stability, reflected by a weaker debt-to-equity score (1 vs. 2). Celestica’s valuation scores (PE/PB) are very unfavorable (1 each), indicating potential overvaluation risks. Sanmina, while more moderately priced, suffers from a less balanced profile, relying on modest DCF and profitability metrics.
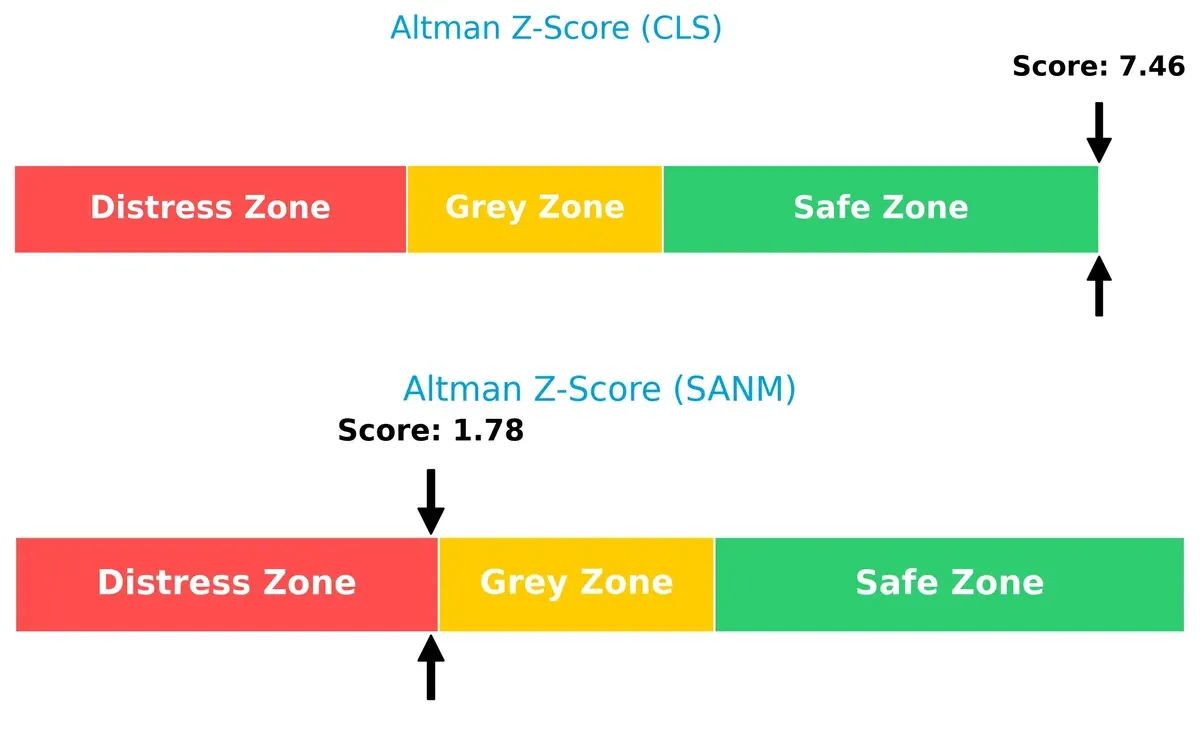
Bankruptcy Risk: Solvency Showdown
Celestica’s Altman Z-Score (7.46) firmly places it in the safe zone, suggesting robust long-term survival prospects. Sanmina’s score (1.78) teeters on the distress zone threshold, signaling elevated bankruptcy risk in this economic cycle:
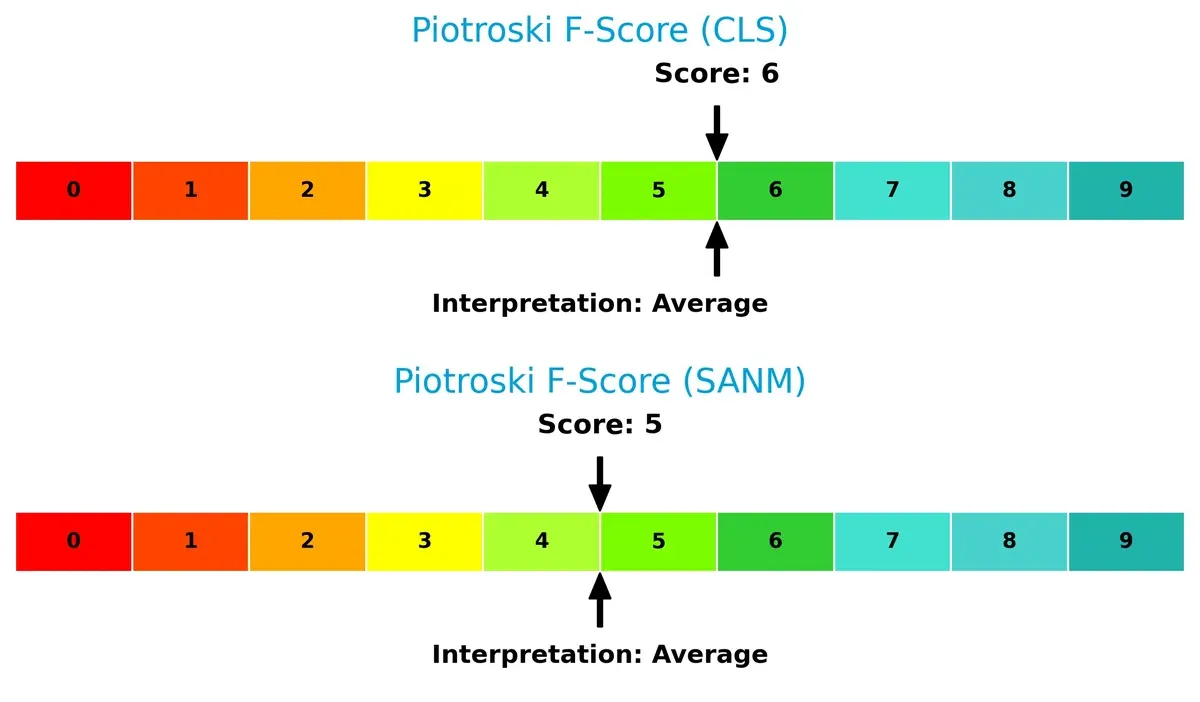
Financial Health: Quality of Operations
Celestica leads slightly with a Piotroski F-Score of 6, indicating average financial health and operational strength. Sanmina’s score of 5 also reflects average health but hints at subtle internal weaknesses compared to its peer:
How are the two companies positioned?
This section dissects the operational DNA of CLS and SANM by comparing their revenue distribution and internal strengths and weaknesses. The goal is to confront their economic moats to identify which model offers a more resilient, sustainable competitive advantage today.
Revenue Segmentation: The Strategic Mix
This visual comparison dissects how Celestica Inc. and Sanmina Corporation diversify their income streams and where their primary sector bets lie:
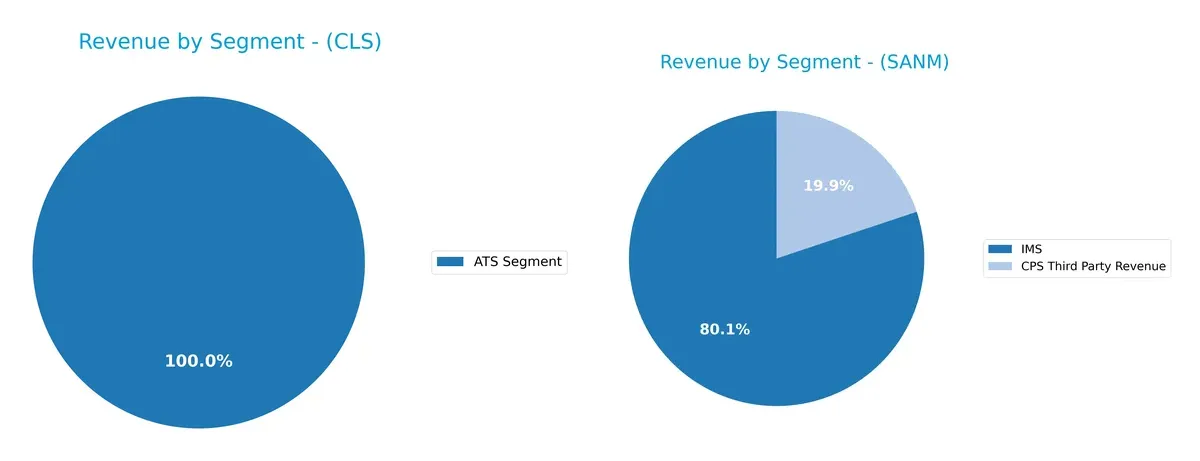
Celestica’s revenue anchors entirely on its ATS Segment at $3.16B, showing a focused but concentrated business model. Sanmina diversifies across IMS at $6.51B and CPS Third Party Revenue at $1.62B, revealing a more balanced portfolio. Sanmina’s mix reduces concentration risk and signals strength in integrated manufacturing services, while Celestica’s single-segment reliance exposes it to higher volatility from sector-specific shifts.
Strengths and Weaknesses Comparison
The following tables compare the strengths and weaknesses of Celestica Inc. and Sanmina Corporation based on key financial and business criteria:
Celestica Strengths
- Strong ROE at 22.57% indicates efficient equity use
- Favorable debt-to-equity ratio (0.42) and low debt-to-assets (13.3%)
- High interest coverage (19.69)
- Superior asset turnover (1.61) and fixed asset turnover (14.58)
Sanmina Strengths
- Higher proportion of favorable ratios (50%)
- Strong current (1.72) and quick ratios (1.02) show liquidity strength
- Very high interest coverage (80.01)
- Low debt-to-equity (0.17) and debt-to-assets (6.73%)
- Diversified revenue streams over multiple segments and regions
Celestica Weaknesses
- Unfavorable net margin at 4.44%
- Unfavorable valuation multiples (PE 25.47, PB 5.75)
- Lack of dividend yield
- Neutral liquidity ratios (current 1.49, quick 0.91)
- Unavailable ROIC and WACC hinder capital efficiency analysis
Sanmina Weaknesses
- Lower net margin (3.03%) and neutral ROE (10.45%) and ROIC (9.04%)
- Unfavorable PE ratio (25.59)
- Neutral PB ratio (2.67)
- No dividend yield
- Higher neutral ratio count (28.57%) indicates mixed financial signals
Overall, both companies show slightly favorable financial profiles but differ in key areas. Celestica excels in profitability ratios and asset efficiency, while Sanmina demonstrates stronger liquidity and lower leverage. These contrasts suggest distinct strategic focuses on capital structure and operational efficiency.
The Moat Duel: Analyzing Competitive Defensibility
A structural moat is the only true shield for long-term profits against relentless competitive pressures. Here’s how two hardware manufacturing leaders compare:
Celestica Inc.: Growth-Driven Operational Excellence
Celestica’s moat stems from superior supply chain integration and advanced technology solutions. This drives strong margin expansion and 300% ROIC growth over five years. New cloud and aerospace markets could deepen its advantage in 2026.
Sanmina Corporation: Broad Manufacturing Footprint with Margin Pressure
Sanmina relies on diversified manufacturing scale across regions, contrasting Celestica’s tech focus. However, its declining ROIC and shrinking margin signal weakening competitive positioning. Expansion into emerging markets offers moderate growth potential.
Operational Efficiency vs. Scale Complexity
Celestica exhibits a deeper, more durable moat through operational efficiency and innovation, while Sanmina struggles with value creation and margin erosion. Celestica is better positioned to defend and grow its market share in the evolving hardware sector.
Which stock offers better returns?
Both Celestica Inc. and Sanmina Corporation showed significant price gains over the past year, with distinct trading volumes and recent downward shifts in their stock trends.
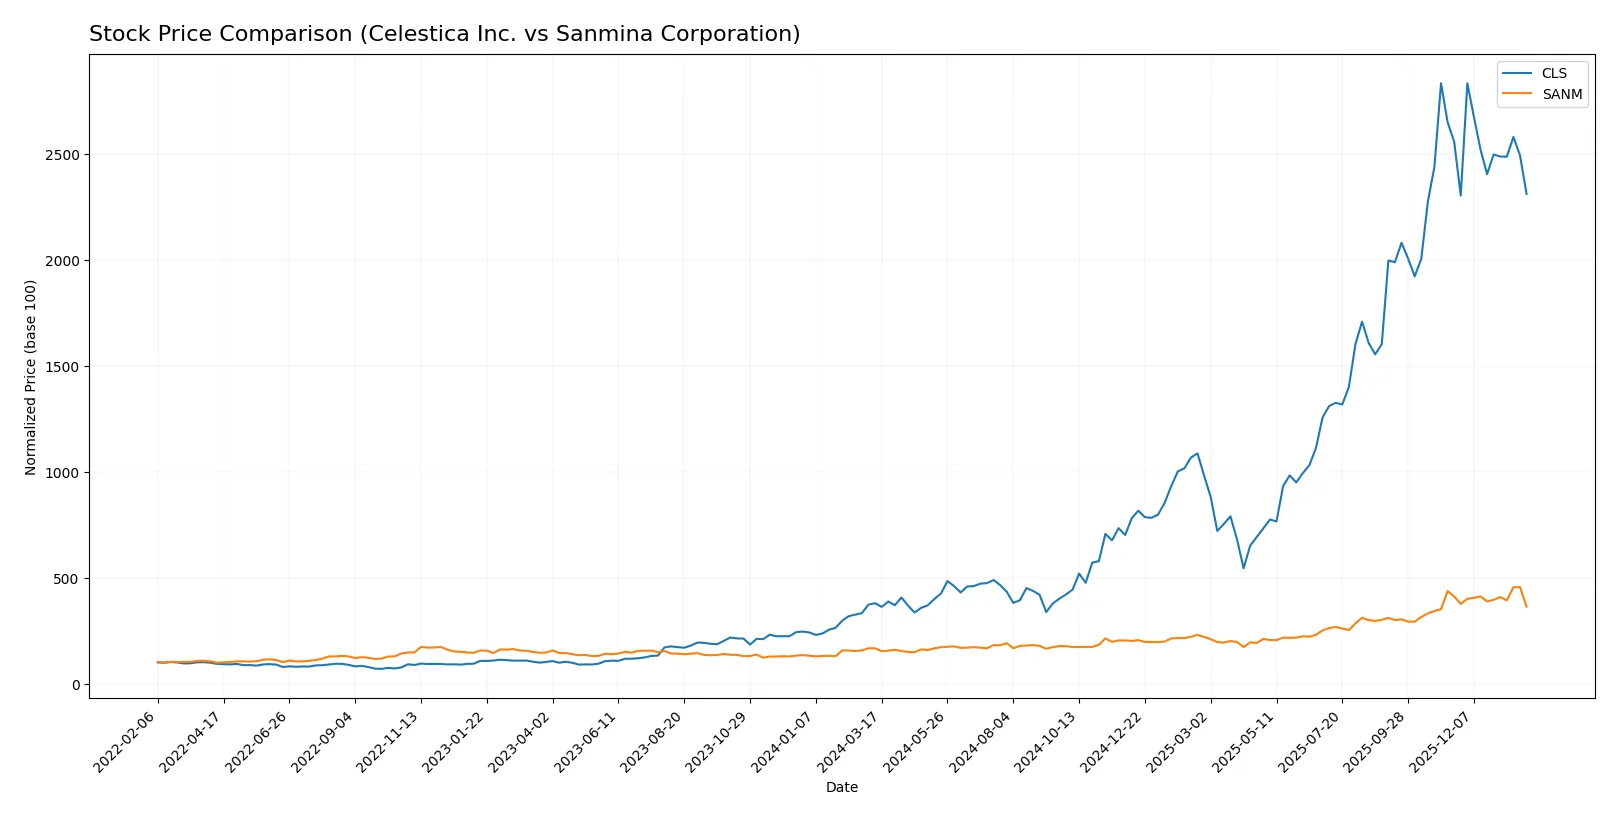
Trend Comparison
Celestica Inc. delivered a strong bullish trend over 12 months with a 510% gain, despite recent deceleration and a 9.6% drop in the last 2.5 months. Volatility remains high with a 92.63 standard deviation.
Sanmina Corporation’s stock rose 118% over the past year, also bullish but decelerating. Recent months saw an 11.7% decline, though with a mild positive trend slope and lower volatility at 31.84 standard deviation.
Celestica outperformed Sanmina substantially in total returns despite higher recent volatility and volume dominance by sellers in both stocks during the latest period.
Target Prices
Analysts present a cautiously optimistic outlook with clear upside potential for both Celestica Inc. and Sanmina Corporation.
| Company | Target Low | Target High | Consensus |
|---|---|---|---|
| Celestica Inc. | 300 | 440 | 365.6 |
| Sanmina Corporation | 200 | 200 | 200 |
Celestica’s target consensus sits approximately 30% above its current 281 price, signaling potential growth. Sanmina’s consensus target of 200 suggests a 41% upside from its current 142 price.

Don’t Let Luck Decide Your Entry Point
Optimize your entry points with our advanced ProRealTime indicators. You’ll get efficient buy signals with precise price targets for maximum performance. Start outperforming now!
How do institutions grade them?
The following tables summarize institutional grades for Celestica Inc. and Sanmina Corporation:
Celestica Inc. Grades
This table lists recent grades and actions from major grading companies for Celestica Inc.
| Grading Company | Action | New Grade | Date |
|---|---|---|---|
| Citigroup | Maintain | Buy | 2026-01-30 |
| Barclays | Maintain | Overweight | 2026-01-30 |
| Goldman Sachs | Maintain | Buy | 2025-12-01 |
| Barclays | Maintain | Overweight | 2025-11-14 |
| Citigroup | Upgrade | Buy | 2025-11-10 |
| Goldman Sachs | Maintain | Buy | 2025-10-29 |
| CIBC | Maintain | Outperform | 2025-10-29 |
| Stifel | Maintain | Buy | 2025-10-29 |
| Barclays | Maintain | Overweight | 2025-10-29 |
| JP Morgan | Maintain | Overweight | 2025-10-29 |
Sanmina Corporation Grades
This table shows recent grades and actions from recognized grading companies for Sanmina Corporation.
| Grading Company | Action | New Grade | Date |
|---|---|---|---|
| Argus Research | Maintain | Buy | 2026-01-28 |
| B of A Securities | Maintain | Neutral | 2025-07-11 |
| B of A Securities | Maintain | Neutral | 2025-06-09 |
| B of A Securities | Upgrade | Neutral | 2025-01-29 |
| Craig-Hallum | Maintain | Hold | 2024-11-05 |
| Craig-Hallum | Downgrade | Hold | 2024-04-30 |
| Sidoti & Co. | Upgrade | Buy | 2022-11-08 |
| Sidoti & Co. | Upgrade | Buy | 2022-11-07 |
| Sidoti & Co. | Downgrade | Neutral | 2022-10-31 |
| Sidoti & Co. | Downgrade | Neutral | 2022-10-30 |
Which company has the best grades?
Celestica Inc. consistently receives “Buy,” “Outperform,” and “Overweight” grades from top-tier firms. Sanmina Corporation’s grades range mostly between “Neutral” and “Buy,” with recent downgrades. Celestica’s stronger ratings may signal higher institutional confidence, potentially influencing investor sentiment more positively.
Risks specific to each company
The following categories identify the critical pressure points and systemic threats facing both firms in the 2026 market environment:
1. Market & Competition
Celestica Inc.
- Faces intense competition in hardware and supply chain solutions, pressured by innovation cycles and margin compression.
Sanmina Corporation
- Competes globally with diversified manufacturing services, challenged by pricing pressures and technology shifts.
2. Capital Structure & Debt
Celestica Inc.
- Maintains a moderate debt-to-equity ratio of 0.42, indicating balanced leverage and solid interest coverage.
Sanmina Corporation
- Lower debt-to-equity at 0.17, signaling a more conservative capital structure and stronger financial stability.
3. Stock Volatility
Celestica Inc.
- Exhibits higher beta at 1.463, reflecting greater sensitivity to market swings and elevated risk.
Sanmina Corporation
- Beta of 1.049 suggests more stable stock behavior and reduced volatility risk.
4. Regulatory & Legal
Celestica Inc.
- Operates across North America, Europe, Asia; must navigate complex compliance and trade regulations.
Sanmina Corporation
- US-based with global reach, exposed to evolving industry-specific regulations and export controls.
5. Supply Chain & Operations
Celestica Inc.
- Relies on global supply chains; risks include component shortages and logistical disruptions.
Sanmina Corporation
- Faces similar supply chain risks; manages high operational complexity across multiple sectors.
6. ESG & Climate Transition
Celestica Inc.
- Increasing pressure to meet ESG standards; must invest in sustainable manufacturing practices.
Sanmina Corporation
- ESG compliance critical; faces scrutiny on environmental impact and energy efficiency initiatives.
7. Geopolitical Exposure
Celestica Inc.
- Exposure to North American and Asian markets with geopolitical tensions impacting supply continuity.
Sanmina Corporation
- US headquarters with significant global operations; vulnerable to trade disputes and tariffs.
Which company shows a better risk-adjusted profile?
Sanmina faces its most significant risk in capital structure with potential strain from debt despite low leverage. Celestica’s greatest threat lies in market volatility amplified by higher beta. Sanmina’s conservative leverage and lower beta yield a better risk-adjusted profile. Recent data show Celestica’s stock price dropped 6.3% with elevated volatility, underscoring my caution on market sensitivity.
Final Verdict: Which stock to choose?
Celestica Inc. (CLS) shines as a cash-generating powerhouse with a robust return on equity and a clear upward trajectory in profitability. Its efficient asset use and improving income growth highlight a dynamic growth machine. A point of vigilance remains its premium valuation multiples, which demand careful timing. CLS suits aggressive growth portfolios aiming for market outperformance.
Sanmina Corporation (SANM) stands out with its solid balance sheet and lower leverage, offering a safer investment profile. Its strategic moat lies in consistent operational stability and cash flow quality, though slower growth and a declining ROIC trend temper upside potential. SANM fits well within GARP portfolios seeking steady growth paired with financial resilience.
If you prioritize aggressive expansion and superior capital efficiency, Celestica Inc. appears the compelling choice due to its strong growth momentum and high return on equity. However, if you seek better stability with moderate growth and lower financial risk, Sanmina offers a more balanced profile despite its subdued profitability trend. Both scenarios carry risks and require alignment with your investment horizon and risk appetite.
Disclaimer: Investment carries a risk of loss of initial capital. The past performance is not a reliable indicator of future results. Be sure to understand risks before making an investment decision.
Go Further
I encourage you to read the complete analyses of Celestica Inc. and Sanmina Corporation to enhance your investment decisions: