Home > Comparison > Technology > SNDK vs CLS
The strategic rivalry between Sandisk Corporation and Celestica Inc. shapes the technology hardware sector’s future. Sandisk focuses on high-margin, innovation-driven storage solutions, while Celestica operates as a capital-intensive contract manufacturer offering diversified supply chain services. This head-to-head pits specialized product leadership against broad operational scale. This analysis aims to identify which corporate trajectory delivers superior risk-adjusted returns for a diversified portfolio amid evolving industry dynamics.
Table of contents
Companies Overview
Sandisk Corporation and Celestica Inc. are pivotal players in the hardware and equipment sector, driving innovation and supply chain excellence.
Sandisk Corporation: Leader in Flash Storage Solutions
Sandisk dominates the NAND flash storage market, generating revenue primarily through solid state drives, embedded products, and removable cards. Its strategic focus in 2026 centers on advancing flash memory technology and expanding product offerings that serve data-intensive applications. Headquartered in Milpitas, CA, Sandisk leverages its deep expertise to sustain a competitive edge in storage innovation.
Celestica Inc.: Integrated Supply Chain Innovator
Celestica excels in providing hardware platform and supply chain solutions across global markets, spanning advanced technology and connectivity segments. The company’s revenue derives from manufacturing, engineering, and after-market services for complex electronic systems. In 2026, Celestica prioritizes enhancing its supply chain agility and broadening its footprint in aerospace, defense, and cloud infrastructure sectors, anchored in Toronto, Canada.
Strategic Collision: Similarities & Divergences
Both companies operate within hardware but pursue distinct models: Sandisk focuses on proprietary flash storage innovation, while Celestica emphasizes flexible, end-to-end supply chain services. The core battleground lies in serving high-demand technology markets where speed and reliability matter most. Their investment profiles diverge sharply—Sandisk offers concentrated exposure to storage tech, whereas Celestica provides diversified industrial and tech sector solutions.
Income Statement Comparison
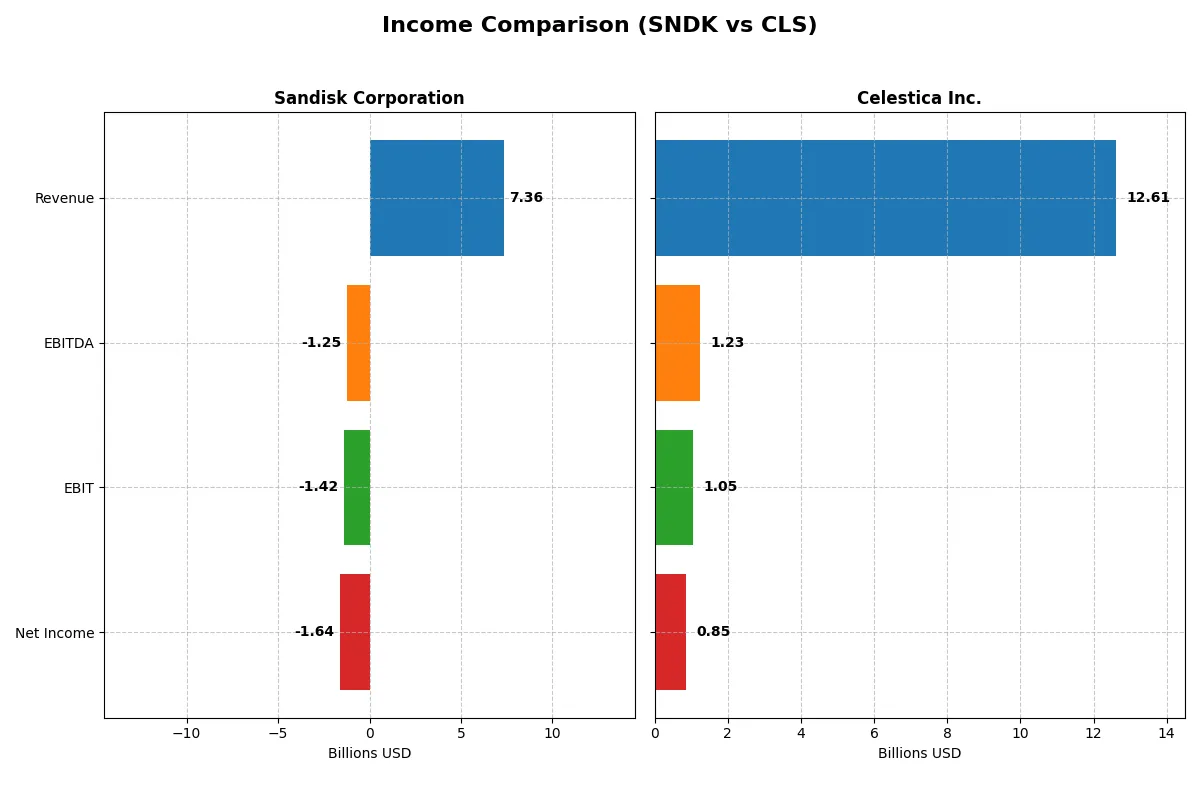
This data dissects the core profitability and scalability of both corporate engines to reveal who dominates the bottom line:
| Metric | Sandisk Corporation (SNDK) | Celestica Inc. (CLS) |
|---|---|---|
| Revenue | 7.36B | 12.61B |
| Cost of Revenue | 5.14B | 11.13B |
| Operating Expenses | 3.59B | 385M |
| Gross Profit | 2.21B | 1.47B |
| EBITDA | -1.25B | 1.23B |
| EBIT | -1.42B | 1.05B |
| Interest Expense | 63M | 54M |
| Net Income | -1.64B | 847M |
| EPS | -11.32 | 7.22 |
| Fiscal Year | 2025 | 2025 |
Income Statement Analysis: The Bottom-Line Duel
This income statement comparison exposes the true efficiency and profitability trends of two corporate engines over recent years.
Sandisk Corporation Analysis
Sandisk’s revenue slipped from 9.75B in 2022 to 7.35B in 2025, marking a 25% decline. Net income turned sharply negative, falling from 1.06B profit in 2022 to a 1.64B loss in 2025. Despite a favorable gross margin of 30%, heavy operating expenses and other costs dragged EBIT and net margins deeply negative, revealing deteriorating operational efficiency.
Celestica Inc. Analysis
Celestica delivered robust growth, with revenue climbing from 5.63B in 2021 to 12.6B in 2025, more than doubling. Net income surged from 104M to 847M over the same period, supported by a steady gross margin near 12% and improving EBIT margin at 8.4%. The consistent expansion in margins and profits demonstrates operational momentum and capital allocation discipline.
Verdict: Margin Power vs. Revenue Scale
Celestica clearly outperforms Sandisk with strong revenue growth and positive margins, reflecting better operational control and profit generation. Sandisk’s steep income deterioration and sustained losses mark fundamental weakness. For investors, Celestica’s profile offers stable earnings growth, while Sandisk’s challenges signal caution and risk.
Financial Ratios Comparison
These vital ratios act as a diagnostic tool to expose the underlying fiscal health, valuation premiums, and capital efficiency of the companies compared below:
| Ratios | Sandisk Corporation (SNDK) | Celestica Inc. (CLS) |
|---|---|---|
| ROE | -17.8% (2025) | 22.6% (2024) |
| ROIC | -11.9% (2025) | 16.1% (2024) |
| P/E | -4.17 (2025) | 25.5 (2024) |
| P/B | 0.74 (2025) | 5.75 (2024) |
| Current Ratio | 3.56 (2025) | 1.49 (2024) |
| Quick Ratio | 2.11 (2025) | 0.91 (2024) |
| D/E | 0.22 (2025) | 0.42 (2024) |
| Debt-to-Assets | 15.7% (2025) | 13.3% (2024) |
| Interest Coverage | -21.9 (2025) | 11.5 (2024) |
| Asset Turnover | 0.57 (2025) | 1.61 (2024) |
| Fixed Asset Turnover | 11.9 (2025) | 14.6 (2024) |
| Payout ratio | 0% (2025) | 0% (2024) |
| Dividend yield | 0% (2025) | 0% (2024) |
| Fiscal Year | 2025 | 2024 |
Efficiency & Valuation Duel: The Vital Signs
Financial ratios serve as a company’s DNA, revealing hidden risks and operational strengths that surface beyond headline figures.
Sandisk Corporation
Sandisk shows deeply negative profitability with ROE at -17.81% and net margin at -22.31%, signaling operational distress. Its valuation is attractive with a P/E of -4.17 and P/B of 0.74, indicating the stock is undervalued or distressed. The company pays no dividends, instead funneling resources into R&D, dedicating 15.4% of revenue to innovation.
Celestica Inc.
Celestica records solid profitability with a strong ROE of 22.57% despite a modest net margin of 4.44%. Its valuation is stretched, trading at a P/E of 25.47 and P/B of 5.75, reflecting market optimism. The firm returns no dividends, favoring reinvestment into growth and maintaining a healthy asset turnover of 1.61, suggesting operational efficiency.
Valuation Caution vs. Profitability Strength
Celestica offers superior profitability and operational efficiency at a premium valuation, while Sandisk’s undervaluation masks significant profitability challenges. Investors seeking growth with operational resilience may prefer Celestica, whereas those tolerating risk for potential turnaround value might consider Sandisk’s profile.
Which one offers the Superior Shareholder Reward?
Sandisk Corporation (SNDK) and Celestica Inc. (CLS) both abstain from dividends, focusing on reinvestment and buybacks. I observe SNDK’s zero dividend yield but negative free cash flow (-0.8/share in 2025) signals weak buyback capacity. CLS shows positive free cash flow (2.6/share in 2024) supporting moderate buybacks. CLS’s payout is zero, yet operating margins (6%) and asset turnover (1.61x) outpace SNDK’s negative margins and 0.57x turnover. CLS’s stronger cash flow sustainability and prudent leverage (debt-to-equity 0.42 vs. SNDK’s 0.22) imply a more robust distribution model. I conclude CLS offers a superior total shareholder return profile in 2026 due to healthier cash flow and sustainable buyback potential.
Comparative Score Analysis: The Strategic Profile
The radar chart reveals the fundamental DNA and trade-offs of Sandisk Corporation and Celestica Inc., highlighting key financial strengths and weaknesses:
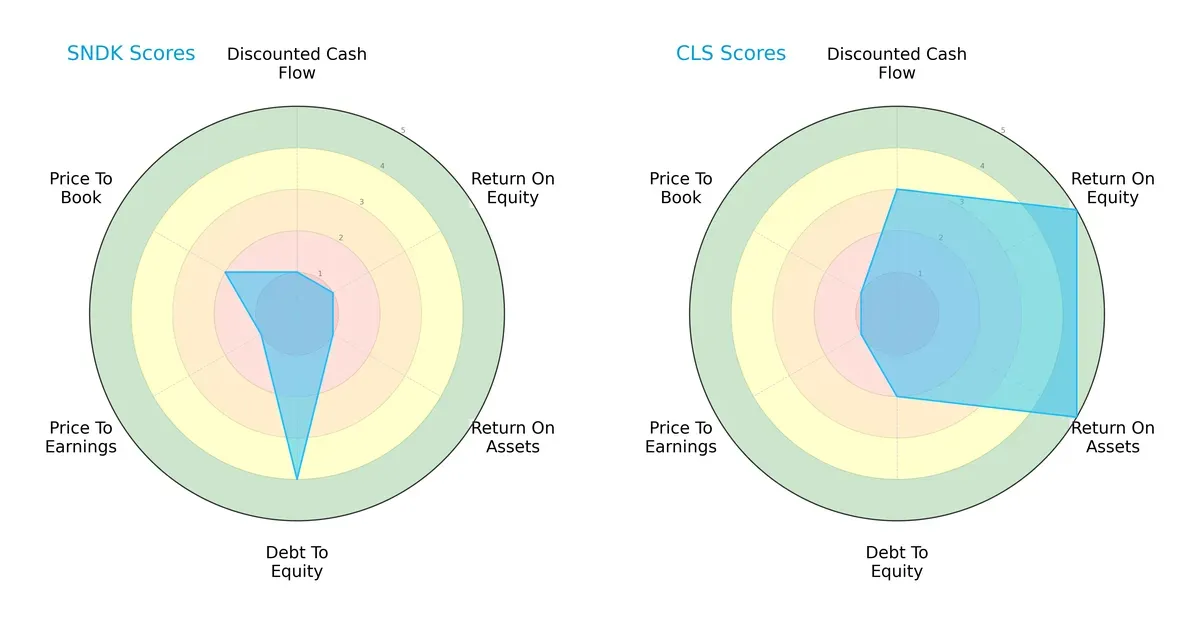
Celestica outperforms Sandisk in operational efficiency, boasting very favorable ROE and ROA scores (5 vs. 1). Sandisk’s balance sheet strength shows in its superior debt-to-equity score (4 vs. 2), reflecting lower leverage risk. However, both suffer from weak valuation metrics, with low P/E and P/B scores signaling potential overvaluation or market skepticism. Overall, Celestica offers a more balanced profile driven by operational excellence, while Sandisk leans on financial conservatism.
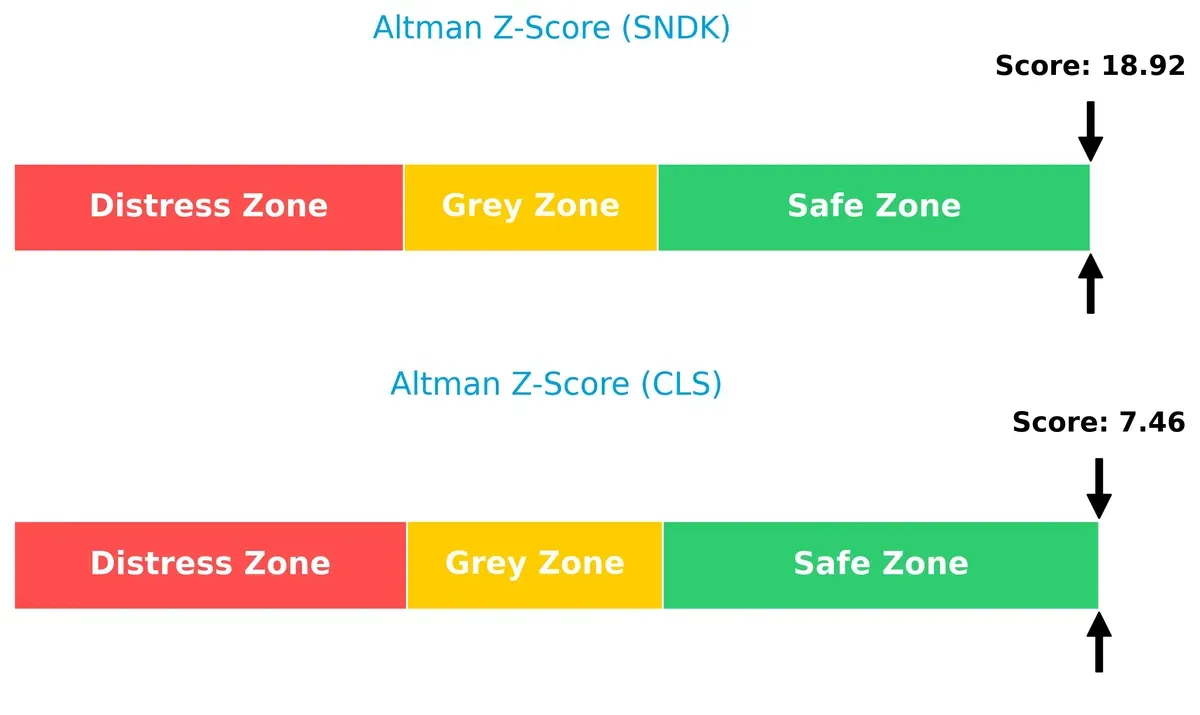
Bankruptcy Risk: Solvency Showdown
The Altman Z-Scores place both firms firmly in the safe zone, with Sandisk scoring 18.9 and Celestica 7.5, indicating robust solvency and low bankruptcy risk in this cycle:
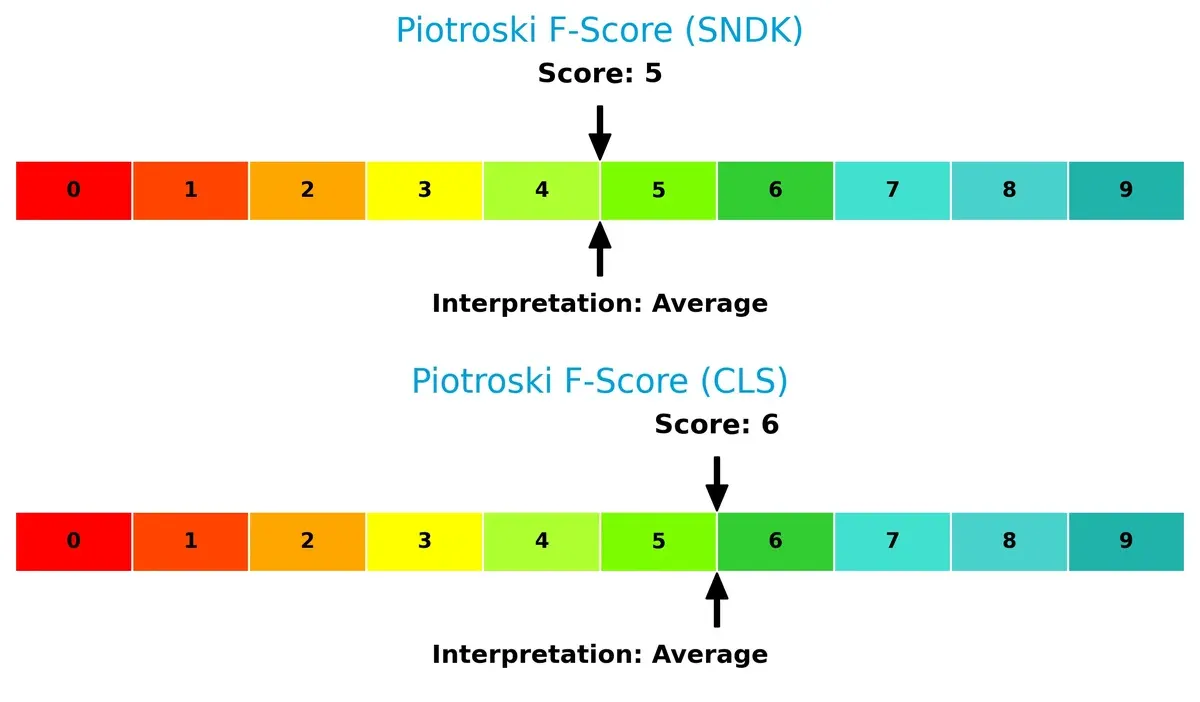
Financial Health: Quality of Operations
Sandisk and Celestica exhibit average Piotroski F-Scores of 5 and 6 respectively, signaling moderate financial health without glaring red flags. Celestica’s slight edge suggests marginally better internal metrics and operational quality:
How are the two companies positioned?
This section dissects Sandisk and Celestica’s operational DNA by comparing their revenue distribution and internal dynamics. The goal is to confront their economic moats and identify which model offers the most resilient, sustainable advantage today.
Revenue Segmentation: The Strategic Mix
This visual comparison dissects how Sandisk Corporation and Celestica Inc. diversify their income streams and where their primary sector bets lie:
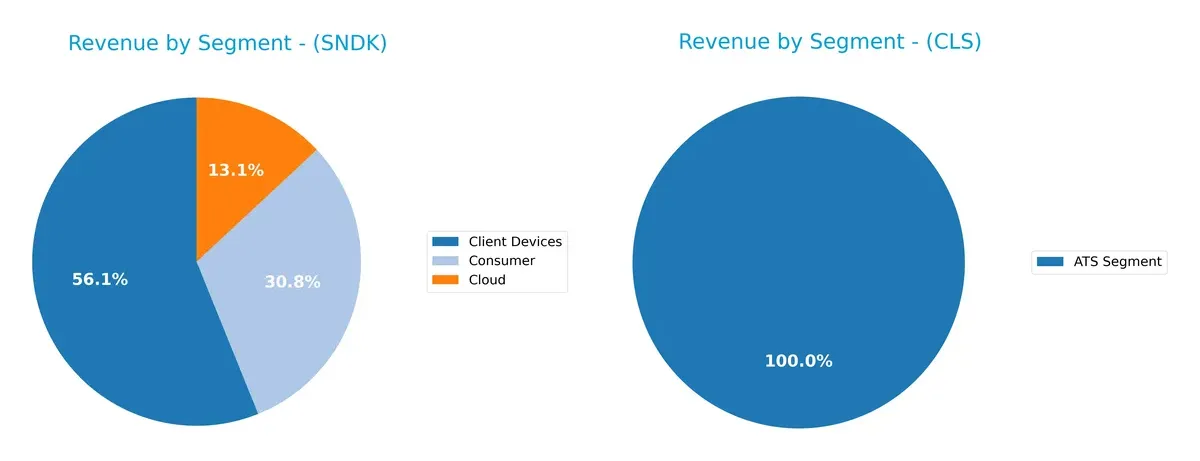
Sandisk dominates with a diversified portfolio: $4.13B in Client Devices, $2.27B Consumer, and $960M Cloud revenues spread risk across markets. Celestica anchors $3.16B solely in the ATS Segment, exposing itself to concentration risk. Sandisk’s mix signals ecosystem lock-in and broad market reach. Celestica’s reliance on one segment suggests infrastructure dominance but less strategic flexibility in volatile cycles.
Strengths and Weaknesses Comparison
This table compares the Strengths and Weaknesses of Sandisk Corporation and Celestica Inc.:
Sandisk Corporation Strengths
- Diverse revenue streams in Client Devices, Consumer, Cloud segments
- Strong geographic presence across China, US, EMEA, and Asia
- Favorable debt-to-assets and debt-to-equity ratios
- High fixed asset turnover indicating asset efficiency
Celestica Inc. Strengths
- Favorable ROE of 22.57% signaling strong profitability
- Solid interest coverage ratio at 19.69
- Higher asset turnover shows efficient use of assets
- Favorable debt ratios with lower debt-to-assets
- Focused ATS segment with clear market niche
Sandisk Corporation Weaknesses
- Negative net margin, ROE, and ROIC reflecting profitability challenges
- Unfavorable WACC and interest coverage ratio signals high cost and risk
- High current ratio, possibly indicating inefficient asset use
- No dividend yield may deter income-focused investors
Celestica Inc. Weaknesses
- Unfavorable net margin and valuation multiples (PE and PB)
- Neutral liquidity ratios suggest moderate short-term financial flexibility
- Unavailable ROIC and WACC limit full capital efficiency assessment
- Zero dividend yield reduces income appeal
Sandisk’s strengths lie in diversification and global reach, yet it suffers from profitability and cost issues. Celestica shows stronger profitability metrics and asset efficiency but faces valuation and margin pressures. Each company’s financial profile suggests distinct strategic priorities for improvement.
The Moat Duel: Analyzing Competitive Defensibility
A structural moat shields long-term profits from relentless competitive pressures. It defines who thrives and who fades in the market:
Sandisk Corporation: Intangible Assets Moat
Sandisk’s moat stems from its proprietary NAND flash technology and brand prestige. Despite a strong gross margin of 30%, its falling ROIC signals value destruction. New markets in embedded storage remain uncertain in 2026.
Celestica Inc.: Cost Advantage and Operational Scale
Celestica relies on cost efficiency and supply chain integration, evident in its improving EBIT margin of 8.36% and robust revenue growth. Its growing ROIC trend suggests expanding competitive strength into cloud and aerospace sectors.
Intangible Assets vs. Cost Leadership: The Moat Face-Off
Celestica’s growing ROIC and operational scale create a wider moat than Sandisk’s eroding profitability. I see Celestica better positioned to defend and expand its market share in 2026.
Which stock offers better returns?
Over the past year, Sandisk Corporation’s stock soared with rapid acceleration, while Celestica Inc. gained substantially but showed signs of recent deceleration and weakness.
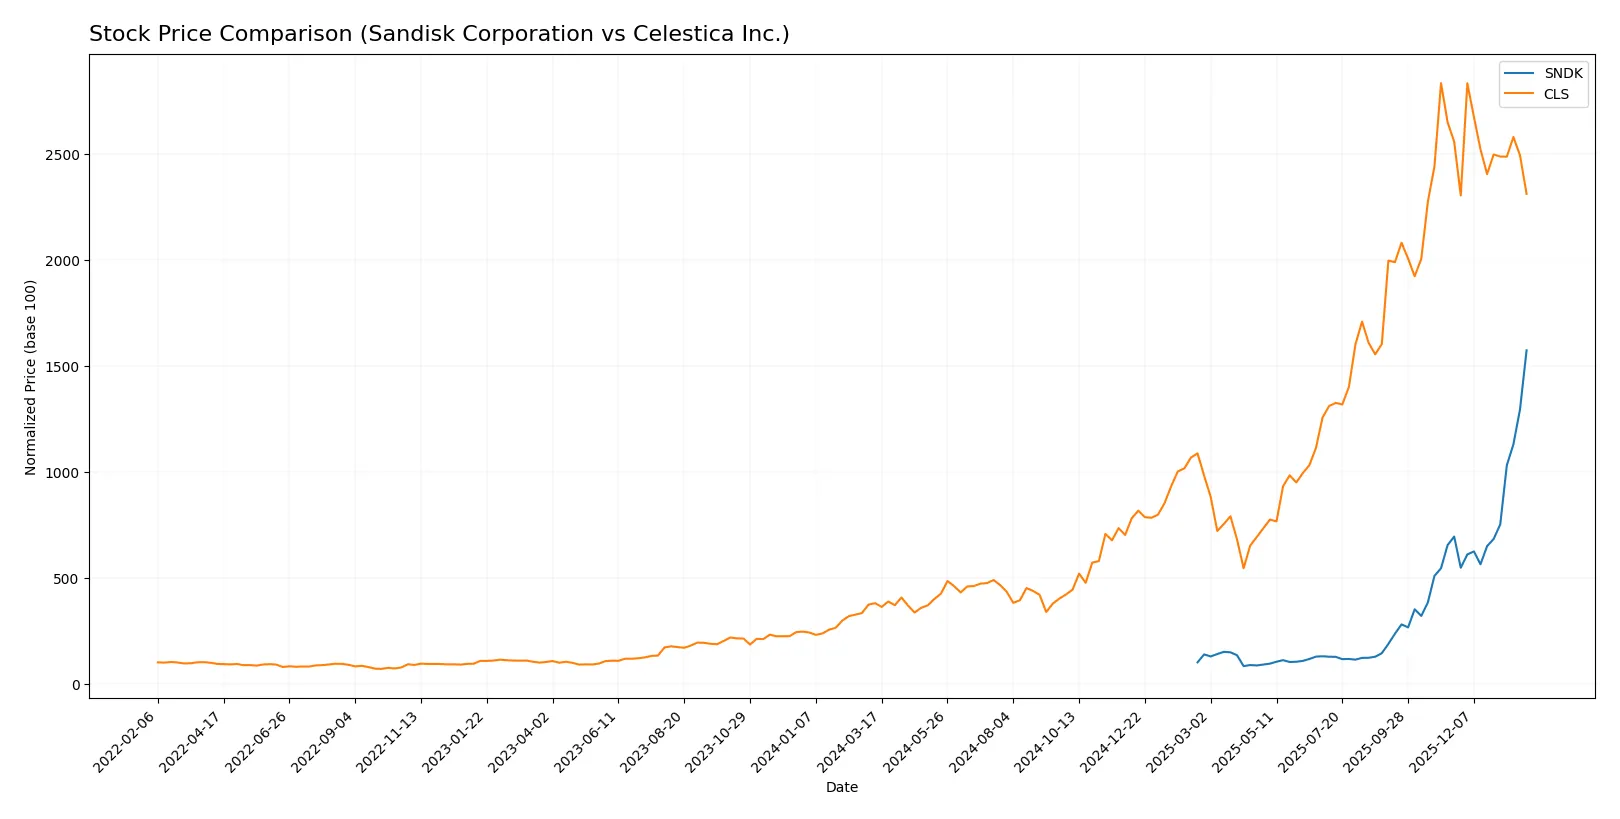
Trend Comparison
Sandisk Corporation’s stock gained 1472.31% over the past 12 months, demonstrating a bullish trend with accelerating momentum and significant volatility (std dev 125.16). The highest price reached 576.25, well above the 30.11 low.
Celestica Inc. recorded a 509.52% gain over the year, maintaining a bullish trend but with decelerating momentum and lower volatility (std dev 92.63). The recent trend turned negative with a -9.61% price change.
Sandisk’s stock outperformed Celestica’s by a wide margin, delivering the highest market returns and stronger recent buyer dominance.
Target Prices
The current analyst consensus suggests moderate upside potential for both Sandisk Corporation and Celestica Inc.
| Company | Target Low | Target High | Consensus |
|---|---|---|---|
| Sandisk Corporation | 220 | 1000 | 615 |
| Celestica Inc. | 300 | 440 | 366 |
Sandisk’s consensus target at 615 slightly exceeds its current price of 576, indicating cautious optimism. Celestica’s target consensus of 366 is well above its 281 market price, suggesting room for recovery.

Don’t Let Luck Decide Your Entry Point
Optimize your entry points with our advanced ProRealTime indicators. You’ll get efficient buy signals with precise price targets for maximum performance. Start outperforming now!
How do institutions grade them?
Sandisk Corporation Grades
Here are the latest institutional grades for Sandisk Corporation:
| Grading Company | Action | New Grade | Date |
|---|---|---|---|
| Jefferies | Maintain | Buy | 2026-01-30 |
| RBC Capital | Maintain | Sector Perform | 2026-01-30 |
| Goldman Sachs | Maintain | Buy | 2026-01-30 |
| Morgan Stanley | Maintain | Overweight | 2026-01-30 |
| Cantor Fitzgerald | Maintain | Overweight | 2026-01-30 |
| Wedbush | Maintain | Outperform | 2026-01-30 |
| Citigroup | Maintain | Buy | 2026-01-20 |
| Wells Fargo | Maintain | Equal Weight | 2026-01-15 |
| Benchmark | Maintain | Buy | 2026-01-15 |
| Bernstein | Maintain | Outperform | 2026-01-14 |
Celestica Inc. Grades
Here are the latest institutional grades for Celestica Inc.:
| Grading Company | Action | New Grade | Date |
|---|---|---|---|
| Citigroup | Maintain | Buy | 2026-01-30 |
| Barclays | Maintain | Overweight | 2026-01-30 |
| Goldman Sachs | Maintain | Buy | 2025-12-01 |
| Barclays | Maintain | Overweight | 2025-11-14 |
| Citigroup | Upgrade | Buy | 2025-11-10 |
| Goldman Sachs | Maintain | Buy | 2025-10-29 |
| CIBC | Maintain | Outperform | 2025-10-29 |
| Stifel | Maintain | Buy | 2025-10-29 |
| Barclays | Maintain | Overweight | 2025-10-29 |
| JP Morgan | Maintain | Overweight | 2025-10-29 |
Which company has the best grades?
Sandisk Corporation consistently receives high grades including multiple “Buy” and “Outperform” ratings from leading institutions. Celestica Inc. also holds strong grades with mostly “Buy” and “Overweight” ratings but fewer recent updates. Investors might view Sandisk’s more frequent and recent positive ratings as stronger institutional confidence.
Risks specific to each company
The following categories identify the critical pressure points and systemic threats facing both firms in the 2026 market environment:
1. Market & Competition
Sandisk Corporation
- Faces intense competition in NAND flash and storage solutions, pressured by rapid technological change and pricing volatility.
Celestica Inc.
- Competes in diverse hardware and supply chain services, exposed to fluctuating demand across industries and pricing pressures.
2. Capital Structure & Debt
Sandisk Corporation
- Maintains low debt-to-equity (0.22) and debt-to-assets (15.7%), reflecting conservative leverage management.
Celestica Inc.
- Shows moderate leverage (debt-to-equity 0.42, debt-to-assets 13.3%) with sound interest coverage (19.7x), supporting financial stability.
3. Stock Volatility
Sandisk Corporation
- Exhibits very high beta (4.89), indicating significant stock price volatility and sensitivity to market swings.
Celestica Inc.
- Has moderate beta (1.46), reflecting more stable stock price movements relative to the market.
4. Regulatory & Legal
Sandisk Corporation
- Operates under US technology sector regulations with exposure to data security and intellectual property laws.
Celestica Inc.
- Faces multinational regulatory environments, including US, Canada, and Asia, increasing compliance complexity.
5. Supply Chain & Operations
Sandisk Corporation
- Relies heavily on semiconductor supply chains vulnerable to geopolitical tensions and component shortages.
Celestica Inc.
- Provides diversified supply chain solutions, but exposed to global logistics disruptions and raw material price volatility.
6. ESG & Climate Transition
Sandisk Corporation
- Faces pressure to reduce carbon footprint in semiconductor manufacturing and improve sustainable practices.
Celestica Inc.
- Subject to ESG regulations across multiple regions, with growing focus on energy efficiency and sustainable supply chain management.
7. Geopolitical Exposure
Sandisk Corporation
- US-based with considerable exposure to US-China tensions affecting semiconductor supply and export controls.
Celestica Inc.
- Canadian headquarters with broad international operations, facing risks from trade policies and geopolitical instability in Asia and Europe.
Which company shows a better risk-adjusted profile?
Sandisk’s highest risk lies in extreme stock volatility and operational dependence on volatile semiconductor supply chains. Celestica faces its biggest risk in regulatory complexity and geopolitical exposure due to its multinational footprint. Despite Sandisk’s conservative leverage, its negative profitability and very high beta raise caution. Celestica’s moderate leverage, stronger profitability, and lower volatility position it with a superior risk-adjusted profile, supported by a safer Altman Z-score and more favorable return on equity. The recent surge in Sandisk’s beta to nearly 5 signals market nervousness, underscoring elevated investor risk.
Final Verdict: Which stock to choose?
Sandisk Corporation’s superpower lies in its impressive liquidity cushion and its ability to maintain operational efficiency despite current profitability challenges. Its point of vigilance is the ongoing value destruction reflected in declining returns, signaling a need for cautious capital allocation. It could suit aggressive growth portfolios willing to weather volatility for potential turnaround gains.
Celestica Inc. boasts a strategic moat with a steadily improving return on equity and asset utilization, underpinning its operational resilience. It offers a more stable financial profile than Sandisk, supported by consistent cash flow generation and moderate leverage. This stability aligns well with GARP (Growth at a Reasonable Price) investors seeking balanced exposure.
If you prioritize turnaround potential and can tolerate elevated risk, Sandisk might be the compelling choice due to its liquidity strength and operational leverage. However, if you seek steadier growth with better capital efficiency and financial stability, Celestica offers superior fundamentals, albeit at a higher valuation premium. Both present distinct analytical scenarios depending on your portfolio’s risk appetite.
Disclaimer: Investment carries a risk of loss of initial capital. The past performance is not a reliable indicator of future results. Be sure to understand risks before making an investment decision.
Go Further
I encourage you to read the complete analyses of Sandisk Corporation and Celestica Inc. to enhance your investment decisions: