Home > Comparison > Technology > CLS vs OUST
The strategic rivalry between Celestica Inc. and Ouster, Inc. shapes the evolving landscape of technology hardware. Celestica operates as a capital-intensive manufacturer and supply chain solutions provider across diverse sectors. In contrast, Ouster specializes in high-tech lidar sensor design, emphasizing innovation and rapid growth. This analysis explores which company’s operational model and market positioning offer superior risk-adjusted returns for a diversified portfolio amid sector transformation.
Table of contents
Companies Overview
Celestica Inc. and Ouster, Inc. are key players in the hardware and equipment sector with distinct market roles.
Celestica Inc.: Global Supply Chain and Hardware Solutions Leader
Celestica dominates as a provider of hardware platform and supply chain solutions across North America, Europe, and Asia. Its revenue stems from product manufacturing and extensive supply chain services, including design, engineering, assembly, and logistics. In 2026, Celestica focuses strategically on advanced technology and cloud connectivity solutions to serve aerospace, defense, healthtech, and hyperscalers.
Ouster, Inc.: High-Resolution Digital Lidar Innovator
Ouster leads in designing and manufacturing digital lidar sensors that deliver 3D vision for machinery, vehicles, and infrastructure. Its core revenue comes from sales of scanning and solid-state flash sensors paired with enabling software. In 2026, Ouster prioritizes expanding its product portfolio to capitalize on growing demand in robotics and autonomous systems.
Strategic Collision: Similarities & Divergences
Celestica and Ouster both operate in hardware but with contrasting philosophies: Celestica excels in a broad supply chain ecosystem, while Ouster pursues a focused, sensor-driven innovation model. Their primary battleground is the industrial technology sector, where precision and integration matter most. Celestica offers a diversified, scale-driven investment profile, whereas Ouster presents a high-beta, growth-oriented risk-reward dynamic.
Income Statement Comparison
This data dissects the core profitability and scalability of both corporate engines to reveal who dominates the bottom line:
| Metric | Celestica Inc. (CLS) | Ouster, Inc. (OUST) |
|---|---|---|
| Revenue | 12.6B | 111.1M |
| Cost of Revenue | 11.1B | 70.6M |
| Operating Expenses | 385M | 145M |
| Gross Profit | 1.47B | 40.5M |
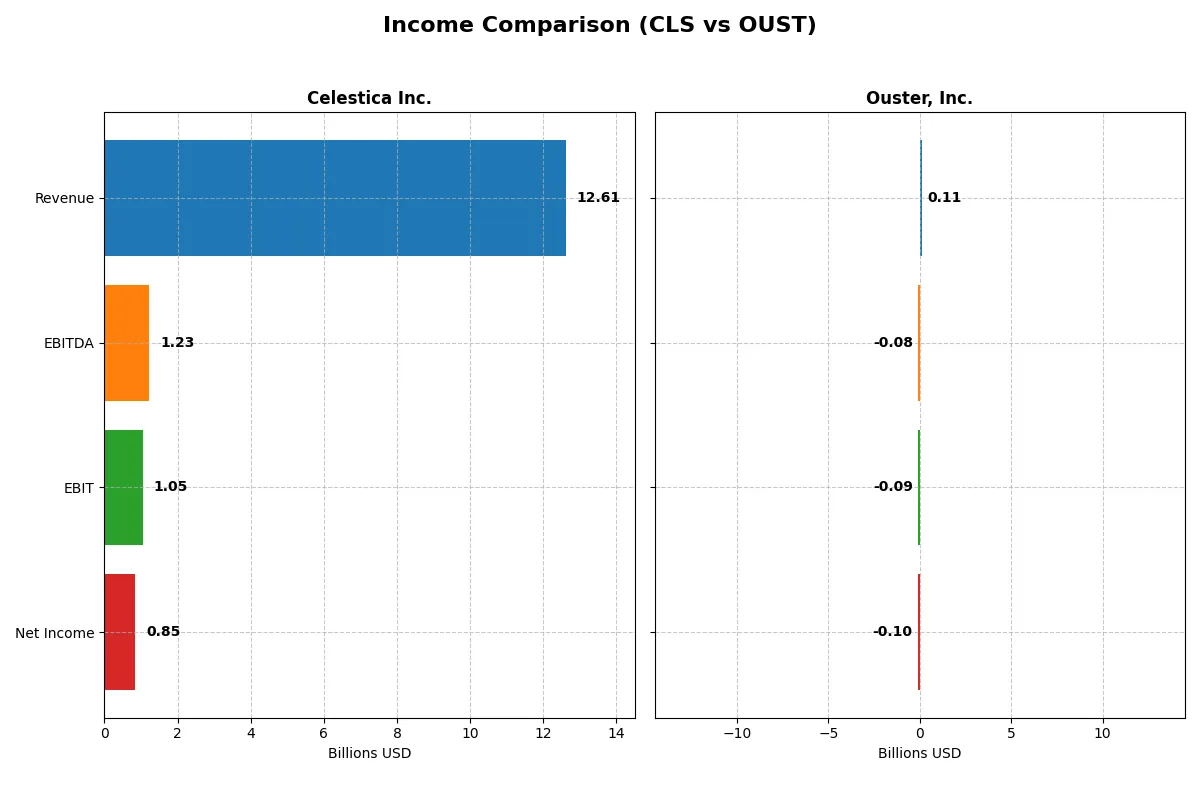
| EBITDA | 1.23B | -79.9M |
| EBIT | 1.05B | -94.7M |
| Interest Expense | 54M | 1.8M |
| Net Income | 847M | -97M |
| EPS | 7.22 | -2.08 |
| Fiscal Year | 2025 | 2024 |
Income Statement Analysis: The Bottom-Line Duel
This comparison unpacks how Celestica Inc. and Ouster, Inc. convert revenue into profit, revealing each firm’s operational efficiency and growth dynamics.
Celestica Inc. Analysis
Celestica’s revenue surged 31% in 2025 to $12.6B, with net income doubling to $847M, reflecting strong momentum. Gross margin holds steady near 11.7%, while net margin improves favorably to 6.7%, underscoring disciplined cost control. Its EBIT margin at 8.4% signals healthy operating leverage, confirming robust profitability gains in the latest fiscal year.
Ouster, Inc. Analysis
Ouster reported a 33% revenue increase to $111M in 2024, yet remained deeply unprofitable with a net loss of $97M. Despite a solid gross margin of 36.4%, negative EBIT and net margins (around -85% and -87%) highlight ongoing high operating expenses and structural inefficiency. However, Ouster’s rapid top-line growth and improving margin trends suggest early-stage scaling challenges.
Profitability Strength vs. Growth Struggles
Celestica’s consistent profit expansion and margin stability create a clear fundamental advantage over Ouster’s high-growth but loss-heavy profile. Investors seeking earnings reliability find Celestica’s improving margins and strong cash conversion more attractive. Conversely, Ouster’s profile suits those willing to tolerate losses for potential upside in a growth-intensive phase.
Financial Ratios Comparison
These vital ratios act as a diagnostic tool to expose the underlying fiscal health, valuation premiums, and capital efficiency of the companies compared below:
| Ratios | Celestica Inc. (CLS) | Ouster, Inc. (OUST) |
|---|---|---|
| ROE | 22.57% | -53.64% |
| ROIC | 16.10% | -50.84% |
| P/E | 25.47 | -5.87 |
| P/B | 5.75 | 3.15 |
| Current Ratio | 1.49 | 2.80 |
| Quick Ratio | 0.91 | 2.59 |
| D/E (Debt-to-Equity) | 0.42 | 0.11 |
| Debt-to-Assets | 13.30% | 7.33% |
| Interest Coverage | 11.50 | -57.15 |
| Asset Turnover | 1.61 | 0.40 |
| Fixed Asset Turnover | 14.58 | 4.54 |
| Payout Ratio | 0 | 0 |
| Dividend Yield | 0 | 0 |
| Fiscal Year | 2024 | 2024 |
Efficiency & Valuation Duel: The Vital Signs
Ratios act as a company’s DNA, uncovering hidden risks and showcasing operational excellence behind the surface numbers.
Celestica Inc.
Celestica delivers strong shareholder returns with a 22.57% ROE despite a modest 4.44% net margin. The stock trades at a stretched 25.47 P/E and a high 5.75 P/B ratio, signaling expensive valuation. It reinvests profits prudently but pays no dividend, focusing on operational efficiency and asset turnover.
Ouster, Inc.
Ouster suffers from deep losses with a negative 53.64% ROE and an alarming -87.35% net margin. Despite a low P/E at -5.87, its valuation remains unfavorable given poor profitability. The company holds ample liquidity and low leverage but returns no dividend, heavily investing in R&D amid persistent operational challenges.
Premium Valuation vs. Operational Safety
Celestica’s solid profitability contrasts with Ouster’s deep losses, yet Celestica’s valuation feels stretched. Ouster’s liquidity cushions risk but its poor returns undermine value. Investors seeking operational stability may prefer Celestica, while those targeting growth amid volatility might consider Ouster’s high-risk profile.
Which one offers the Superior Shareholder Reward?
Celestica Inc. (CLS) and Ouster, Inc. (OUST) both pay no dividends, focusing instead on reinvestment and buybacks. CLS generates positive free cash flow (2.57/share) and modest buybacks, sustaining growth with a healthy current ratio (1.49). OUST burns cash (-0.80/share FCF), reflecting heavy R&D and capex, with no buybacks. CLS’s distribution model, backed by steady cash flow and prudent leverage, offers more sustainable value creation than OUST’s cash-draining growth approach. I see CLS as the superior total return candidate for 2026 investors seeking disciplined capital allocation and shareholder reward.
Comparative Score Analysis: The Strategic Profile
The radar chart reveals the fundamental DNA and trade-offs of Celestica Inc. and Ouster, Inc., highlighting their distinct financial strengths and weaknesses:

Celestica demonstrates strong profitability with ROE and ROA scores at 5, signaling efficient capital and asset use. However, its valuation metrics (P/E and P/B scores of 1) indicate possible overvaluation risks. Ouster lags significantly in profitability (ROE and ROA scores of 1) but shows a better debt position (Debt/Equity score of 3). Celestica offers a more balanced profile, while Ouster relies heavily on conservative leverage management.
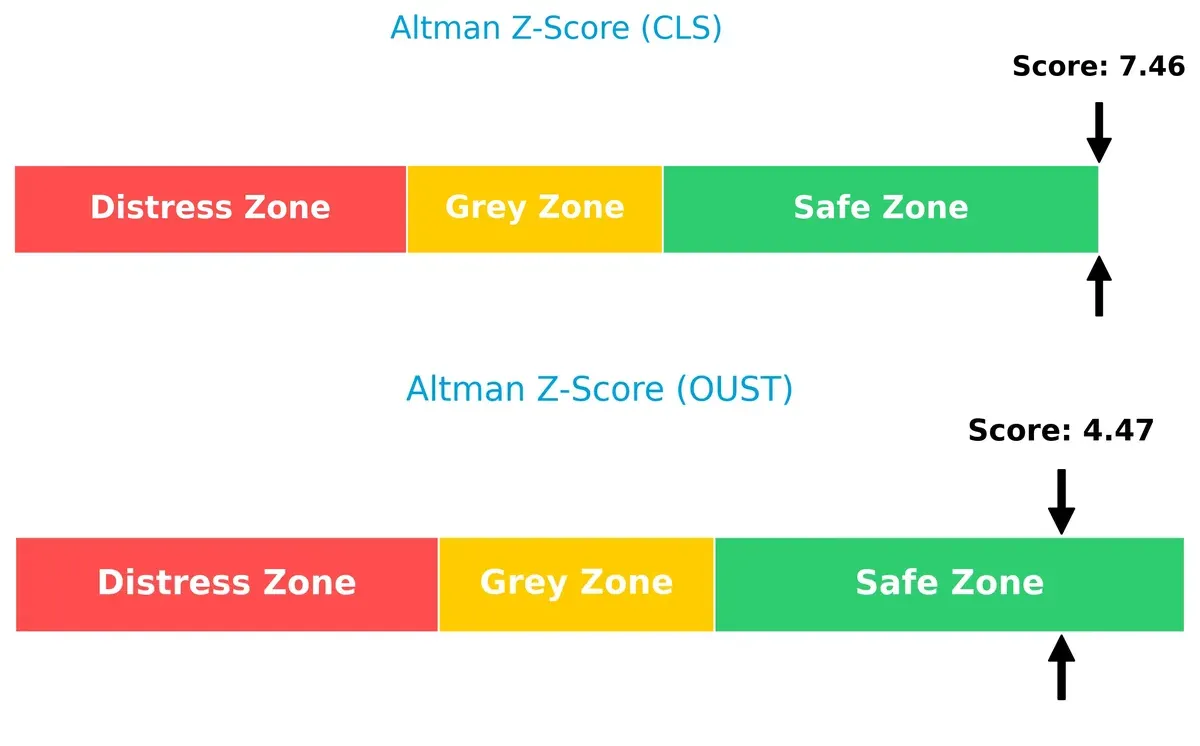
Bankruptcy Risk: Solvency Showdown
Celestica’s Altman Z-Score at 7.46 versus Ouster’s 4.47 places both firms safely above distress thresholds, but Celestica’s score signals stronger long-term solvency in this cycle:
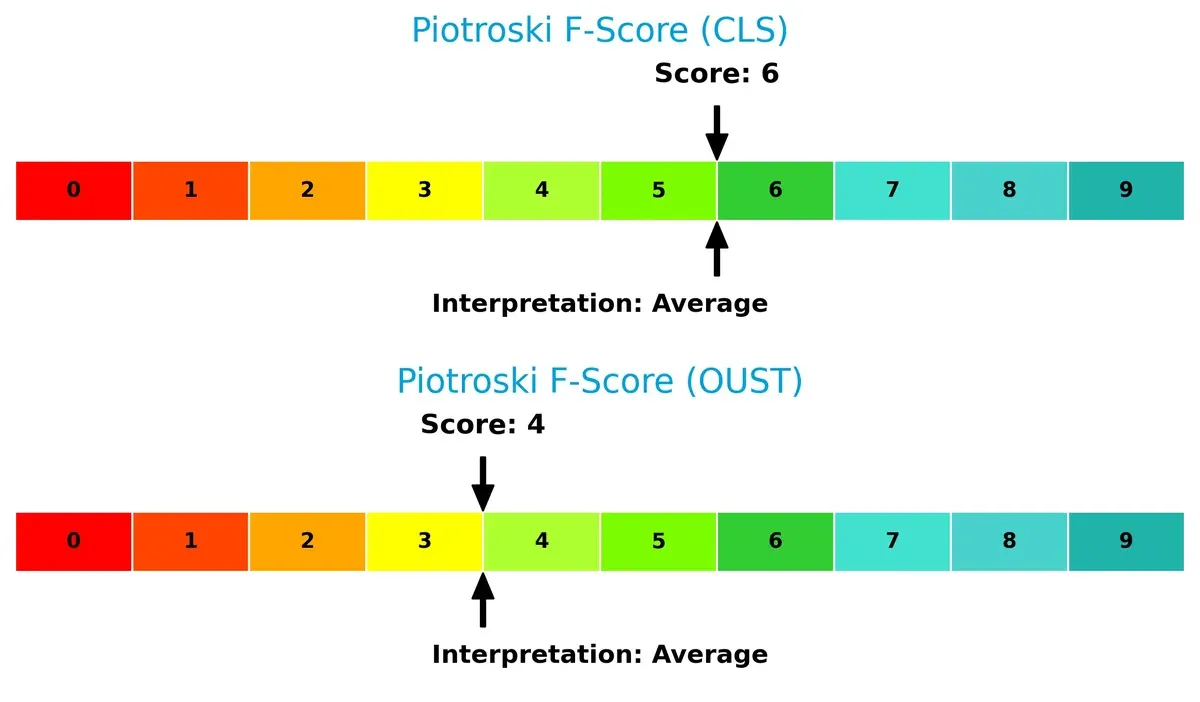
Financial Health: Quality of Operations
Celestica’s Piotroski F-Score of 6 outperforms Ouster’s 4, indicating healthier internal financial metrics. Neither firm shows critical red flags, yet Celestica’s stronger score reflects better operational quality and financial stability:
How are the two companies positioned?
This section dissects the operational DNA of Celestica and Ouster by comparing their revenue distribution by segment and internal dynamics. The goal is to confront their economic moats to reveal which model offers a more resilient, sustainable competitive advantage today.
Revenue Segmentation: The Strategic Mix
This comparison dissects how Celestica Inc. and Ouster, Inc. diversify their income streams and highlights their primary sector bets:
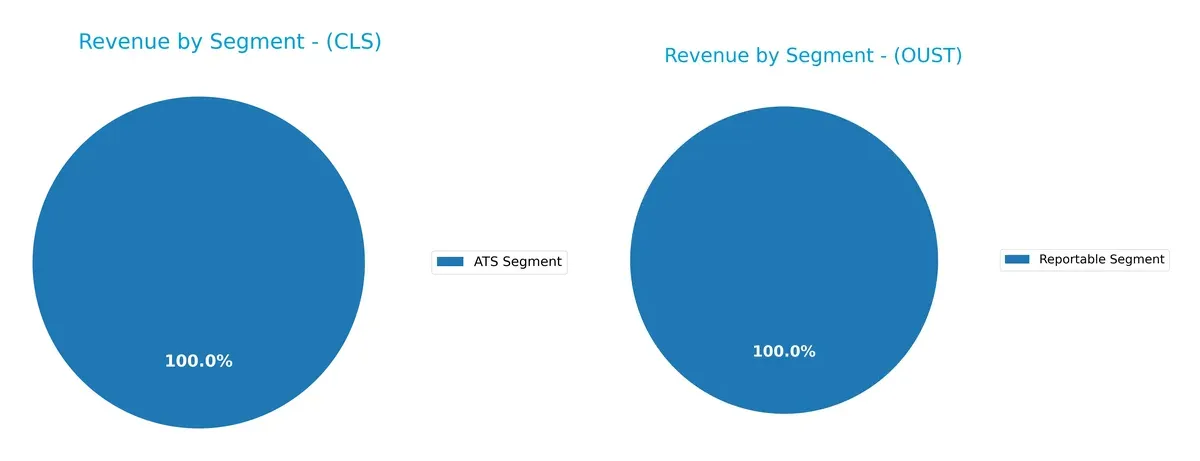
Celestica anchors its revenue with a dominant ATS Segment totaling $3.16B, signaling strong infrastructure focus. Ouster’s revenue splits across smaller reported segments, with $111M in 2024 and around $30M in product sales earlier years, showing broader but less concentrated streams. Celestica’s reliance on one segment implies scale advantages but concentration risk. Ouster’s dispersed revenue hints at early-stage diversification without a clear dominant pillar yet.
Strengths and Weaknesses Comparison
This table compares the Strengths and Weaknesses of Celestica Inc. and Ouster, Inc.:
Celestica Inc. Strengths
- Favorable ROE at 22.57%
- Low debt-to-assets at 13.3%
- Strong asset turnover at 1.61
- High fixed asset turnover at 14.58
- Current and quick ratios neutral at 1.49 and 0.91
Ouster, Inc. Strengths
- Strong current ratio at 2.8
- Strong quick ratio at 2.59
- Very low debt-to-assets at 7.33%
- Favorable fixed asset turnover at 4.54
- Favorable P/E ratio despite losses
Celestica Inc. Weaknesses
- Low net margin at 4.44%
- Unfavorable P/E and P/B ratios (25.47, 5.75)
- No dividend yield
- Unavailable ROIC and WACC
- Neutral liquidity ratios near 1
Ouster, Inc. Weaknesses
- Negative net margin at -87.35%
- Negative ROE and ROIC (-53.64%, -50.84%)
- High WACC at 17.47%
- Negative interest coverage (-51.94)
- Low asset turnover at 0.4
- Unfavorable P/B ratio and no dividends
Celestica shows stronger profitability and efficient asset use but weaker market valuation and dividend yield. Ouster maintains strong liquidity and low leverage but struggles with significant losses and poor returns. Both face distinct challenges impacting their strategic positioning.
The Moat Duel: Analyzing Competitive Defensibility
A structural moat is the only thing protecting long-term profits from the erosion of competition. Let’s dissect the sources of durable advantage for these two tech hardware firms:
Celestica Inc.: Supply Chain Mastery with Margin Resilience
Celestica leverages a cost advantage through integrated supply chain solutions, showing margin stability and rapid revenue growth. Its expanding service segments in cloud and aerospace deepen this moat for 2026.
Ouster, Inc.: Innovation-Driven Network Effects in Lidar
Ouster’s moat stems from intangible assets—high-resolution lidar technology and software. Despite negative margins, its steep revenue and gross profit growth signal strengthening competitive positioning and market disruption potential.
Cost Leadership vs. Technological Edge: Who Holds the Stronger Moat?
Celestica’s cost-driven moat delivers consistent profitability and scalable returns, while Ouster’s innovation moat faces profitability hurdles despite growth. Celestica is better equipped to defend market share amid competitive pressures.
Which stock offers better returns?
Over the past year, Celestica Inc. showed extraordinary price growth but with recent deceleration, while Ouster, Inc. delivered solid gains with accelerating momentum.
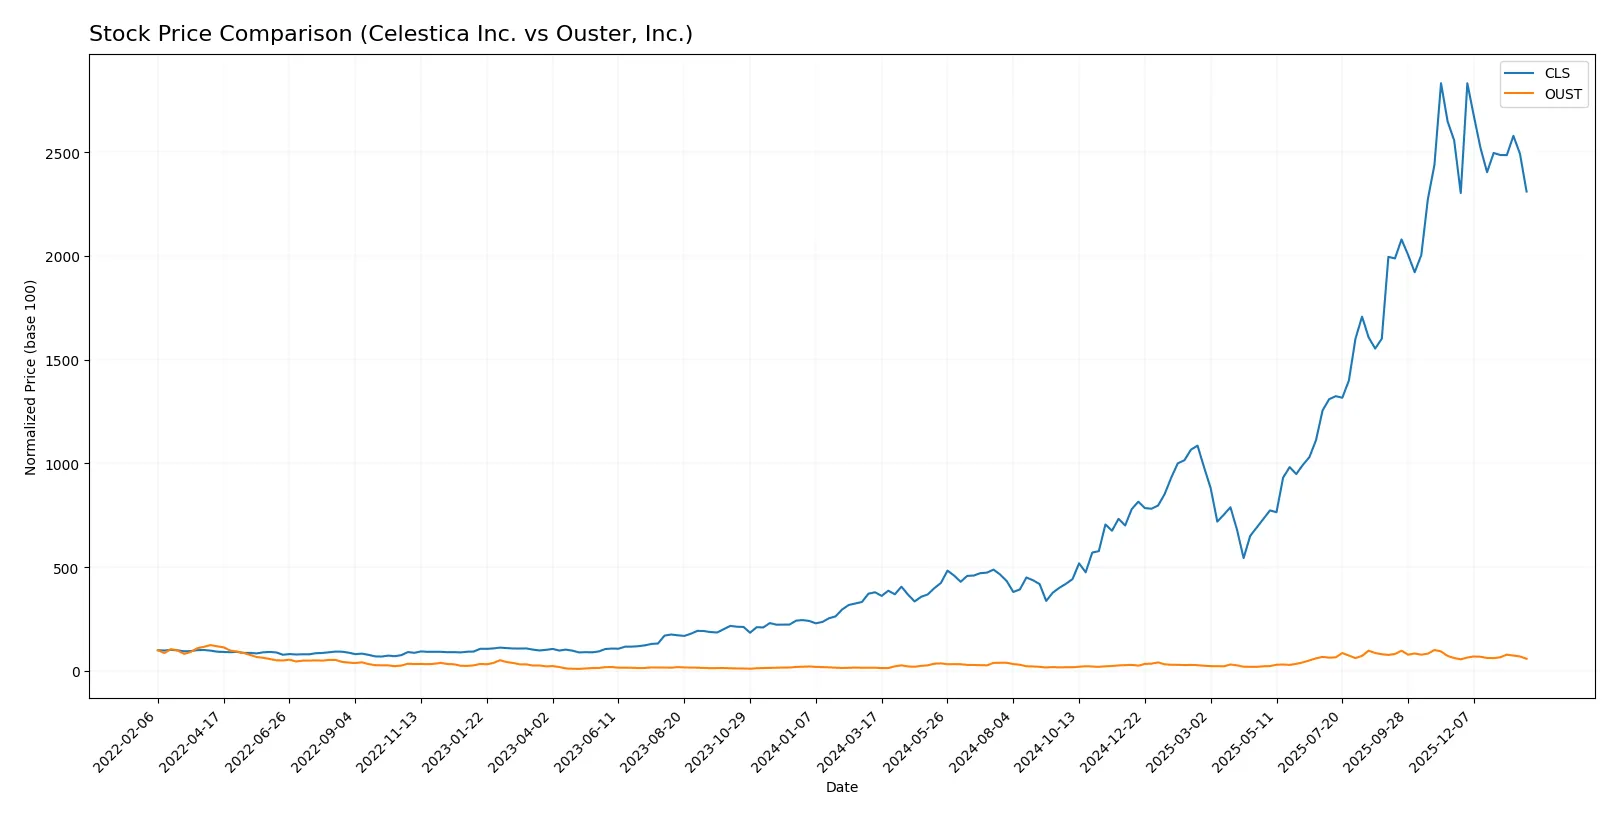
Trend Comparison
Celestica Inc.’s stock rose 510% over 12 months, confirming a strong bullish trend despite recent deceleration and a 9.6% decline in the last two and a half months.
Ouster, Inc. gained 277% over the same period, maintaining a bullish trend with acceleration and a smaller 5.5% drop recently, accompanied by lower volatility.
Celestica’s overall market performance surpasses Ouster’s, though both stocks face recent short-term declines with seller dominance in volume.
Target Prices
Analysts show a clear price appreciation potential for both Celestica Inc. and Ouster, Inc. based on consensus targets.
| Company | Target Low | Target High | Consensus |
|---|---|---|---|
| Celestica Inc. | 300 | 440 | 365.6 |
| Ouster, Inc. | 33 | 39 | 36.67 |
Celestica’s target consensus stands about 30% above its current 281 price, signaling upside potential. Ouster’s consensus nearly doubles its current 20.83 price, reflecting high growth expectations despite elevated volatility.

Don’t Let Luck Decide Your Entry Point
Optimize your entry points with our advanced ProRealTime indicators. You’ll get efficient buy signals with precise price targets for maximum performance. Start outperforming now!
How do institutions grade them?
The following summarizes recent institutional grades for Celestica Inc. and Ouster, Inc.:
Celestica Inc. Grades
This table shows Celestica’s latest grades from major financial institutions.
| Grading Company | Action | New Grade | Date |
|---|---|---|---|
| Citigroup | Maintain | Buy | 2026-01-30 |
| Barclays | Maintain | Overweight | 2026-01-30 |
| Goldman Sachs | Maintain | Buy | 2025-12-01 |
| Barclays | Maintain | Overweight | 2025-11-14 |
| Citigroup | Upgrade | Buy | 2025-11-10 |
| Goldman Sachs | Maintain | Buy | 2025-10-29 |
| CIBC | Maintain | Outperform | 2025-10-29 |
| Stifel | Maintain | Buy | 2025-10-29 |
| Barclays | Maintain | Overweight | 2025-10-29 |
| JP Morgan | Maintain | Overweight | 2025-10-29 |
Ouster, Inc. Grades
This table presents Ouster’s recent grades from recognized financial firms.
| Grading Company | Action | New Grade | Date |
|---|---|---|---|
| Cantor Fitzgerald | Upgrade | Overweight | 2025-11-07 |
| Cantor Fitzgerald | Upgrade | Overweight | 2025-11-06 |
| Rosenblatt | Maintain | Buy | 2025-11-05 |
| WestPark Capital | Maintain | Buy | 2025-11-05 |
| WestPark Capital | Upgrade | Buy | 2025-08-13 |
| Oppenheimer | Maintain | Outperform | 2025-07-16 |
| WestPark Capital | Downgrade | Hold | 2025-06-12 |
| WestPark Capital | Upgrade | Buy | 2025-05-09 |
| Cantor Fitzgerald | Maintain | Overweight | 2025-03-21 |
| WestPark Capital | Maintain | Hold | 2025-03-21 |
Which company has the best grades?
Celestica consistently earns Buy and Overweight ratings from large banks, indicating broad institutional confidence. Ouster’s grades vary more, with multiple upgrades but also a recent downgrade to Hold. Investors may interpret Celestica’s steadier grades as a sign of more consistent institutional support.
Risks specific to each company
In 2026, both Celestica Inc. and Ouster, Inc. face critical pressure points and systemic threats across seven core risk categories in the technology hardware sector:
1. Market & Competition
Celestica Inc.
- Established player with diverse industrial clients, but faces margin pressure amid intense competition.
Ouster, Inc.
- Emerging lidar innovator in a niche market, struggling with negative margins and high competition from larger tech firms.
2. Capital Structure & Debt
Celestica Inc.
- Maintains moderate leverage (D/E 0.42) with strong interest coverage, signaling financial stability.
Ouster, Inc.
- Low leverage (D/E 0.11) but negative interest coverage, indicating weak earnings to cover debt costs.
3. Stock Volatility
Celestica Inc.
- Beta of 1.46 shows moderate sensitivity to market swings, typical for established hardware firms.
Ouster, Inc.
- High beta at 2.94 signals extreme stock volatility and investor uncertainty.
4. Regulatory & Legal
Celestica Inc.
- Operates globally with exposure to complex regulations in aerospace and healthtech sectors.
Ouster, Inc.
- Faces regulatory scrutiny in lidar technology and autonomous systems, increasing compliance costs.
5. Supply Chain & Operations
Celestica Inc.
- Robust global supply chain but exposed to semiconductor and logistics disruptions.
Ouster, Inc.
- Smaller scale limits operational resilience; supply chain risks amplified by nascent technology production.
6. ESG & Climate Transition
Celestica Inc.
- Focus on energy storage and smart meters supports ESG goals; however, transition costs remain.
Ouster, Inc.
- Innovative sensor technology aligns with sustainability trends but lacks scale for broad impact.
7. Geopolitical Exposure
Celestica Inc.
- Cross-continental operations subject to trade tensions and currency fluctuations.
Ouster, Inc.
- Primarily U.S.-based but dependent on global tech supply chains vulnerable to geopolitical risks.
Which company shows a better risk-adjusted profile?
Celestica’s strongest risk lies in market competition pressuring its slim net margin. Ouster’s principal threat is its persistent negative profitability and high stock volatility. Celestica’s stable capital structure and operational scale provide a better risk-adjusted profile. Ouster’s fragile earnings and elevated beta raise red flags. The stark contrast in interest coverage—Celestica’s 19.7 versus Ouster’s negative—underscores Celestica’s superior financial resilience in 2026.
Final Verdict: Which stock to choose?
Celestica Inc. impresses with its operational muscle, demonstrating a growing ability to generate returns on invested capital. Its superpower is efficient capital allocation that fuels steady profitability and revenue growth. A point of vigilance remains its relatively high valuation metrics, which could temper near-term upside. Celestica suits portfolios aiming for aggressive growth with a tolerance for premium pricing.
Ouster, Inc. stands out for its strategic moat rooted in cutting-edge sensor technology and rapid revenue expansion. It offers a stronger liquidity buffer and lower financial risk than Celestica, reflecting a safer balance sheet profile. However, its current value destruction signals caution. Ouster fits growth-at-a-reasonable-price (GARP) portfolios willing to accept volatility for innovation potential.
If you prioritize a proven cash machine with improving profitability and can handle valuation premiums, Celestica is the compelling choice due to its efficient capital use and robust income growth. However, if you seek a technology innovator with a strong liquidity cushion and a long-term growth trajectory despite near-term losses, Ouster offers better stability and upside potential. Both require careful risk management aligned with your investment horizon.
Disclaimer: Investment carries a risk of loss of initial capital. The past performance is not a reliable indicator of future results. Be sure to understand risks before making an investment decision.
Go Further
I encourage you to read the complete analyses of Celestica Inc. and Ouster, Inc. to enhance your investment decisions: