Home > Comparison > Technology > CLS vs NOVT
The strategic rivalry between Celestica Inc. and Novanta Inc. shapes the competitive landscape in the Technology sector’s Hardware, Equipment & Parts industry. Celestica operates as a capital-intensive hardware platform and supply chain solutions provider, while Novanta focuses on high-precision photonics and motion components with a specialized product mix. This analysis explores their contrasting operational models to identify which company presents a superior risk-adjusted investment opportunity for a diversified portfolio.
Table of contents
Companies Overview
Celestica and Novanta stand as pivotal players in the hardware and technology equipment sector, shaping industrial innovation.
Celestica Inc.: Global Supply Chain and Hardware Specialist
Celestica dominates as a hardware platform and supply chain solutions provider across North America, Europe, and Asia. Its core revenue stems from product manufacturing and supply chain services including design, engineering, assembly, and logistics. In 2026, Celestica focuses strategically on expanding Advanced Technology and Connectivity & Cloud Solutions, aiming to deepen its footprint in aerospace, defense, and cloud service markets.
Novanta Inc.: Precision Photonics and Motion Innovator
Novanta leads in photonics, vision, and precision motion components serving medical and industrial OEMs worldwide. Its revenue engine relies on specialized laser and imaging technologies plus precision motion controls. The company prioritizes innovation in medical-grade visualization and industrial laser applications, reinforcing its position in high-tech manufacturing and healthcare equipment in 2026.
Strategic Collision: Similarities & Divergences
Both companies operate within the hardware equipment industry but diverge sharply in business models. Celestica emphasizes end-to-end supply chain integration while Novanta bets on cutting-edge photonics and precision components. Their battleground centers on industrial technology applications, yet Celestica targets broad manufacturing services, whereas Novanta focuses on innovation-driven niches. This contrast creates distinct investment profiles: one anchored in scale and supply chain expertise, the other in specialized high-tech product development.
Income Statement Comparison
This data dissects the core profitability and scalability of both corporate engines to reveal who dominates the bottom line:
| Metric | Celestica Inc. (CLS) | Novanta Inc. (NOVT) |
|---|---|---|
| Revenue | 12.6B | 949M |
| Cost of Revenue | 11.1B | 528M |
| Operating Expenses | 385M | 311M |
| Gross Profit | 1.47B | 422M |
| EBITDA | 1.23B | 180M |
| EBIT | 1.05B | 124M |
| Interest Expense | 54M | 31M |
| Net Income | 847M | 64M |
| EPS | 7.22 | 1.78 |
| Fiscal Year | 2025 | 2024 |
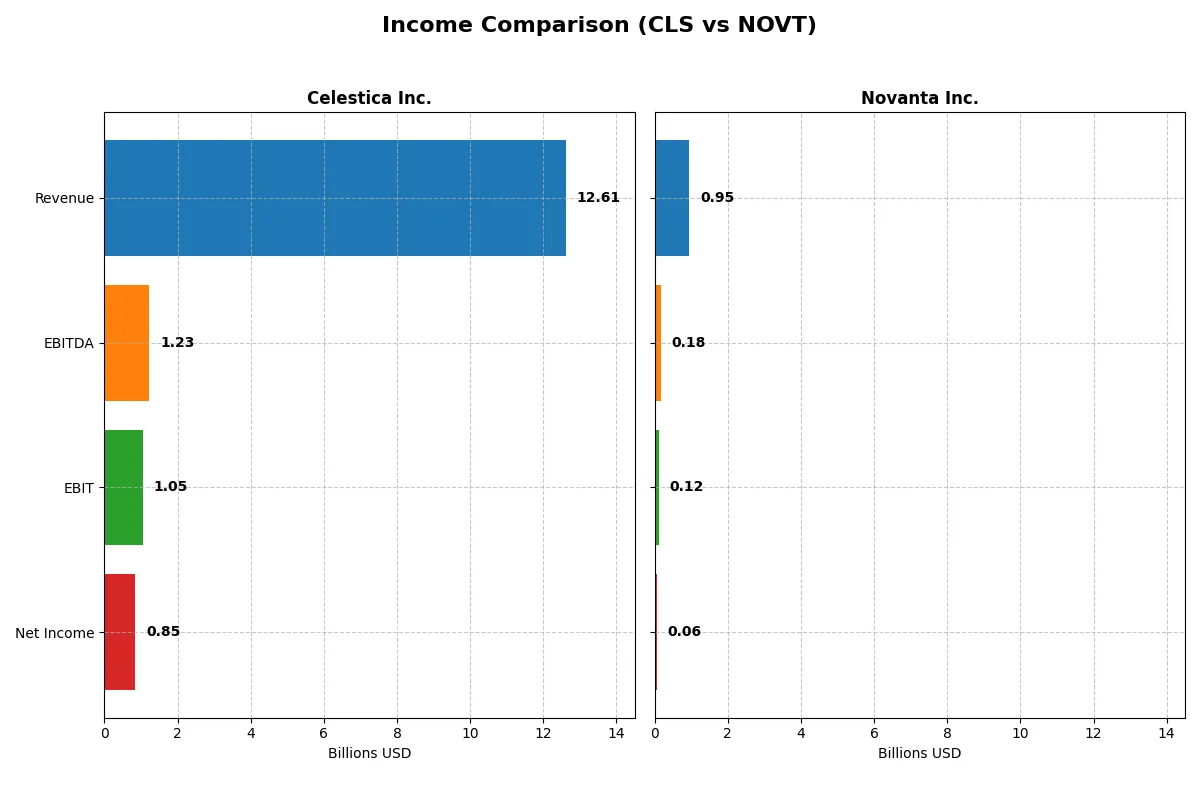
Income Statement Analysis: The Bottom-Line Duel
This income statement comparison reveals how efficiently each company converts revenue into profit, exposing their operational strengths and weaknesses.
Celestica Inc. Analysis
Celestica shows a robust revenue climb from $5.6B in 2021 to $12.6B in 2025, with net income surging from $104M to $847M. Gross and net margins remain steady, reflecting solid operational control. The latest year’s 30.7% revenue growth and 51.4% net margin expansion signal strong momentum and improving profitability.
Novanta Inc. Analysis
Novanta’s revenue grows steadily from $591M in 2020 to $949M in 2024, with net income rising from $45M to $64M. It boasts a high gross margin at 44.4% and a net margin near 6.75%. However, recent net margin and EPS declines suggest some pressure on profitability despite steady top-line growth.
Margin Power vs. Revenue Scale
Celestica’s rapid revenue and net income growth with expanding margins clearly outpaces Novanta’s steadier but slower gains. Novanta’s superior gross margin highlights operational efficiency but recent margin erosion weakens its case. For investors, Celestica’s profile offers a more compelling growth and profit trajectory in this income statement duel.
Financial Ratios Comparison
These vital ratios act as a diagnostic tool to expose the underlying fiscal health, valuation premiums, and capital efficiency of the companies compared here:
| Ratios | Celestica Inc. (CLS) | Novanta Inc. (NOVT) |
|---|---|---|
| ROE | 22.57% | 8.59% |
| ROIC | 16.10% | 7.25% |
| P/E | 25.47 | 85.70 |
| P/B | 5.75 | 7.37 |
| Current Ratio | 1.49 | 2.58 |
| Quick Ratio | 0.91 | 1.72 |
| D/E | 0.42 | 0.63 |
| Debt-to-Assets | 13.30% | 33.92% |
| Interest Coverage | 11.50 | 3.51 |
| Asset Turnover | 1.61 | 0.68 |
| Fixed Asset Turnover | 14.58 | 6.08 |
| Payout Ratio | 0 | 0 |
| Dividend Yield | 0 | 0 |
| Fiscal Year | 2024 | 2024 |
Efficiency & Valuation Duel: The Vital Signs
Financial ratios serve as a company’s DNA, revealing hidden risks and operational strengths behind the surface numbers.
Celestica Inc.
Celestica shows robust profitability with a 22.57% ROE but a modest 4.44% net margin, indicating operational challenges. The valuation appears stretched, with a P/E of 25.47 and P/B at 5.75. It returns no dividend, suggesting reinvestment in growth or R&D rather than shareholder payouts.
Novanta Inc.
Novanta posts a lower 8.59% ROE but a better net margin at 6.75%, signaling more efficient core operations. Its valuation is very expensive, with a P/E of 85.7 and P/B at 7.37. Novanta also pays no dividend, likely investing heavily in R&D, as reflected by 10% of revenue spent there.
Valuation Stretch vs. Operational Efficiency
Celestica balances higher profitability with a more reasonable valuation compared to Novanta’s stretched multiples and weaker returns. Investors seeking a blend of operational strength and valuation discipline may prefer Celestica. Novanta fits those prioritizing growth and R&D investment despite higher risk.
Which one offers the Superior Shareholder Reward?
Celestica (CLS) and Novanta (NOVT) both forgo dividends, focusing on reinvestment and buybacks. CLS’s moderate free cash flow yield and steady buybacks contrast with NOVT’s higher margins, more aggressive reinvestment, and smaller buyback scale. I see CLS offering a more sustainable balance of buybacks and cash flow coverage, making it the superior shareholder reward in 2026.
Comparative Score Analysis: The Strategic Profile
The radar chart reveals the fundamental DNA and trade-offs of Celestica Inc. and Novanta Inc., highlighting their core financial strengths and vulnerabilities:
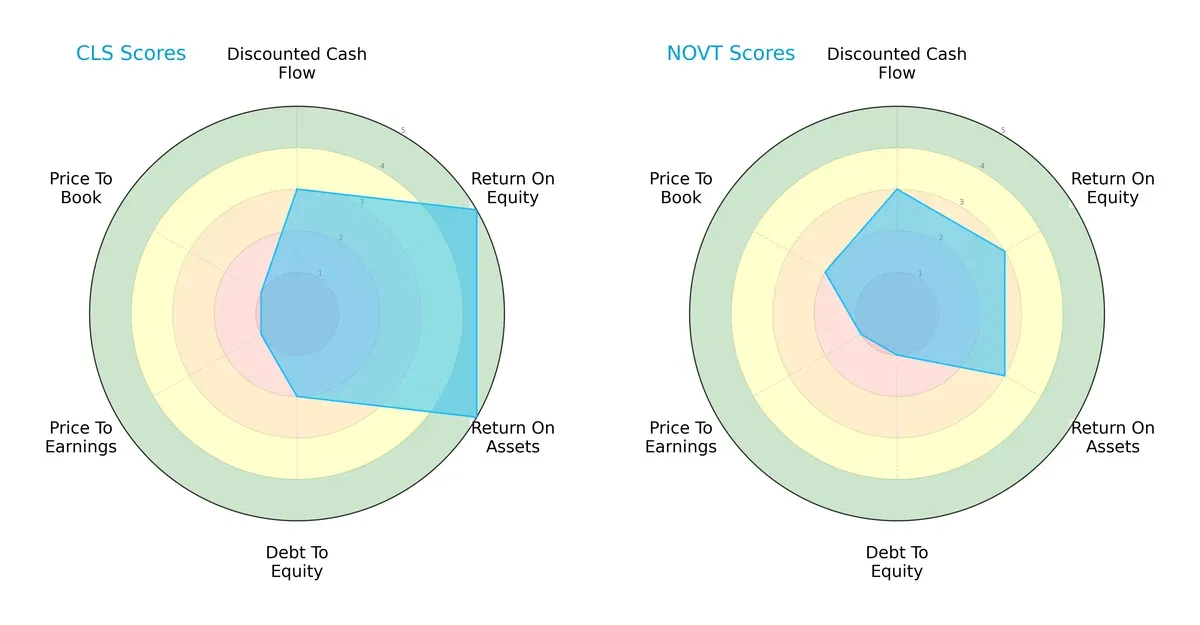
Celestica shows superior efficiency with very favorable ROE and ROA scores (5 each), indicating strong profit generation and asset utilization. Novanta lags with moderate scores (3 each), reflecting less operational efficiency. Both match on DCF scores (3), signaling similar cash flow valuation. Celestica’s moderate debt-to-equity score (2) outperforms Novanta’s very unfavorable score (1), suggesting better financial stability. However, both companies suffer from very unfavorable valuation metrics (PE and PB scores at 1), indicating market skepticism or potential undervaluation. Overall, Celestica has a more balanced profile, while Novanta relies more on moderate operational and weaker leverage metrics.
—
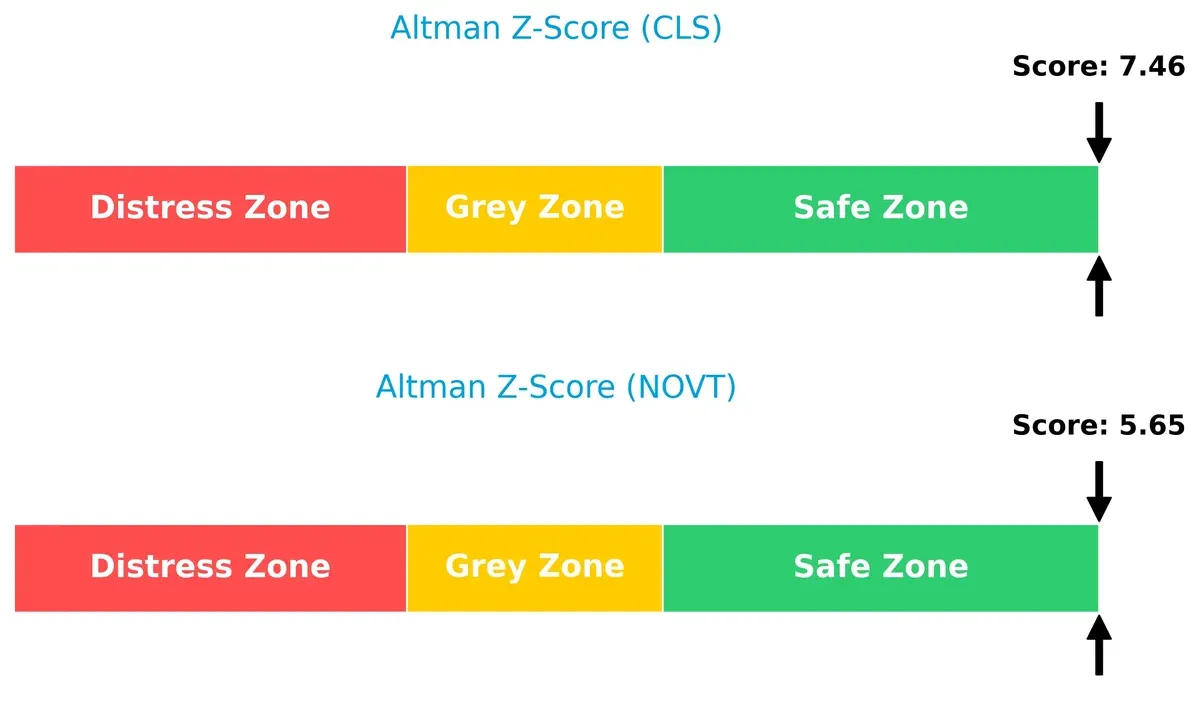
Bankruptcy Risk: Solvency Showdown
Celestica’s Altman Z-Score of 7.46 significantly surpasses Novanta’s 5.65, both safely above the distress threshold, implying robust long-term solvency but a clear edge for Celestica’s financial resilience in this cycle:
—
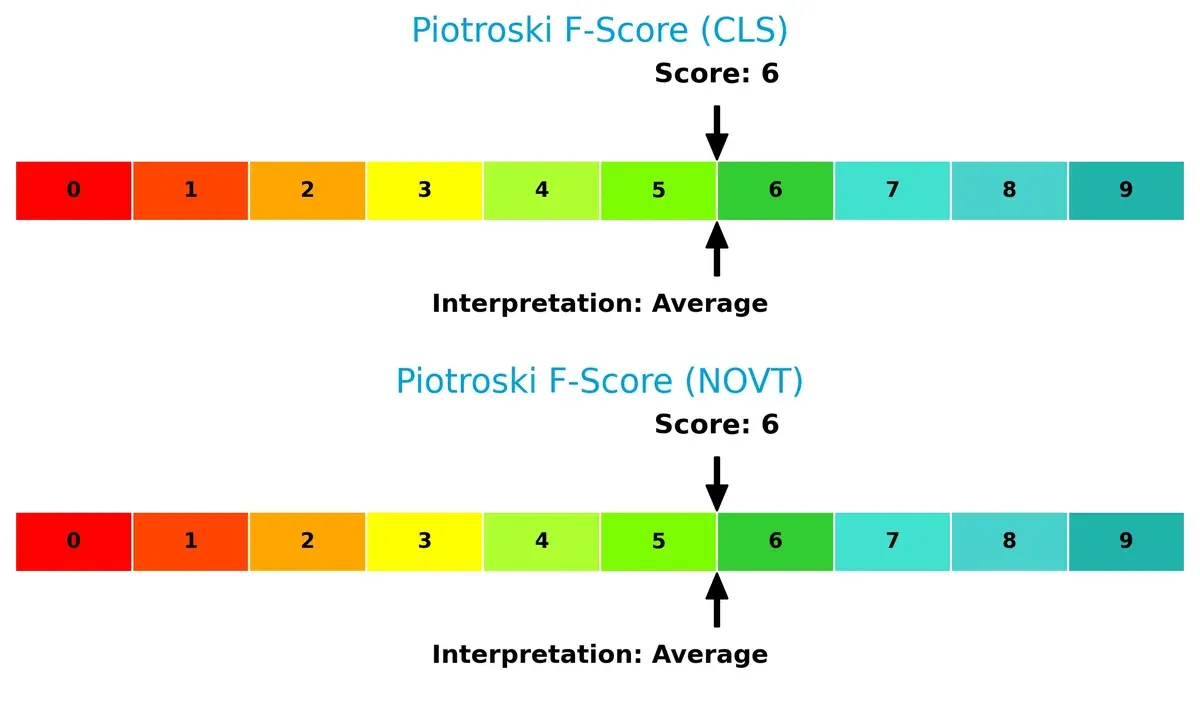
Financial Health: Quality of Operations
Both Celestica and Novanta score a 6 on the Piotroski F-Score, indicating average financial health with no immediate red flags. Neither firm shows peak strength, but they maintain decent operational quality and internal metrics:
How are the two companies positioned?
This section dissects the operational DNA of CLS and NOVT by comparing their revenue distribution and internal strengths and weaknesses. The goal is to confront their economic moats to identify which model offers the most resilient competitive advantage today.
Revenue Segmentation: The Strategic Mix
This comparison dissects how Celestica Inc. and Novanta Inc. diversify their income streams and where their primary sector bets lie:
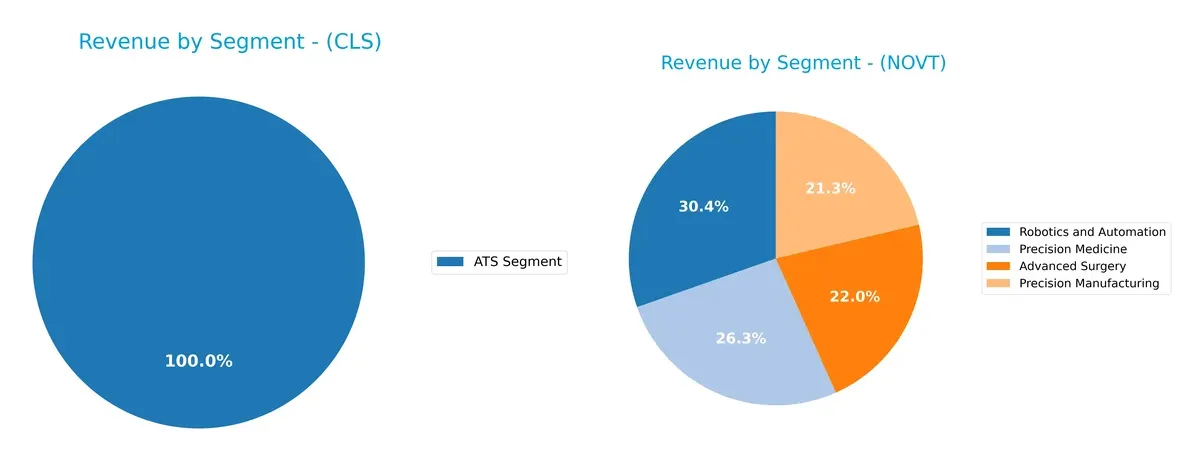
Celestica anchors its revenue with a $3.16B ATS segment, showing clear concentration in electronics manufacturing services. Novanta, by contrast, diversifies across Precision Manufacturing ($202M), Robotics and Automation ($288M), Advanced Surgery ($208M), and Precision Medicine ($250M). This mix dwarfs Celestica’s single-segment focus, reducing concentration risk and enabling Novanta to pivot across high-tech medical and industrial niches. Celestica’s model relies on infrastructure dominance, while Novanta gains ecosystem lock-in through broad specialization.
Strengths and Weaknesses Comparison
This table compares the Strengths and Weaknesses of Celestica Inc. (CLS) and Novanta Inc. (NOVT):
CLS Strengths
- Strong return on equity at 22.57%
- Low debt to equity of 0.42
- High asset turnover of 1.61
- Favorable fixed asset turnover at 14.58
- Diversified ATS segment revenue of 3.16B USD
NOVT Strengths
- Diversified revenue across multiple advanced segments
- Strong global presence with large US and Europe sales
- Favorable fixed asset turnover at 6.08
- High current ratio of 2.58 and quick ratio of 1.72
- Solid precision manufacturing and medical tech exposure
CLS Weaknesses
- Low net margin of 4.44% flagged unfavorable
- High price-to-book ratio at 5.75
- Unavailable WACC and ROIC metrics
- Zero dividend yield
- Neutral liquidity ratios with quick ratio near 0.9
NOVT Weaknesses
- Low return on equity at 8.59%
- Unfavorable WACC at 10.87%
- High price-to-earnings ratio of 85.7
- Elevated debt to assets at 33.92%
- Neutral interest coverage at 3.95 times
- Zero dividend yield
Celestica shows stronger profitability ratios and efficient asset use but lacks margin strength and market valuation appeal. Novanta boasts diversified revenue streams and strong liquidity but faces challenges in profitability and high valuation multiples. These contrasts highlight differing strategic focuses and financial health profiles.
The Moat Duel: Analyzing Competitive Defensibility
A structural moat is the only reliable shield protecting long-term profits from relentless competitive erosion. Let’s dissect the core moats of Celestica and Novanta:
Celestica Inc.: Operational Excellence and Scale Advantage
Celestica’s moat stems from its expansive supply chain platform and engineering services. This manifests in robust revenue growth (124% over five years) and soaring EPS (+773%). Its growing ROIC trend signals efficient capital use. New tech markets in cloud and aerospace could deepen this advantage in 2026.
Novanta Inc.: Niche Innovation with Precision Tech Focus
Novanta’s moat lies in its specialized photonics and precision motion components. Unlike Celestica’s scale, Novanta leverages high gross margins (44%) but shows ROIC below WACC, indicating value erosion despite rising profitability. Expansion in medical imaging and industrial lasers offers growth but with margin pressure risks.
Scale and Operational Mastery vs. Niche Innovation Edge
Celestica boasts a wider, more durable moat driven by superior capital efficiency and explosive income growth. Novanta’s moat is narrower and currently under margin stress. Celestica appears better equipped to defend and grow its market share in 2026.
Which stock offers better returns?
The past year shows starkly divergent stock price dynamics between Celestica Inc. and Novanta Inc., with Celestica’s long-term gains contrasting Novanta’s overall decline despite recent recovery.
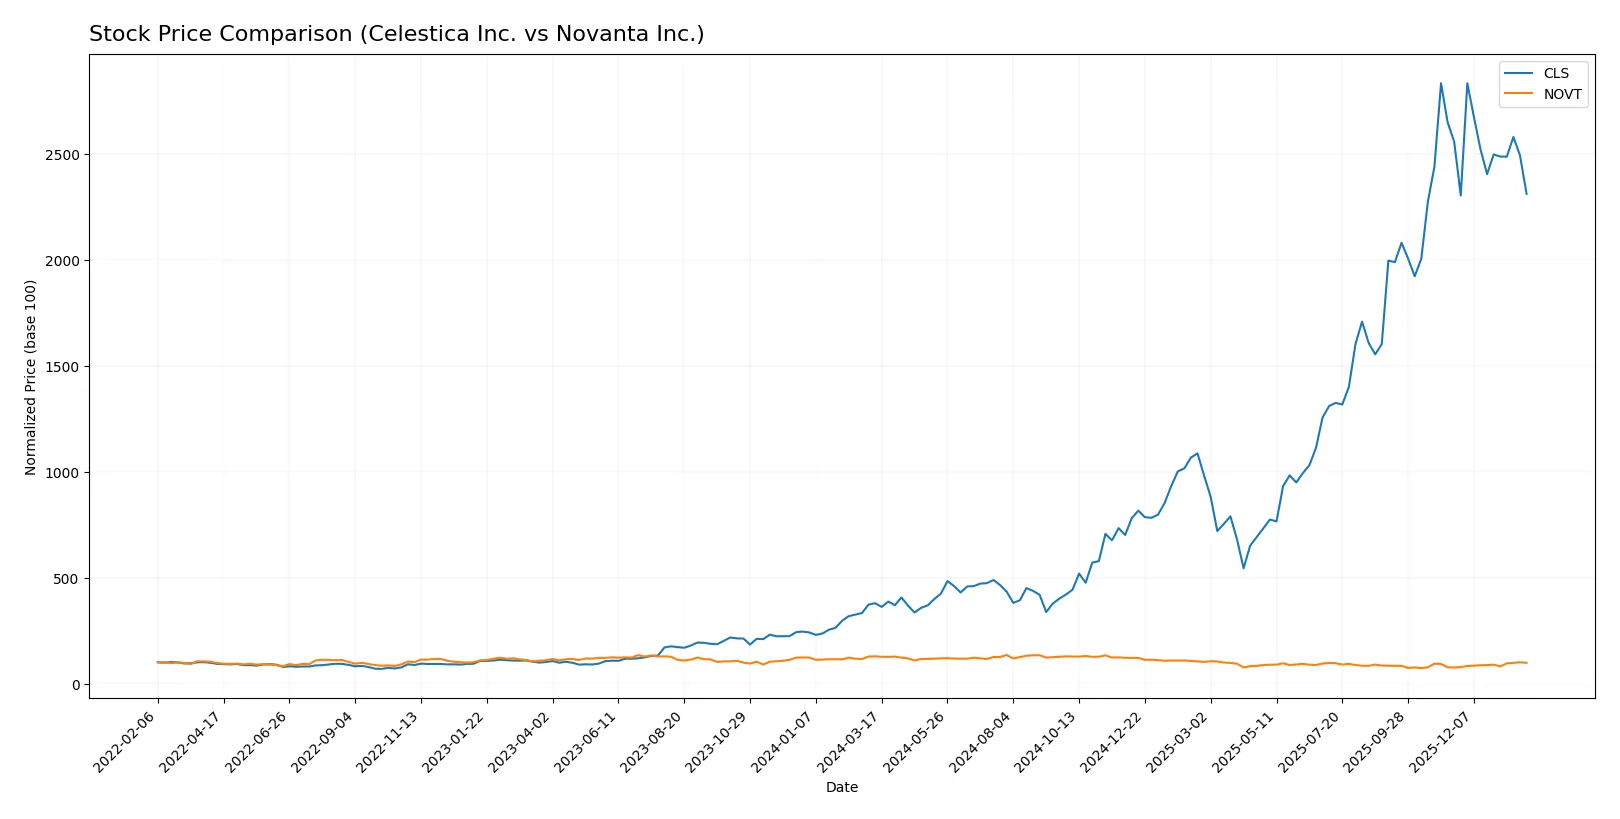
Trend Comparison
Celestica Inc. exhibits a strong bullish trend over the past 12 months with a 509.52% price increase, although momentum slowed recently with a 9.61% decline since November 2025. Novanta Inc. shows a bearish trend for the year, down 23.79%, but recent months reveal an accelerating 29.63% price rebound. Comparing both, Celestica delivered the highest market performance over the full year despite its recent short-term weakening, outpacing Novanta’s overall decline.
Target Prices
Analysts show a positive outlook with clear upside potential for both Celestica Inc. and Novanta Inc.
| Company | Target Low | Target High | Consensus |
|---|---|---|---|
| Celestica Inc. | 300 | 440 | 365.6 |
| Novanta Inc. | 160 | 160 | 160 |
Celestica’s consensus target at 365.6 implies a 30% premium versus its current 281 price. Novanta’s target at 160 suggests roughly 19% upside from 134.5. Analyst expectations favor moderate gains.

Don’t Let Luck Decide Your Entry Point
Optimize your entry points with our advanced ProRealTime indicators. You’ll get efficient buy signals with precise price targets for maximum performance. Start outperforming now!
How do institutions grade them?
Celestica Inc. Grades
The following table summarizes recent grades issued by major financial institutions for Celestica Inc.:
| Grading Company | Action | New Grade | Date |
|---|---|---|---|
| Citigroup | Maintain | Buy | 2026-01-30 |
| Barclays | Maintain | Overweight | 2026-01-30 |
| Goldman Sachs | Maintain | Buy | 2025-12-01 |
| Barclays | Maintain | Overweight | 2025-11-14 |
| Citigroup | Upgrade | Buy | 2025-11-10 |
| Goldman Sachs | Maintain | Buy | 2025-10-29 |
| CIBC | Maintain | Outperform | 2025-10-29 |
| Stifel | Maintain | Buy | 2025-10-29 |
| Barclays | Maintain | Overweight | 2025-10-29 |
| JP Morgan | Maintain | Overweight | 2025-10-29 |
Novanta Inc. Grades
Below is a table of recent institutional grades for Novanta Inc.:
| Grading Company | Action | New Grade | Date |
|---|---|---|---|
| Baird | Maintain | Neutral | 2025-08-11 |
| Baird | Maintain | Neutral | 2025-03-03 |
| Baird | Maintain | Neutral | 2024-11-06 |
| Baird | Maintain | Neutral | 2024-08-07 |
| Baird | Maintain | Neutral | 2023-05-11 |
| Baird | Maintain | Neutral | 2023-05-10 |
| William Blair | Upgrade | Outperform | 2022-05-11 |
| William Blair | Upgrade | Outperform | 2022-05-10 |
| Berenberg | Maintain | Hold | 2020-11-13 |
| Baird | Maintain | Neutral | 2020-05-13 |
Which company has the best grades?
Celestica Inc. consistently receives Buy and Overweight ratings, signaling strong institutional confidence. Novanta Inc. holds mainly Neutral grades with occasional Outperform upgrades, indicating more cautious sentiment. Investors might interpret Celestica’s grades as stronger validation of growth prospects.
Risks specific to each company
The following categories identify the critical pressure points and systemic threats facing both firms in the 2026 market environment:
1. Market & Competition
Celestica Inc.
- Faces intense competition in hardware and supply chain solutions across global tech sectors.
Novanta Inc.
- Operates in niche photonics and precision motion markets but competes with specialized and emerging tech firms.
2. Capital Structure & Debt
Celestica Inc.
- Maintains a conservative debt-to-equity ratio (0.42), signaling financial stability.
Novanta Inc.
- Higher leverage (debt-to-equity 0.63) increases financial risk amid rising interest rates.
3. Stock Volatility
Celestica Inc.
- Beta of 1.46 indicates above-market volatility but relatively moderate for tech hardware.
Novanta Inc.
- Higher beta of 1.60 shows greater stock price sensitivity to market swings, adding risk.
4. Regulatory & Legal
Celestica Inc.
- Operates globally; exposed to complex cross-border compliance and trade regulations.
Novanta Inc.
- Subject to stringent medical device regulations, increasing legal and compliance costs.
5. Supply Chain & Operations
Celestica Inc.
- Complex global supply chain susceptible to geopolitical tensions and component shortages.
Novanta Inc.
- Smaller scale but reliant on specialized components, vulnerable to supplier disruptions.
6. ESG & Climate Transition
Celestica Inc.
- Faces pressure to improve sustainability in manufacturing and supply chains globally.
Novanta Inc.
- Needs to align photonics and medical products with evolving ESG standards amid regulatory scrutiny.
7. Geopolitical Exposure
Celestica Inc.
- Significant exposure to North America, Europe, and Asia; geopolitical risks in trade and tariffs.
Novanta Inc.
- Primarily US-based but with global customers; trade policies and export controls pose risks.
Which company shows a better risk-adjusted profile?
Celestica’s strongest risk factor is competitive pressure in a commoditized hardware market. Novanta’s largest risk lies in its higher leverage and valuation multiple, exposing it to financial stress in a rising rate environment. Celestica’s more conservative capital structure and safer Altman Z-score (7.46 vs. 5.65) support a better risk-adjusted profile. Recent data show Novanta’s high P/E (85.7) and debt levels strain its financial flexibility, confirming my concern over its elevated financial risk.
Final Verdict: Which stock to choose?
Celestica Inc. (CLS) stands out as a cash-efficient operator with a clear trajectory of improving returns on capital. Its ability to generate strong equity returns despite a moderate net margin shows operational resilience. A point of vigilance remains its valuation multiples, which appear stretched relative to earnings, suggesting care for value-sensitive investors. CLS suits portfolios aiming for aggressive growth with a tolerance for premium pricing.
Novanta Inc. (NOVT) leverages its intangible asset base and R&D focus to maintain a technological moat in specialized industrial applications. Its solid current ratio and stable cash conversion cycle offer a safer financial profile than CLS. However, the company faces challenges in capital efficiency and margin expansion. NOVT fits well within GARP portfolios, balancing growth prospects with relative stability.
If you prioritize capital efficiency and strong equity returns, Celestica outshines with its improving profitability and operational discipline. However, if you seek a more conservative growth play with a strategic moat in innovation, Novanta offers better stability despite its valuation headwinds. Both present compelling but distinct scenarios depending on your risk appetite and investment horizon.
Disclaimer: Investment carries a risk of loss of initial capital. The past performance is not a reliable indicator of future results. Be sure to understand risks before making an investment decision.
Go Further
I encourage you to read the complete analyses of Celestica Inc. and Novanta Inc. to enhance your investment decisions: