Home > Comparison > Technology > CLS vs MKSI
The strategic rivalry between Celestica Inc. and MKS Inc. shapes the Technology sector’s hardware landscape. Celestica operates as a broad-based hardware platform and supply chain solutions provider, while MKS focuses on specialized instruments and process control systems. This head-to-head pits diversified scale against targeted innovation. This analysis aims to identify which company’s operational model and growth trajectory present the superior risk-adjusted profile for a well-diversified portfolio in 2026.
Table of contents
Companies Overview
Celestica and MKS Inc. stand as pivotal players in the hardware and equipment sector, shaping technology infrastructure worldwide.
Celestica Inc.: Integrated Hardware & Supply Chain Solutions
Celestica excels as a hardware platform and supply chain solutions provider across North America, Europe, and Asia. Its revenue stems from advanced technology manufacturing and extensive supply chain services, including design, engineering, and logistics. In 2026, Celestica sharpens its focus on cloud solutions and connectivity infrastructure, catering to hyperscalers and original equipment manufacturers with a broad product spectrum.
MKS Inc.: Precision Instrumentation & Process Control
MKS Inc. leads in instruments and systems for manufacturing process control, specializing in vacuum, power, and photonics technologies. It generates revenue through high-precision measurement and control products for semiconductor and industrial markets. In 2026, MKS prioritizes innovation in laser-based PCB manufacturing and photonic systems, reinforcing its footprint in semiconductor fabrication and life sciences.
Strategic Collision: Similarities & Divergences
Both firms operate in hardware but diverge in philosophy: Celestica emphasizes integrated supply chain solutions, while MKS focuses on high-precision instrumentation and subsystem innovation. Their primary battleground is advanced manufacturing infrastructure, targeting semiconductor and industrial technology customers. This contrast defines distinct investment profiles—Celestica’s scale and service breadth versus MKS’s specialized technological edge.
Income Statement Comparison
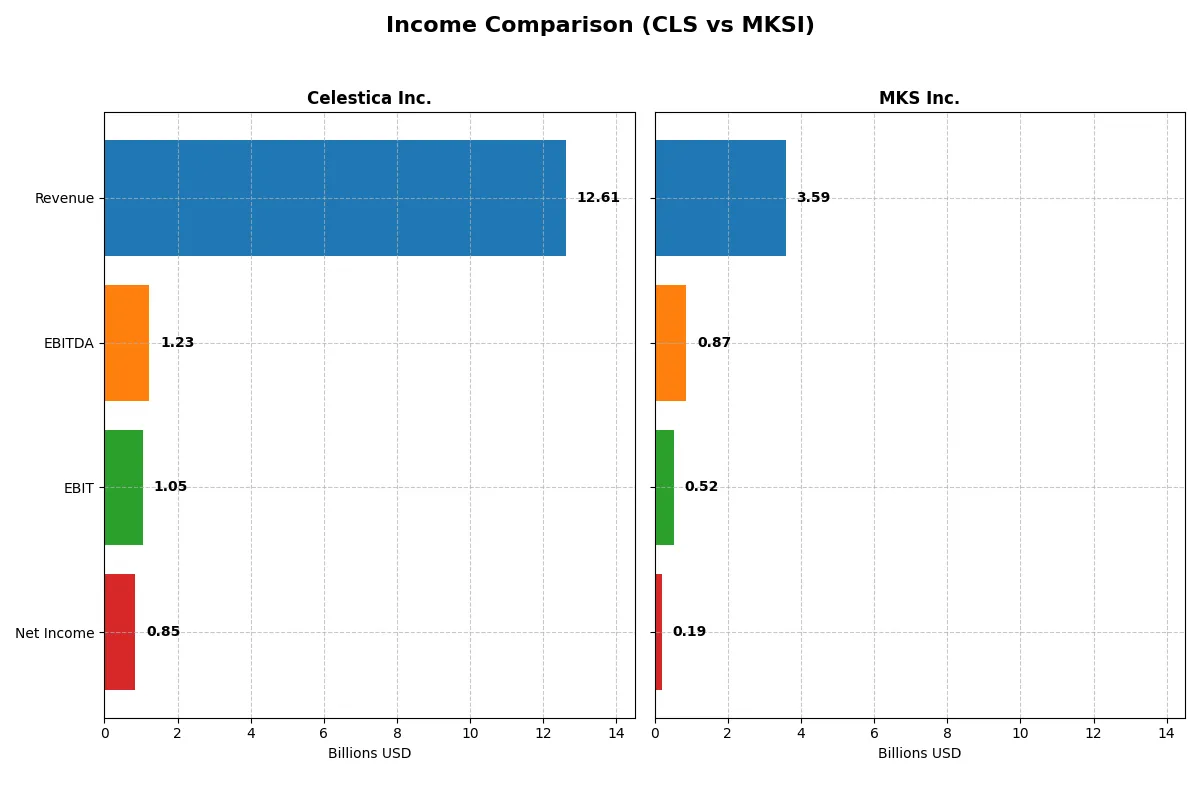
This data dissects the core profitability and scalability of both corporate engines to reveal who dominates the bottom line:
| Metric | Celestica Inc. (CLS) | MKS Inc. (MKSI) |
|---|---|---|
| Revenue | 12.6B | 3.59B |
| Cost of Revenue | 11.1B | 1.88B |
| Operating Expenses | 385M | 1.21B |
| Gross Profit | 1.47B | 1.71B |
| EBITDA | 1.23B | 870M |
| EBIT | 1.05B | 522M |
| Interest Expense | 54M | 345M |
| Net Income | 847M | 190M |
| EPS | 7.22 | 2.82 |
| Fiscal Year | 2025 | 2024 |
Income Statement Analysis: The Bottom-Line Duel
This income statement comparison exposes the genuine operational efficiency and growth momentum powering each company’s financial engine.
Celestica Inc. Analysis
Celestica’s revenue surged from 5.6B in 2021 to 12.6B in 2025, reflecting robust top-line growth. Net income exploded sevenfold to 847M in 2025, boosting net margin to a favorable 6.7%. Its gross margin remained stable near 11.7%, while EBIT margin climbed to 8.4%, indicating improving operational efficiency and strong momentum in the latest year.
MKS Inc. Analysis
MKS posted revenue growth from 2.3B in 2020 to 3.6B in 2023 but slipped slightly to 3.6B in 2024. Gross margin stood at a strong 47.6%, with EBIT margin at 14.6%, signaling solid profitability. However, net income swung from a 1.8B loss in 2023 to a modest 190M profit in 2024, showing signs of recovery but still lagging behind historical performance.
Consistent Growth vs. Volatile Recovery
Celestica demonstrates steady, impressive growth with expanding margins and strong net income gains. MKS shows superior margin levels but struggles with volatile earnings and a recent sharp net loss. Celestica’s consistent upward trajectory offers a clearer path to sustainable profitability, while MKS’s profile suits investors favoring potential turnaround plays amid earnings volatility.
Financial Ratios Comparison
These vital ratios act as a diagnostic tool to expose the underlying fiscal health, valuation premiums, and capital efficiency of the companies compared below:
| Ratios | Celestica Inc. (CLS) | MKS Inc. (MKSI) |
|---|---|---|
| ROE | 22.57% | 8.18% |
| ROIC | 16.10% | 6.31% |
| P/E | 25.47 | 36.98 |
| P/B | 5.75 | 3.03 |
| Current Ratio | 1.49 | 3.19 |
| Quick Ratio | 0.91 | 2.04 |
| D/E (Debt-to-Equity) | 0.42 | 2.06 |
| Debt-to-Assets | 13.30% | 55.65% |
| Interest Coverage | 11.50 | 1.44 |
| Asset Turnover | 1.61 | 0.42 |
| Fixed Asset Turnover | 14.58 | 3.55 |
| Payout Ratio | 0 | 31.05% |
| Dividend Yield | 0 | 0.84% |
| Fiscal Year | 2024 | 2024 |
Efficiency & Valuation Duel: The Vital Signs
Financial ratios serve as a company’s DNA, uncovering hidden risks and revealing operational efficiency that guides investment decisions.
Celestica Inc.
Celestica displays a strong return on equity at 22.57%, signaling efficient profitability. However, its net margin is modest at 4.44%, and the P/E ratio of 25.47 implies a somewhat stretched valuation. The company does not pay dividends, opting instead to reinvest earnings into growth and R&D, reflecting a long-term value creation strategy.
MKS Inc.
MKS shows a lower return on equity at 8.18%, indicating less efficient profitability. Its net margin is slightly better at 5.3%, but MKS trades at a high P/E of 36.98, suggesting an expensive stock. Despite a small dividend yield of 0.84%, its heavy debt load and weaker interest coverage raise concerns about financial stability.
Premium Valuation vs. Operational Safety
Celestica offers a better balance of profitability and financial health despite a stretched valuation. MKS’s higher valuation comes with significant debt and weaker returns, increasing risk. Investors seeking operational resilience may favor Celestica’s profile, while those tolerating risk might consider MKS’s growth potential.
Which one offers the Superior Shareholder Reward?
Celestica Inc. (CLS) pays no dividends but generates steady free cash flow (2.57/share in 2024), reinvesting in operations with no buybacks. MKS Inc. (MKSI) offers a 0.84% dividend yield with a 31% payout ratio and aggressive buybacks, returning 6.09/share free cash flow in 2024. MKSI’s distribution blends yield and buybacks, yet high leverage (67% debt/capital) raises risk. CLS maintains a stronger balance with lower debt (30%) but no direct shareholder returns. For 2026, MKSI’s active buyback and dividend policy offer a more attractive total return, though investors must weigh its leverage risk against CLS’s conservative capital allocation.
Comparative Score Analysis: The Strategic Profile
The radar chart reveals the fundamental DNA and trade-offs of Celestica Inc. and MKS Inc., highlighting their financial strengths and valuation differences:
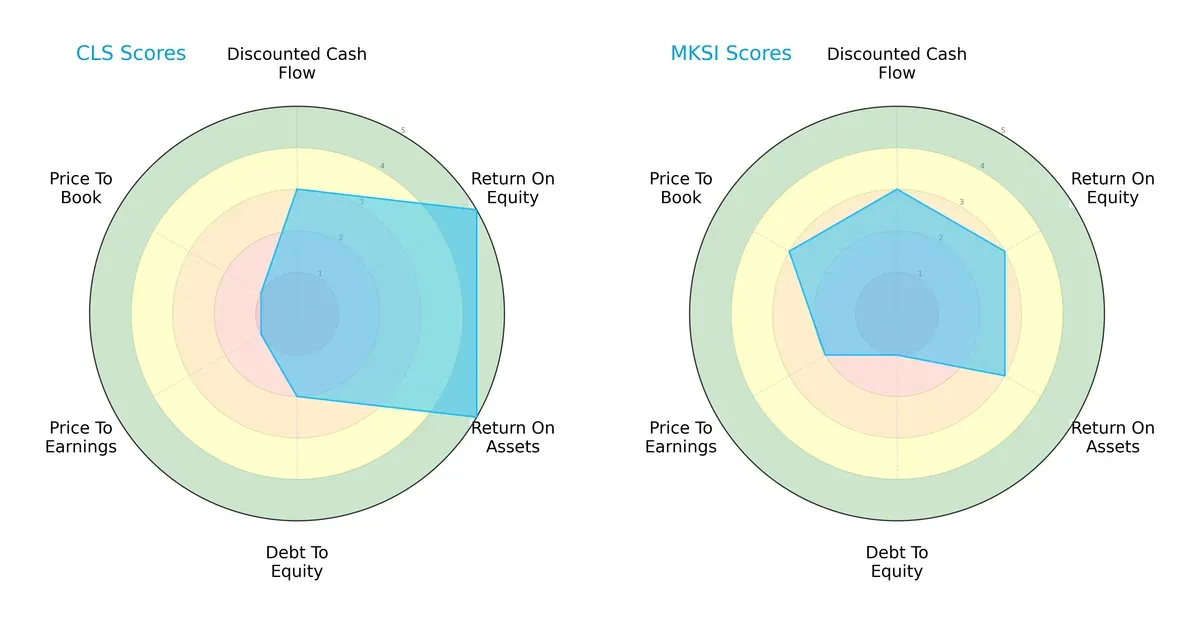
Celestica excels in return on equity (5) and assets (5), indicating superior profitability and asset efficiency. MKS shows moderate performance (3 each) but scores better on valuation metrics (PE: 2 vs. 1; PB: 3 vs. 1), suggesting more attractive pricing. Celestica’s higher debt-to-equity score (2 vs. 1) signals moderate leverage risk. Overall, Celestica has a strong operational edge, while MKS offers a more balanced valuation profile.
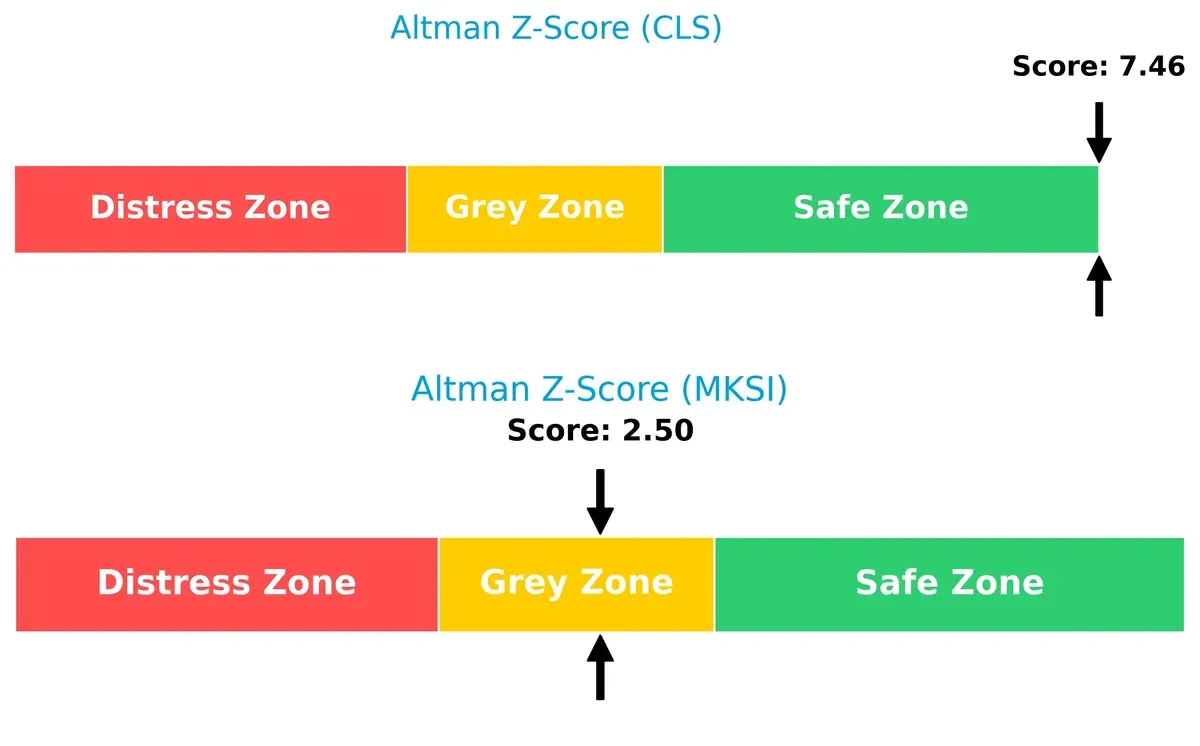
Bankruptcy Risk: Solvency Showdown
Celestica’s Altman Z-Score of 7.46 places it firmly in the safe zone, while MKS’s 2.50 situates it in the grey zone. This gap signals Celestica’s superior long-term solvency and lower bankruptcy risk in this cycle:
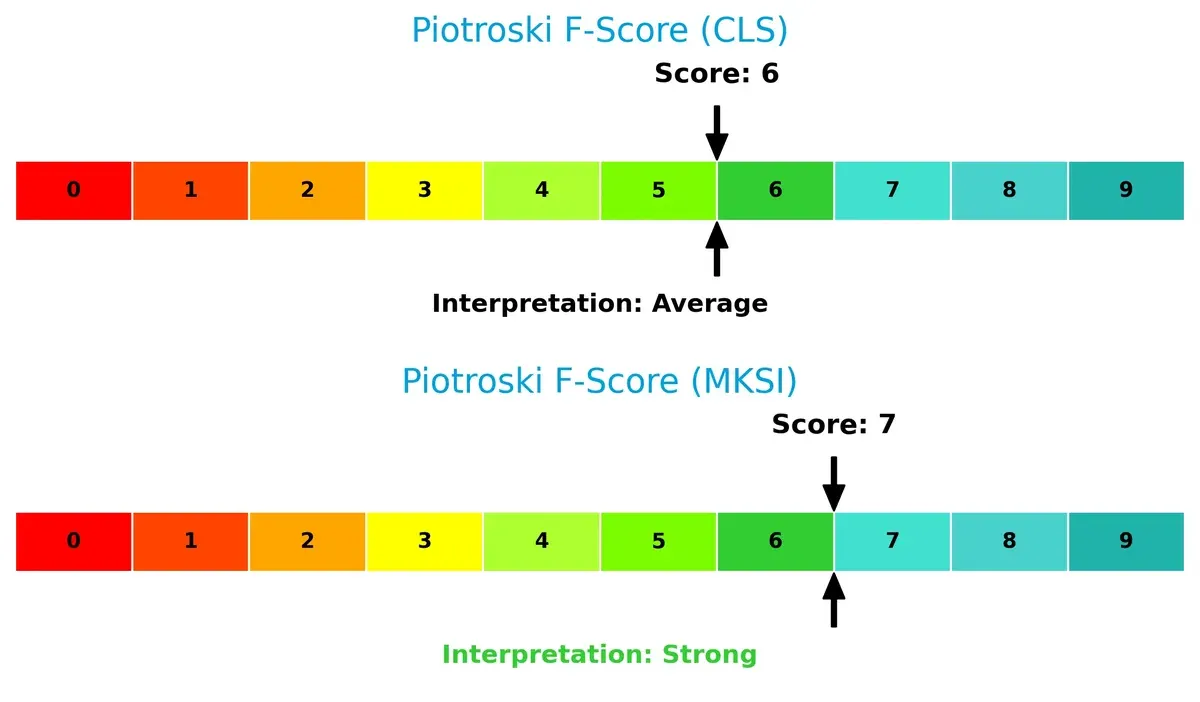
Financial Health: Quality of Operations
MKS leads with a Piotroski F-Score of 7, indicating strong financial health. Celestica’s score of 6 is average but still solid. Neither company shows critical red flags, though MKS’s internal metrics suggest a slightly stronger operational footing:
How are the two companies positioned?
This section dissects the operational DNA of Celestica and MKS by comparing their revenue distribution and internal dynamics. The goal is to confront their economic moats and identify which model offers the most resilient, sustainable competitive advantage today.
Revenue Segmentation: The Strategic Mix
This visual comparison dissects how Celestica Inc. and MKS Inc. diversify their income streams and where their primary sector bets lie:
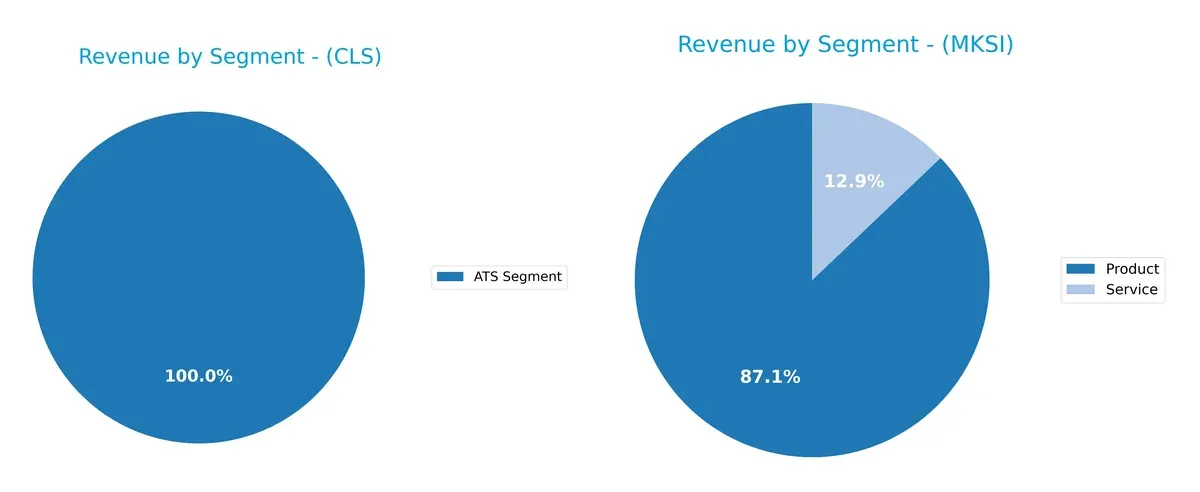
Celestica Inc. relies heavily on its ATS segment, generating $3.16B in 2024, showing a concentrated revenue base. MKS Inc. displays a more diversified mix, with $3.12B from Product sales and $462M from Services. This split suggests MKS pivots on multiple operational fronts, reducing concentration risk. Celestica’s focus on ATS anchors it in a specific ecosystem, possibly limiting flexibility but strengthening infrastructure dominance.
Strengths and Weaknesses Comparison
This table compares the strengths and weaknesses of Celestica Inc. and MKS Inc. based on financial and operational metrics:
Celestica Inc. Strengths
- Favorable ROE at 22.57% indicates strong profitability
- Low debt-to-assets at 13.3% supports financial stability
- High asset turnover of 1.61 shows efficient use of assets
- Fixed asset turnover of 14.58 reflects operational efficiency
MKS Inc. Strengths
- Diverse revenue streams from products and services totaling over 3.5B USD
- Favorable quick ratio at 2.04 indicates good liquidity
- Fixed asset turnover at 3.55 shows solid asset utilization
- Broad global presence including China, US, and Asia supports market diversification
Celestica Inc. Weaknesses
- Low net margin at 4.44% signals weak profitability
- Unfavorable P/E of 25.47 and P/B of 5.75 suggest overvaluation
- No dividend yield may deter income-focused investors
- Quick ratio below 1 at 0.91 hints at liquidity concerns
MKS Inc. Weaknesses
- High debt-to-assets at 55.65% raises solvency risk
- Low interest coverage at 1.51 indicates vulnerability to interest expenses
- Unfavorable ROE at 8.18% reflects weaker profitability
- High P/E at 36.98 and unfavorable current ratio show valuation and liquidity issues
Celestica shows strengths in profitability and capital efficiency but faces valuation and liquidity challenges. MKS’s strengths lie in diversified revenue and liquidity, yet heavy leverage and weaker profitability pose risks. Both companies must navigate these factors in their strategic planning.
The Moat Duel: Analyzing Competitive Defensibility
A structural moat shields long-term profits from competition erosion. Only a durable competitive advantage ensures sustained value creation:
Celestica Inc.: Supply Chain Mastery as a Switching Cost Moat
Celestica leverages integrated supply chain solutions, creating high switching costs for clients. Its strong revenue growth and margin expansion reflect this advantage. Continued diversification into advanced tech deepens the moat in 2026.
MKS Inc.: Precision Tech with Intangible Asset Moat
MKS relies on proprietary instruments and laser technologies, differentiating it from Celestica’s operational moat. However, declining ROIC signals weakening profitability. Market expansion in Asia offers growth, yet margin pressure poses risks.
Operational Excellence vs. Technological Edge: Who Defends Better?
Celestica’s widening moat through supply chain integration outpaces MKS’s shrinking intangible asset moat. I see Celestica better positioned to defend market share amid intensifying competition in 2026.
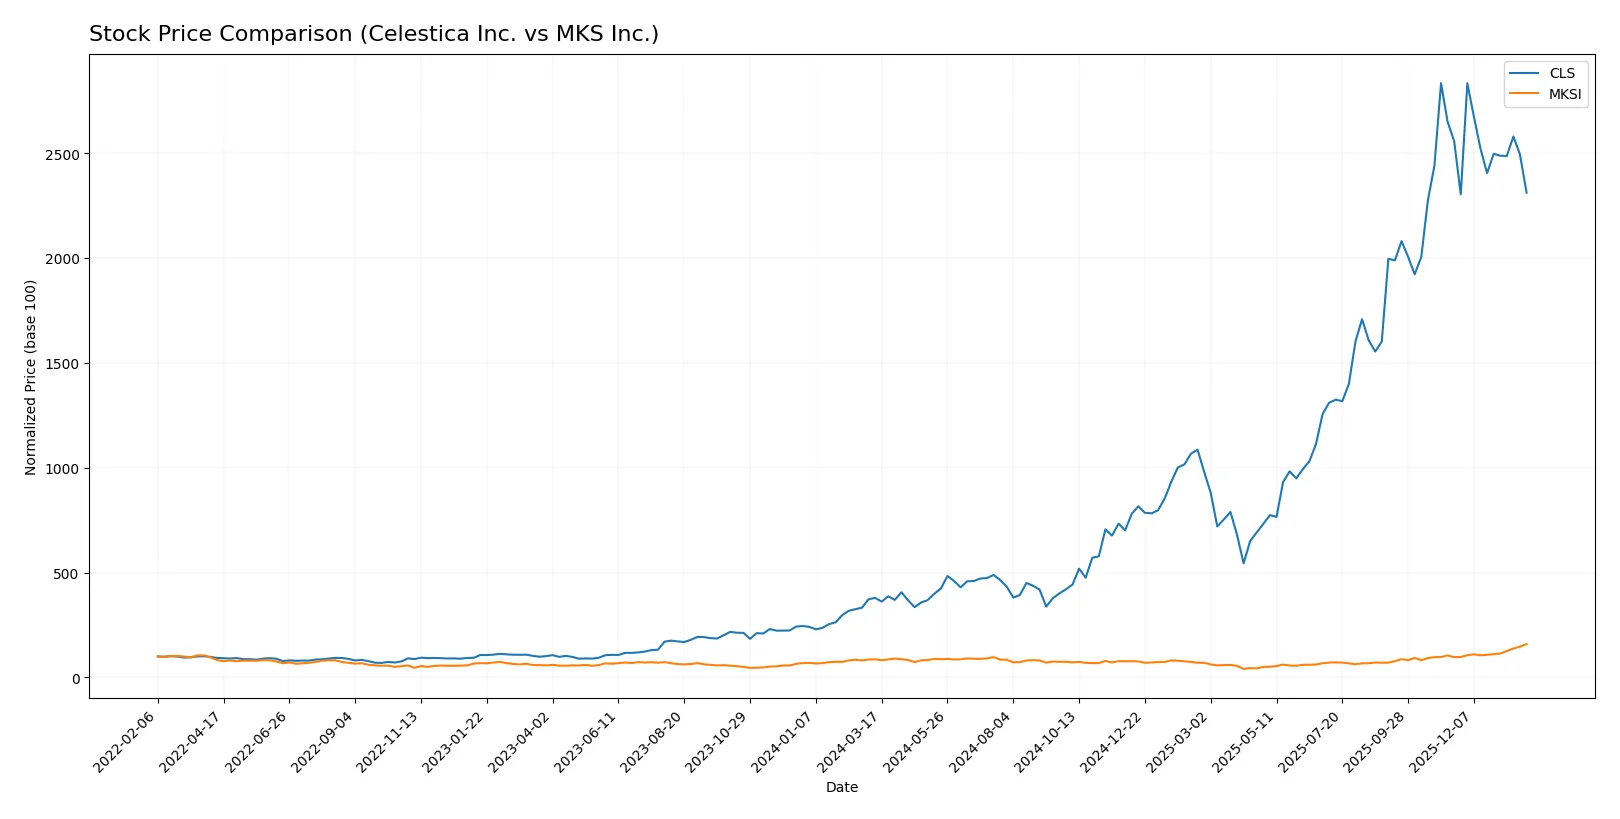
Which stock offers better returns?
The past year shows contrasting price dynamics: Celestica Inc. surged sharply before recent weakness, while MKS Inc. posted steady gains with accelerating momentum.
Trend Comparison
Celestica Inc. gained 510% over 12 months, marking a strong bullish trend. The trend decelerated recently with a 9.6% decline since November 2025. Volatility remains high at 92.63.
MKS Inc. rose 83.8% in the same period, maintaining a bullish, accelerating trend. Recent months saw a 64.9% increase with moderate volatility of 28.35, indicating sustained upward strength.
Comparing both, Celestica delivered the highest overall return but slowed recently. MKS shows consistent acceleration and strong near-term momentum, reflecting divergent trading dynamics.
Target Prices
Analysts present a bullish consensus with solid upside potential for both Celestica Inc. and MKS Inc.
| Company | Target Low | Target High | Consensus |
|---|---|---|---|
| Celestica Inc. | 300 | 440 | 365.6 |
| MKS Inc. | 151 | 265 | 223 |
Celestica’s consensus target sits about 30% above its current price, signaling strong growth expectations. MKS’s target consensus also exceeds its price by roughly 5%, indicating moderate upside potential.

Don’t Let Luck Decide Your Entry Point
Optimize your entry points with our advanced ProRealTime indicators. You’ll get efficient buy signals with precise price targets for maximum performance. Start outperforming now!
How do institutions grade them?
The following summarizes recent institutional grades for Celestica Inc. and MKS Inc.:
Celestica Inc. Grades
This table shows recent grades issued by major financial institutions for Celestica Inc.:
| Grading Company | Action | New Grade | Date |
|---|---|---|---|
| Citigroup | Maintain | Buy | 2026-01-30 |
| Barclays | Maintain | Overweight | 2026-01-30 |
| Goldman Sachs | Maintain | Buy | 2025-12-01 |
| Barclays | Maintain | Overweight | 2025-11-14 |
| Citigroup | Upgrade | Buy | 2025-11-10 |
| Goldman Sachs | Maintain | Buy | 2025-10-29 |
| CIBC | Maintain | Outperform | 2025-10-29 |
| Stifel | Maintain | Buy | 2025-10-29 |
| Barclays | Maintain | Overweight | 2025-10-29 |
| JP Morgan | Maintain | Overweight | 2025-10-29 |
MKS Inc. Grades
This table displays recent grades from reputable firms for MKS Inc.:
| Grading Company | Action | New Grade | Date |
|---|---|---|---|
| Needham | Maintain | Buy | 2026-01-22 |
| TD Cowen | Maintain | Buy | 2026-01-22 |
| Morgan Stanley | Maintain | Overweight | 2026-01-22 |
| Wells Fargo | Maintain | Equal Weight | 2026-01-22 |
| B of A Securities | Maintain | Buy | 2026-01-22 |
| Cantor Fitzgerald | Maintain | Overweight | 2026-01-20 |
| Keybanc | Maintain | Overweight | 2026-01-16 |
| Wells Fargo | Maintain | Equal Weight | 2026-01-15 |
| Needham | Maintain | Buy | 2026-01-13 |
| B of A Securities | Maintain | Buy | 2026-01-13 |
Which company has the best grades?
Celestica consistently receives Buy and Overweight ratings from top-tier institutions, including upgrades. MKS also earns Buy and Overweight grades but shows some Equal Weight ratings. Celestica’s stronger consensus may signal higher institutional confidence, potentially influencing investor sentiment.
Risks specific to each company
The following categories identify critical pressure points and systemic threats facing Celestica Inc. and MKS Inc. in the 2026 market environment:
1. Market & Competition
Celestica Inc.
- Faces fierce competition in hardware and supply chain services, with margin pressure evident in net margin and P/E ratios.
MKS Inc.
- Operates in niche instrument and control markets but endures higher valuation multiples and competitive innovation risks.
2. Capital Structure & Debt
Celestica Inc.
- Maintains a conservative capital structure with low debt-to-equity (0.42) and solid interest coverage (19.69), reducing financial risk.
MKS Inc.
- High leverage with debt-to-equity at 2.06 and weak interest coverage (1.51) signals financial vulnerability and refinancing risk.
3. Stock Volatility
Celestica Inc.
- Beta of 1.46 indicates moderate sensitivity to market swings, consistent with sector norms.
MKS Inc.
- Elevated beta of 1.92 suggests higher stock price volatility, increasing risk for investors.
4. Regulatory & Legal
Celestica Inc.
- Global operations expose it to complex regulatory compliance, especially in aerospace and defense sectors.
MKS Inc.
- Faces stringent regulations in semiconductor and health sciences markets, potentially increasing compliance costs.
5. Supply Chain & Operations
Celestica Inc.
- Relies on global supply chains vulnerable to geopolitical disruptions but benefits from diversified manufacturing services.
MKS Inc.
- Dependence on specialized components and precision manufacturing may create operational bottlenecks amid supply constraints.
6. ESG & Climate Transition
Celestica Inc.
- Increasing pressure to meet ESG standards in energy and industrial sectors; no dividend yield may limit investor appeal.
MKS Inc.
- Faces ESG scrutiny in energy-intensive manufacturing; dividend presence may attract income-focused investors despite risks.
7. Geopolitical Exposure
Celestica Inc.
- Exposure to North America, Europe, and Asia subjects it to trade tensions and regional instability risks.
MKS Inc.
- Primarily US-based but global clients mean vulnerability to international conflicts and tariff changes.
Which company shows a better risk-adjusted profile?
Celestica’s strongest risk lies in competitive margin pressure, while MKS faces critical financial distress risks from heavy debt. Celestica’s conservative leverage and solid interest coverage offer a safer risk-adjusted profile. MKS’s higher beta and debt elevate its risk significantly. Recent data show Celestica’s Altman Z-score in the safe zone (7.46) versus MKS in the grey zone (2.50), underscoring greater financial stability for Celestica.
Final Verdict: Which stock to choose?
Celestica Inc. (CLS) shines as a cash-generating powerhouse with a strong and improving ROIC trend. Its efficiency in capital use fuels robust earnings growth. A point of vigilance remains in its moderate liquidity ratios, which could pressure short-term resilience. CLS suits portfolios seeking aggressive growth with a value tilt.
MKS Inc. (MKSI) offers a strategic moat through its premium gross margins and substantial R&D investment, signaling innovation leadership. Its high current ratio provides a liquidity cushion, yet heavy leverage and declining ROIC highlight financial risk. MKSI fits GARP investors who prioritize growth coupled with reasonable safety buffers.
If you prioritize capital efficiency and earnings momentum, CLS is the compelling choice due to its clear value creation and operational strength. However, if you seek innovation-driven growth with better short-term liquidity, MKSI offers superior strategic moat despite higher risk. Both present analytical scenarios tailored to distinct investor risk tolerances.
Disclaimer: Investment carries a risk of loss of initial capital. The past performance is not a reliable indicator of future results. Be sure to understand risks before making an investment decision.
Go Further
I encourage you to read the complete analyses of Celestica Inc. and MKS Inc. to enhance your investment decisions: