Home > Comparison > Technology > CLS vs MVIS
The strategic rivalry between Celestica Inc. and MicroVision, Inc. shapes the competitive landscape of the technology hardware sector. Celestica operates as a capital-intensive hardware platform and supply chain solutions provider across diverse industries. Conversely, MicroVision focuses on innovative lidar sensor technology and micro-display systems within automotive and AR markets. This analysis evaluates which operational model offers a superior risk-adjusted return, guiding portfolio decisions amid evolving sector dynamics.
Table of contents
Companies Overview
Celestica Inc. and MicroVision, Inc. represent contrasting forces in the hardware equipment sector with distinct market footprints.
Celestica Inc.: Global Supply Chain Solutions Leader
Celestica Inc. dominates as a provider of hardware platform and supply chain solutions across North America, Europe, and Asia. Its core revenue engine lies in manufacturing, engineering, and supply chain management services for diverse industries including aerospace, defense, and cloud-based providers. In 2026, Celestica emphasizes expanding its Advanced Technology and Connectivity & Cloud Solutions to meet evolving enterprise infrastructure demands.
MicroVision, Inc.: Innovator in Lidar and Display Technologies
MicroVision, Inc. leads in developing lidar sensors and micro-display technologies for automotive safety, autonomous driving, and augmented reality. Its revenue stems from cutting-edge laser beam scanning and MEMS-based modules sold primarily to OEMs and ODMs. The company’s 2026 strategy focuses on advancing long-range lidar and enhancing PicoP scanning for immersive AR experiences.
Strategic Collision: Similarities & Divergences
Both companies operate in hardware but diverge in scale and focus—Celestica runs a broad supply chain platform, while MicroVision pioneers niche sensing technologies. Their battleground is technology integration in automotive and cloud sectors. Celestica, with a massive workforce and global reach, offers stability; MicroVision’s small size and innovation-driven model present higher volatility but potential for rapid growth.
Income Statement Comparison
This data dissects the core profitability and scalability of both corporate engines to reveal who dominates the bottom line:
| Metric | Celestica Inc. (CLS) | MicroVision, Inc. (MVIS) |
|---|---|---|
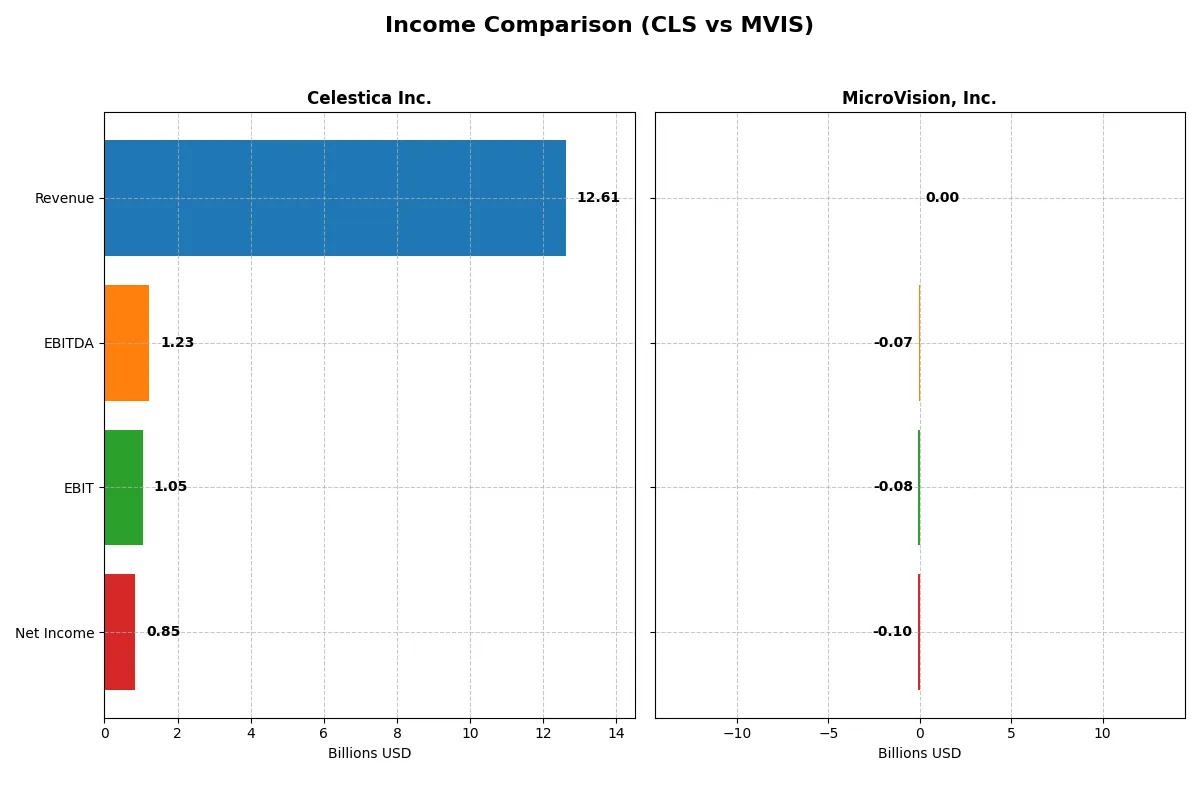
| Revenue | 12.6B | 4.7M |
| Cost of Revenue | 11.1B | 7.5M |
| Operating Expenses | 385M | 83M |
| Gross Profit | 1.47B | -2.8M |
| EBITDA | 1.23B | -71M |
| EBIT | 1.05B | -75M |
| Interest Expense | 54M | 4.5M |
| Net Income | 847M | -97M |
| EPS | 7.22 | -0.46 |
| Fiscal Year | 2025 | 2024 |
Income Statement Analysis: The Bottom-Line Duel
This income statement comparison reveals which company operates with greater efficiency and profitability in their core business engines.
Celestica Inc. Analysis
Celestica Inc. shows robust revenue growth from $5.6B in 2021 to $12.6B in 2025, more than doubling top-line sales. Net income surged from $104M to $847M, reflecting strong margin expansion. Its gross margin remains stable near 11.7%, while net margin climbed to a favorable 6.7% in 2025, signaling improved cost control and operational leverage.
MicroVision, Inc. Analysis
MicroVision’s revenue peaked at $7.3M in 2023 but dropped 35% to $4.7M in 2024. The company struggles with persistent losses, posting a net loss of $97M in 2024. Gross margin turned negative at -60%, and net margin deeply negative at -2064%, indicating severe inefficiencies and high operating expenses relative to revenue.
Verdict: Consistent Profitability vs. Persistent Losses
Celestica clearly outperforms MicroVision with consistent revenue growth and expanding profitability, achieving favorable margins and operational efficiency. MicroVision’s worsening losses and negative margins highlight structural challenges. For investors, Celestica’s stable profit profile offers a fundamentally stronger case compared to MicroVision’s high-risk, loss-making trajectory.
Financial Ratios Comparison
These vital ratios act as a diagnostic tool to expose the underlying fiscal health, valuation premiums, and capital efficiency of the companies compared below:
| Ratios | Celestica Inc. (CLS) | MicroVision, Inc. (MVIS) |
|---|---|---|
| ROE | 22.6% | -198.7% |
| ROIC | 16.1% | -83.7% |
| P/E | 25.5 | -2.8 |
| P/B | 5.75 | 5.63 |
| Current Ratio | 1.49 | 1.79 |
| Quick Ratio | 0.91 | 1.74 |
| D/E | 0.42 | 1.06 |
| Debt-to-Assets | 13.3% | 42.6% |
| Interest Coverage | 11.5 | -19.2 |
| Asset Turnover | 1.61 | 0.04 |
| Fixed Asset Turnover | 14.58 | 0.20 |
| Payout ratio | 0 | 0 |
| Dividend yield | 0 | 0 |
| Fiscal Year | 2024 | 2024 |
Efficiency & Valuation Duel: The Vital Signs
Financial ratios act as a company’s DNA, exposing hidden risks and operational strengths critical for investment decisions.
Celestica Inc.
Celestica posts a strong 22.57% ROE, signaling solid profitability despite a modest 4.44% net margin. Its P/E of 25.47 suggests a stretched valuation versus peers. The firm maintains no dividend, reinvesting cash into operational efficiency and moderate growth, supported by favorable asset turnover and conservative debt levels.
MicroVision, Inc.
MicroVision suffers from deeply negative profitability ratios: a -198.72% ROE and -2063.78% net margin. Despite a seemingly attractive negative P/E, this reflects losses rather than value. High R&D spend inflates costs, with no dividends paid. The company’s balance sheet shows weaker leverage control and poor asset turnover, highlighting operational challenges.
Premium Valuation vs. Operational Safety
Celestica offers a healthier balance of profitability and risk, though its valuation appears stretched. MicroVision’s metrics reveal severe operational and financial weakness. Investors prioritizing steady returns and risk control may find Celestica’s profile more suitable, while MicroVision fits a high-risk, speculative approach.
Which one offers the Superior Shareholder Reward?
Celestica Inc. (CLS) opts for zero dividends but maintains solid free cash flow (2.57/share) and moderate payout ratios, focusing on sustainable buybacks as a core distribution method. MicroVision, Inc. (MVIS) pays no dividends and delivers negative free cash flow, relying heavily on reinvestment to fuel growth amid persistent losses. CLS’s buybacks and positive cash flow coverage present a more durable shareholder return model. I conclude CLS offers a superior total return profile in 2026, balancing capital returns and financial stability better than the volatile, cash-burning MVIS.
Comparative Score Analysis: The Strategic Profile
The radar chart captures the fundamental DNA and trade-offs of Celestica Inc. and MicroVision, Inc., highlighting their core financial strengths and vulnerabilities:
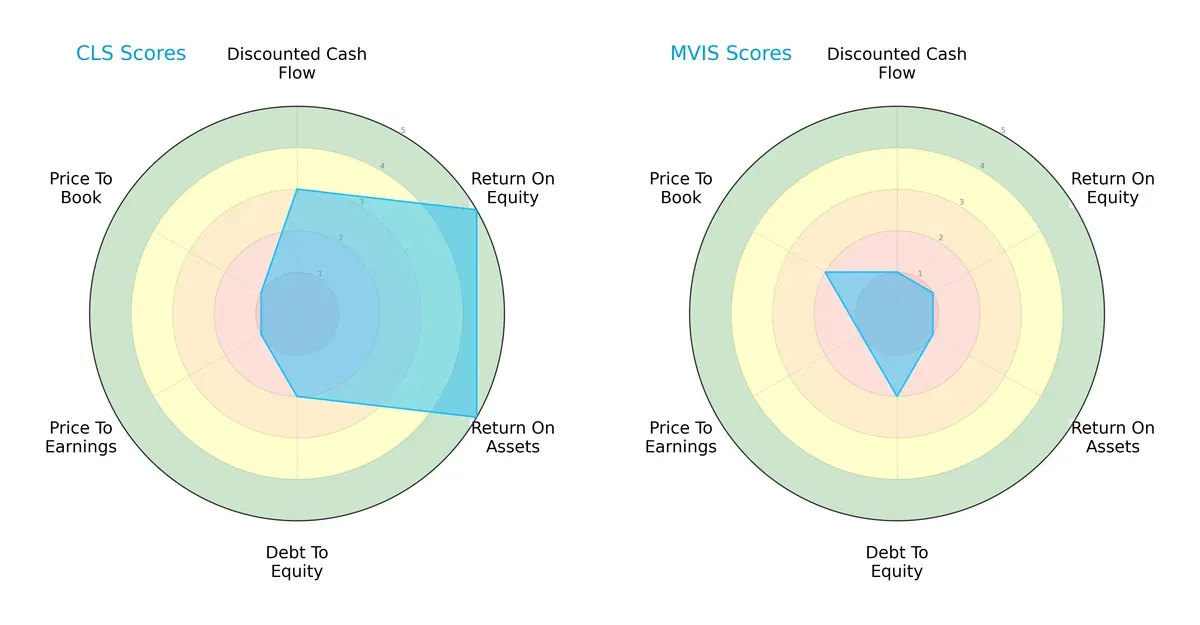
Celestica displays a balanced profile with strong ROE (5) and ROA (5) scores, reflecting efficient capital and asset utilization. However, its valuation metrics (PE/PB scores of 1) signal significant market undervaluation or skepticism. MicroVision relies heavily on its debt-to-equity score (2) but struggles across all profitability and cash flow metrics, showing an unbalanced and weak operational footprint.
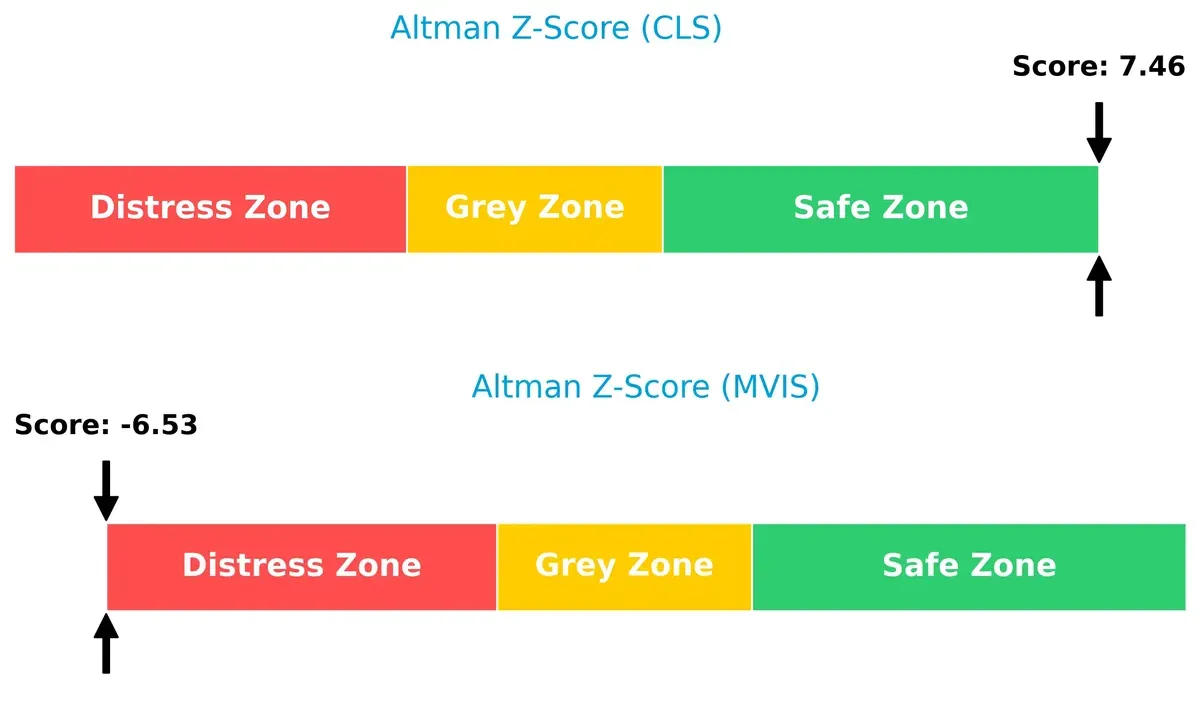
Bankruptcy Risk: Solvency Showdown
Celestica’s Altman Z-Score of 7.46 places it firmly in the safe zone, indicating robust financial stability. In stark contrast, MicroVision’s -6.53 score signals severe distress and a high bankruptcy risk in this cycle:
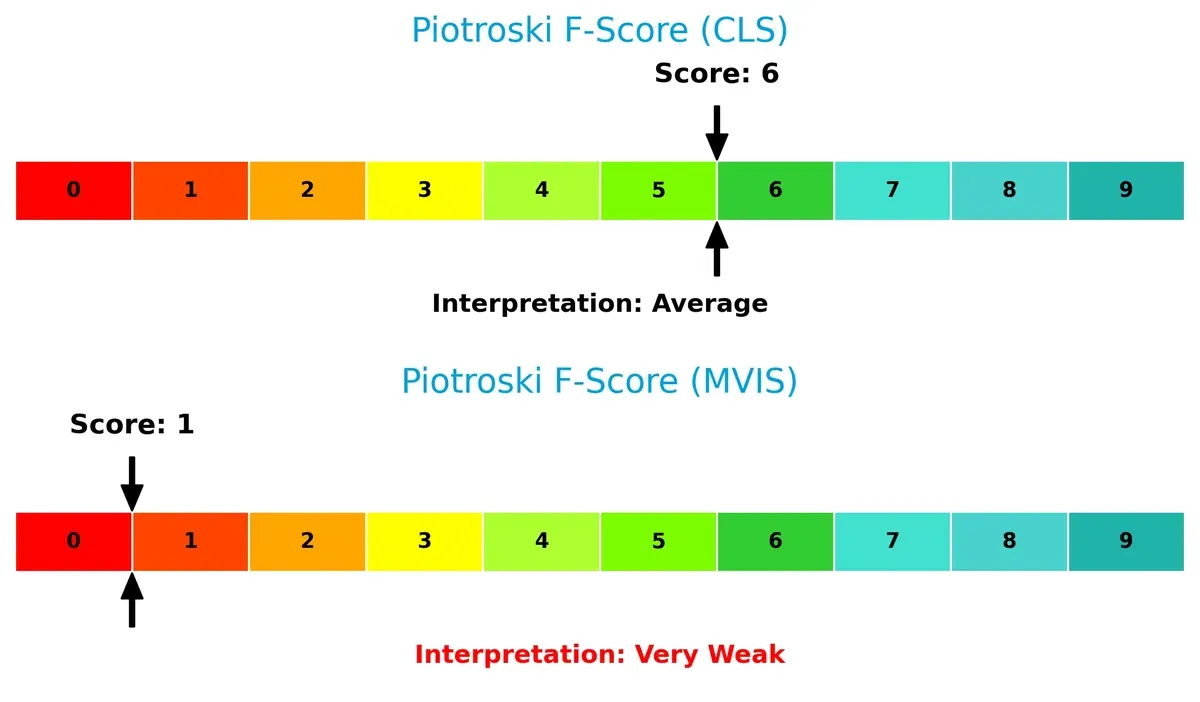
Financial Health: Quality of Operations
Celestica’s Piotroski F-Score of 6 signals average but stable financial health with no glaring red flags. MicroVision scores just 1, indicating very weak internal financial metrics and operational risks that investors must heed:
How are the two companies positioned?
This section dissects the operational DNA of Celestica and MicroVision by comparing their revenue distribution and internal dynamics. The goal is to confront their economic moats and identify which model offers the most resilient competitive advantage today.
Revenue Segmentation: The Strategic Mix
This comparison dissects how Celestica Inc. and MicroVision, Inc. diversify income streams and highlights their primary sector bets:
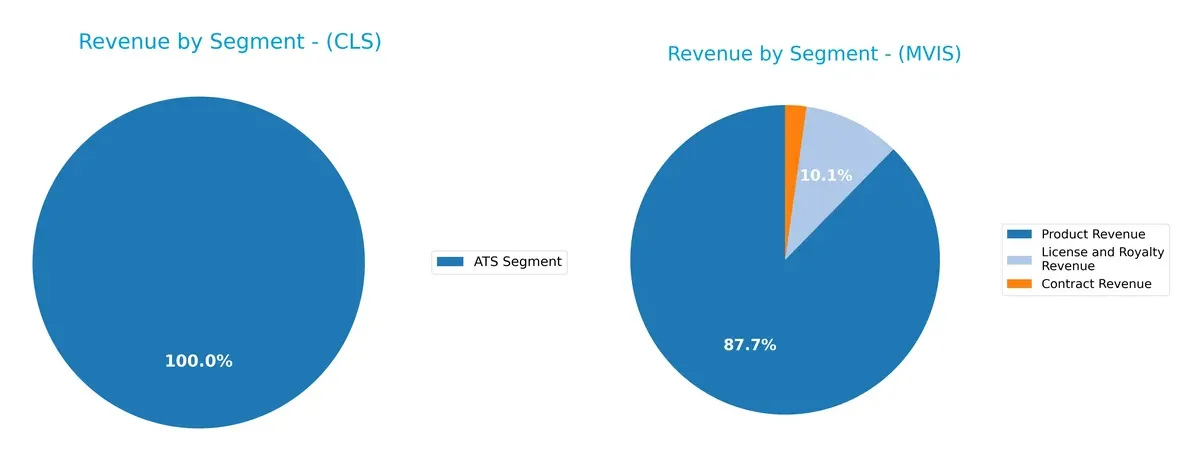
Celestica’s revenue anchors entirely in its ATS Segment, with $3.16B, revealing a focused, infrastructure-dependent model. MicroVision displays a more diversified mix with $4.12M in Product Revenue, $475K from License and Royalty, and $104K Contract Revenue in 2024. MicroVision’s spread reduces concentration risk but limits ecosystem lock-in compared to Celestica’s dominant segment, which suggests stronger control but higher exposure to sector cyclicality.
Strengths and Weaknesses Comparison
This table compares the Strengths and Weaknesses of Celestica Inc. and MicroVision, Inc.:
Celestica Inc. Strengths
- Favorable ROE of 22.57%
- Low debt-to-equity at 0.42
- Strong interest coverage at 19.69
- High asset turnover of 1.61
- Stable current ratio of 1.49
MicroVision, Inc. Strengths
- Favorable PE ratio at -2.83
- Strong current ratio of 1.79
- High quick ratio of 1.74
- Neutral WACC at 9.53%
Celestica Inc. Weaknesses
- Unfavorable net margin at 4.44%
- Unfavorable PE at 25.47
- Unfavorable PB at 5.75
- Zero dividend yield
- Unavailable ROIC and WACC
MicroVision, Inc. Weaknesses
- Highly negative net margin at -2063.78%
- Negative ROE and ROIC
- Unfavorable debt-to-equity at 1.06
- Poor interest coverage at -16.87
- Very low asset turnover of 0.04
- Zero dividend yield
Celestica shows financial stability with strong profitability metrics but faces valuation concerns. MicroVision struggles with profitability and leverage despite liquidity strengths. These contrasts suggest differing strategic challenges and priorities.
The Moat Duel: Analyzing Competitive Defensibility
A structural moat shields long-term profits from relentless competitive erosion. Here’s how Celestica and MicroVision defend their turf:
Celestica Inc.: Supply Chain Mastery & Scale Advantage
Celestica’s moat stems from scale and operational expertise in complex manufacturing and supply chain solutions. Its margin stability and soaring 123% revenue growth affirm efficient capital use. Expansion into cloud and aerospace sectors in 2026 could deepen this advantage.
MicroVision, Inc.: Innovation-Driven Niche Moat
MicroVision’s moat hinges on proprietary lidar and scanning technology, a stark contrast to Celestica’s scale. Despite heavy losses, recent ROIC growth signals potential value creation. Success depends on commercializing AR and automotive lidar markets amid fierce competition.
Scale Efficiency vs. Technology Innovation: The Moat Showdown
Celestica’s expansive scale and robust margin growth build a wider, more durable moat than MicroVision’s emerging but unprofitable tech niche. Celestica is better positioned to defend and grow its market share in 2026.
Which stock offers better returns?
Both Celestica Inc. and MicroVision, Inc. experienced significant price movements over the past year, with Celestica showing a strong overall gain despite recent declines, while MicroVision faced sustained losses and lower volatility.
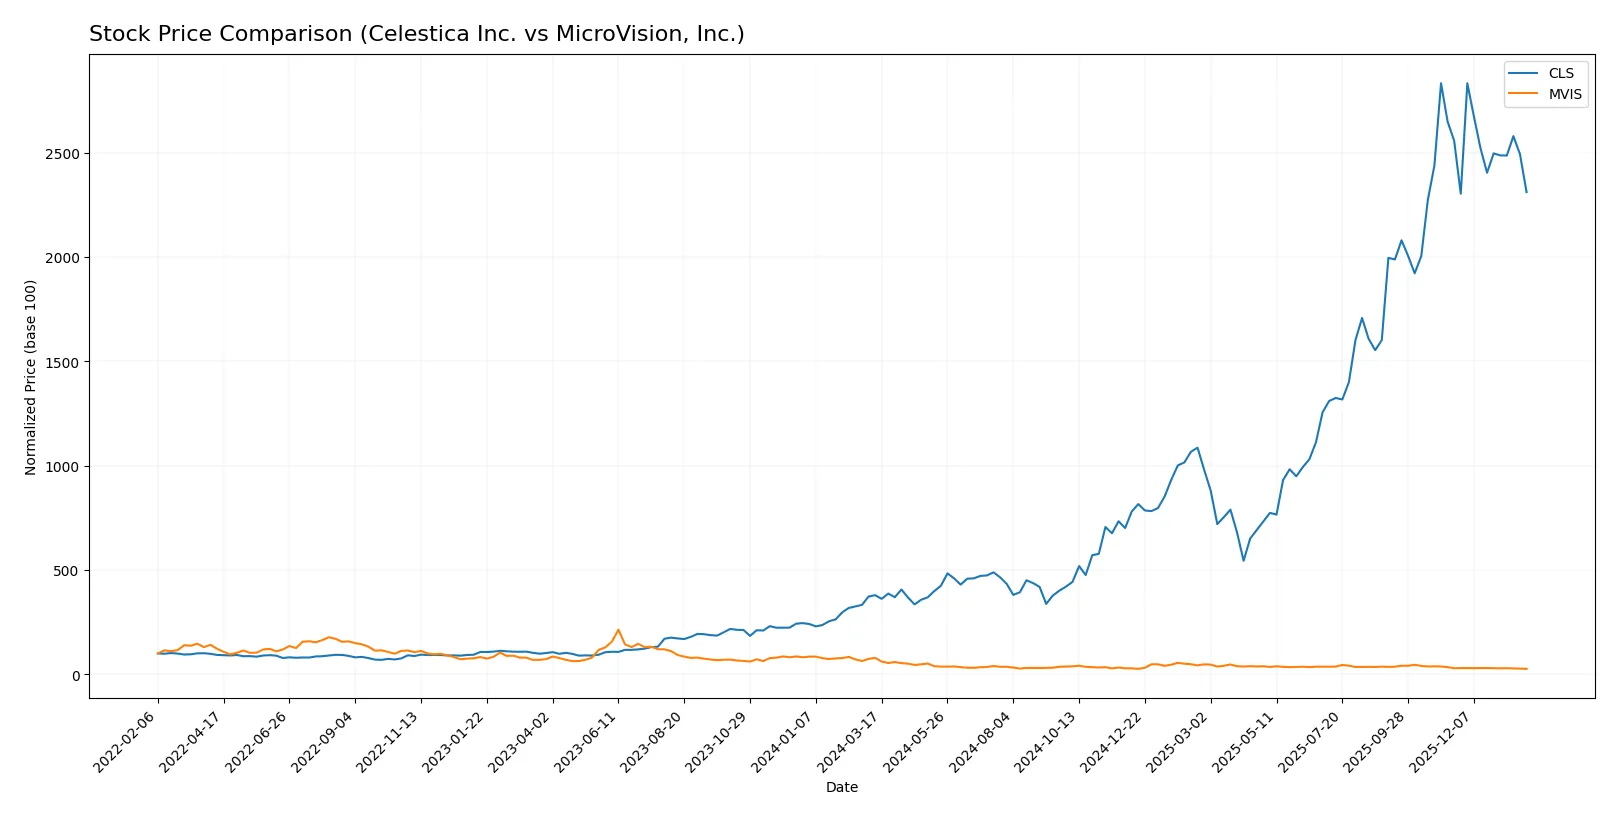
Trend Comparison
Celestica’s stock surged 510% over the last 12 months, reflecting a bullish trend with decelerating momentum. It peaked at 344.48 and bottomed at 40.73, showing high volatility (92.63 std dev).
MicroVision’s stock declined 67% over the same period, signaling a bearish trend with decelerating losses. Its price ranged narrowly between 0.81 and 2.47, with minimal volatility (0.26 std dev).
Celestica clearly outperformed MicroVision in market returns, delivering strong positive growth while MicroVision struggled with persistent declines throughout the year.
Target Prices
Analysts show a positive outlook with clear upside potential for both Celestica Inc. and MicroVision, Inc.
| Company | Target Low | Target High | Consensus |
|---|---|---|---|
| Celestica Inc. | 300 | 440 | 365.6 |
| MicroVision, Inc. | 5 | 5 | 5 |
Celestica’s consensus target of 365.6 suggests a 30% premium over its current 281 price, indicating strong growth expectations. MicroVision’s flat target at 5 signals significant upside from its 0.81 trading level, reflecting high risk and reward.

Don’t Let Luck Decide Your Entry Point
Optimize your entry points with our advanced ProRealTime indicators. You’ll get efficient buy signals with precise price targets for maximum performance. Start outperforming now!
How do institutions grade them?
This section compares recent institutional grades assigned to Celestica Inc. and MicroVision, Inc.:
Celestica Inc. Grades
The following table shows Celestica’s recent grades from established financial institutions.
| Grading Company | Action | New Grade | Date |
|---|---|---|---|
| Citigroup | Maintain | Buy | 2026-01-30 |
| Barclays | Maintain | Overweight | 2026-01-30 |
| Goldman Sachs | Maintain | Buy | 2025-12-01 |
| Barclays | Maintain | Overweight | 2025-11-14 |
| Citigroup | Upgrade | Buy | 2025-11-10 |
| Goldman Sachs | Maintain | Buy | 2025-10-29 |
| CIBC | Maintain | Outperform | 2025-10-29 |
| Stifel | Maintain | Buy | 2025-10-29 |
| Barclays | Maintain | Overweight | 2025-10-29 |
| JP Morgan | Maintain | Overweight | 2025-10-29 |
MicroVision, Inc. Grades
Below are MicroVision’s recent grades from recognized financial institutions.
| Grading Company | Action | New Grade | Date |
|---|---|---|---|
| D. Boral Capital | Maintain | Buy | 2026-01-27 |
| D. Boral Capital | Maintain | Buy | 2025-12-16 |
| D. Boral Capital | Maintain | Buy | 2025-11-12 |
| WestPark Capital | Maintain | Buy | 2025-10-21 |
| WestPark Capital | Maintain | Buy | 2025-09-05 |
| D. Boral Capital | Maintain | Buy | 2025-09-02 |
| WestPark Capital | Maintain | Buy | 2025-08-27 |
| D. Boral Capital | Maintain | Buy | 2025-08-11 |
| D. Boral Capital | Maintain | Buy | 2025-05-21 |
| D. Boral Capital | Maintain | Buy | 2025-05-13 |
Which company has the best grades?
Celestica receives consistent “Buy,” “Overweight,” and “Outperform” ratings from major banks, indicating broader institutional confidence. MicroVision’s grades are uniformly “Buy” from smaller firms. Investors may view Celestica’s diverse and higher-tier endorsements as a stronger validation signal.
Risks specific to each company
In 2026’s challenging market environment, the following categories highlight key pressure points and systemic threats confronting both firms:
1. Market & Competition
Celestica Inc.
- Operates in mature hardware and supply chain sectors with established clients, facing intense global competition.
MicroVision, Inc.
- Focuses on niche lidar and AR tech markets, competing with larger players and struggling to scale revenue.
2. Capital Structure & Debt
Celestica Inc.
- Maintains a conservative debt-to-equity ratio (0.42), low leverage, and strong interest coverage.
MicroVision, Inc.
- Exhibits high leverage (D/E 1.06) and negative interest coverage, signaling financial distress risk.
3. Stock Volatility
Celestica Inc.
- Beta of 1.46 shows moderate volatility typical for tech hardware firms.
MicroVision, Inc.
- Beta of 1.27 indicates somewhat lower volatility but amplified by low share price and liquidity concerns.
4. Regulatory & Legal
Celestica Inc.
- Faces standard tech and manufacturing regulations across multiple regions, with manageable compliance risk.
MicroVision, Inc.
- Operates in automotive safety and AR sectors, subject to evolving regulatory scrutiny and potential product liability issues.
5. Supply Chain & Operations
Celestica Inc.
- Benefits from diversified global supply chain but exposed to geopolitical disruptions in Asia and Europe.
MicroVision, Inc.
- Relies on specialized components for lidar tech; supply constraints could delay product development and sales.
6. ESG & Climate Transition
Celestica Inc.
- Increasing ESG focus required due to manufacturing footprint; transitioning to sustainable operations is capital intensive.
MicroVision, Inc.
- Smaller scale eases ESG compliance but future growth depends on sustainable tech adoption and investor sentiment.
7. Geopolitical Exposure
Celestica Inc.
- High exposure to North America, Europe, and Asia; vulnerable to trade tensions and tariffs.
MicroVision, Inc.
- Primarily US-based but supply chain and customer base may be impacted by geopolitical uncertainties in automotive and tech sectors.
Which company shows a better risk-adjusted profile?
Celestica’s strongest risk lies in its global supply chain vulnerability amid geopolitical tensions. MicroVision struggles with severe financial distress and operational scalability. Celestica’s conservative leverage and safe Altman Z-score position it with a clearly superior risk-adjusted profile. Recent data reveal MicroVision’s Altman Z-score deep in distress and negative returns, raising urgent solvency concerns.
Final Verdict: Which stock to choose?
Celestica Inc. impresses with its growing return on invested capital and operational efficiency, marking it as a robust value creator. Its main point of vigilance lies in its relatively high price multiples, which could limit near-term upside. It suits investors seeking steady growth with a moderate risk appetite.
MicroVision, Inc. holds a niche strategic moat in cutting-edge R&D, though it currently struggles with profitability and financial stability. Compared to Celestica, it offers a riskier profile but potential for turnaround if innovation translates into scalable revenue. This stock fits speculative, high-risk portfolios focused on early-stage growth.
If you prioritize capital efficiency and proven financial strength, Celestica outshines as the compelling choice due to its consistent value creation and operational resilience. However, if you seek high-risk, high-reward scenarios driven by innovation potential, MicroVision offers a speculative play with a chance for outsized gains despite weaker fundamentals. Both require careful risk management aligned with your investment strategy.
Disclaimer: Investment carries a risk of loss of initial capital. The past performance is not a reliable indicator of future results. Be sure to understand risks before making an investment decision.
Go Further
I encourage you to read the complete analyses of Celestica Inc. and MicroVision, Inc. to enhance your investment decisions: