Home > Comparison > Technology > CLS vs MLAB
The strategic rivalry between Celestica Inc. and Mesa Laboratories, Inc. shapes the evolving landscape of the Technology sector. Celestica operates as a capital-intensive hardware and supply chain solutions provider with a broad industrial footprint. In contrast, Mesa specializes in high-margin, niche life sciences tools and quality control products. This analysis will evaluate which company’s business model offers superior risk-adjusted returns for a diversified portfolio amid sector dynamics.
Table of contents
Companies Overview
Celestica and Mesa Laboratories both play crucial roles in the hardware and equipment sector, serving distinct technology markets worldwide.
Celestica Inc.: Global Hardware & Supply Chain Solutions Leader
Celestica dominates in providing hardware platforms and comprehensive supply chain services across North America, Europe, and Asia. Its revenue mainly stems from manufacturing, engineering, logistics, and after-market repair across segments like Advanced Technology and Connectivity & Cloud Solutions. In 2026, Celestica focuses on enhancing integrated supply chain capabilities to support aerospace, defense, and hyperscaler clients.
Mesa Laboratories, Inc.: Precision Life Sciences Instrumentation Innovator
Mesa Laboratories specializes in life sciences tools and quality control products with a strong footprint in sterilization and disinfection control, biopharmaceutical development, and clinical genomics. It generates revenue by selling automated protein analysis systems, calibration devices, and genetic testing tools. Its 2026 strategy emphasizes expanding automated solutions and genetic testing for healthcare and pharmaceutical industries.
Strategic Collision: Similarities & Divergences
Both companies excel in hardware but serve vastly different niches: Celestica offers broad hardware manufacturing with a supply chain moat, while Mesa delivers specialized scientific instrumentation with precision focus. Their key battleground is technological innovation supporting critical industries—Celestica in cloud and defense, Mesa in healthcare diagnostics. This contrast defines distinct investment profiles: Celestica’s scale-driven diversification versus Mesa’s niche-driven specialized growth.
Income Statement Comparison
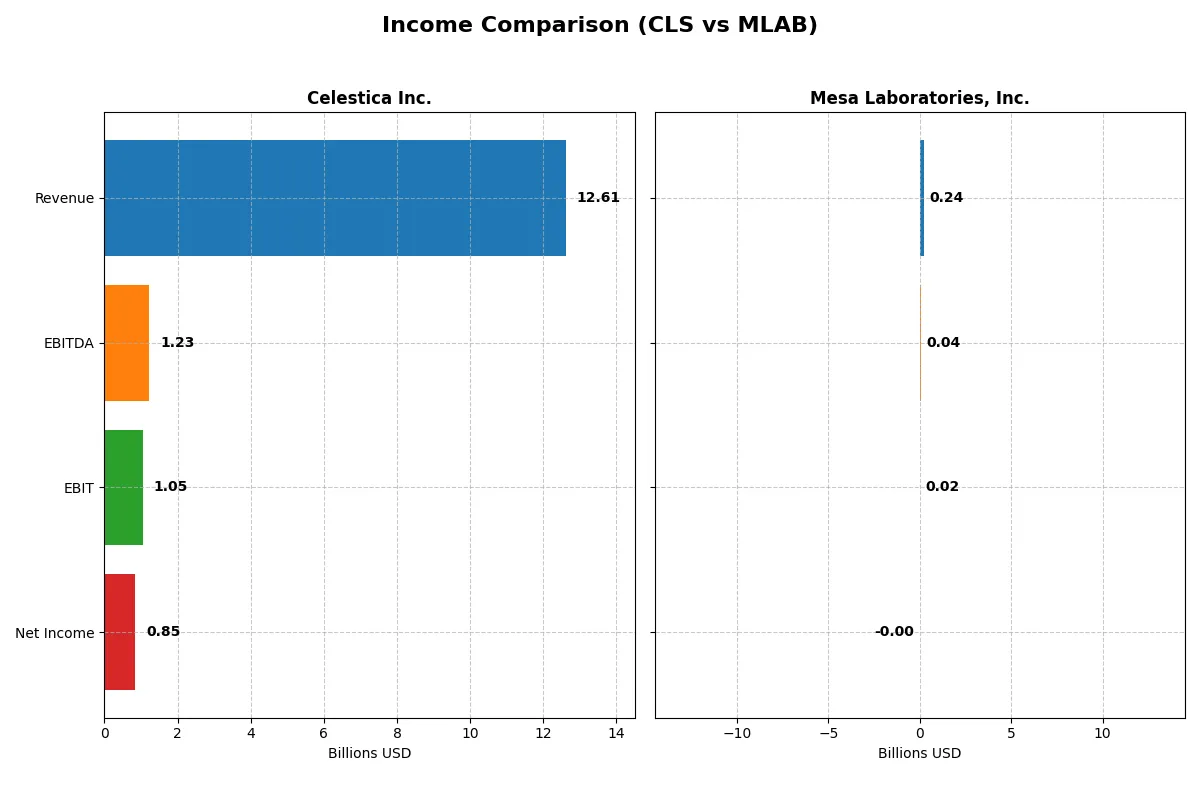
The following data dissects the core profitability and scalability of both corporate engines to reveal who dominates the bottom line:
| Metric | Celestica Inc. (CLS) | Mesa Laboratories, Inc. (MLAB) |
|---|---|---|
| Revenue | 12.6B | 241M |
| Cost of Revenue | 11.1B | 90.1M |
| Operating Expenses | 385M | 135M |
| Gross Profit | 1.47B | 151M |
| EBITDA | 1.23B | 42.3M |
| EBIT | 1.05B | 17.8M |
| Interest Expense | 53.5M | 11.9M |
| Net Income | 847M | -2.0M |
| EPS | 7.22 | -0.36 |
| Fiscal Year | 2025 | 2025 |
Income Statement Analysis: The Bottom-Line Duel
This income statement comparison reveals which company runs the more efficient and profitable corporate engine over recent years.
Celestica Inc. Analysis
Celestica’s revenue surged from 5.63B in 2021 to 12.6B in 2025, with net income rising sharply from 104M to 847M. Gross and net margins improved steadily, reaching 11.7% and 6.7% respectively in 2025. The company demonstrates strong momentum and operational leverage, with an 80% EBIT growth in the latest year, signaling efficient cost control amid scaling revenue.
Mesa Laboratories, Inc. Analysis
Mesa Laboratories grew revenue from 134M in 2021 to 241M in 2025, maintaining a robust gross margin of 62.6%. However, net income remained negative in 2025 at -2M, reflecting ongoing challenges in translating gross profits into bottom-line gains. Despite a strong EBIT margin near 7.4% and recent positive EBIT growth, net margin struggles indicate inefficiencies or rising non-operating expenses.
Verdict: Revenue Scale vs. Margin Quality
Celestica’s commanding revenue scale and consistent net income growth clearly outpace Mesa Laboratories’ smaller size and persistent losses. Celestica offers a more attractive profile for investors seeking reliable profit expansion. Mesa’s high gross margins are offset by net losses, suggesting a riskier outlook despite operational improvements.
Financial Ratios Comparison
These vital ratios act as a diagnostic tool to expose the underlying fiscal health, valuation premiums, and capital efficiency of the companies compared below:
| Ratios | Celestica Inc. (CLS) | Mesa Laboratories, Inc. (MLAB) |
|---|---|---|
| ROE | 22.57% | -1.24% |
| ROIC | 16.10% | -1.45% |
| P/E | 25.47 | -326.35 |
| P/B | 5.75 | 4.03 |
| Current Ratio | 1.49 | 0.63 |
| Quick Ratio | 0.91 | 0.47 |
| D/E (Debt-to-Equity) | 0.42 | 1.14 |
| Debt-to-Assets | 13.30% | 41.88% |
| Interest Coverage | 11.50 | 1.38 |
| Asset Turnover | 1.61 | 0.56 |
| Fixed Asset Turnover | 14.58 | 7.45 |
| Payout ratio | 0 | -175.68% |
| Dividend yield | 0% | 0.54% |
| Fiscal Year | 2024 | 2025 |
Efficiency & Valuation Duel: The Vital Signs
Financial ratios serve as the company’s DNA, exposing hidden risks and operational strengths that influence investment decisions and future performance.
Celestica Inc.
Celestica shows strong profitability with a 22.57% ROE but a low 4.44% net margin, signaling inefficiencies. Its valuation appears stretched, with a high P/E of 25.47 and P/B of 5.75. The firm pays no dividends, instead likely reinvesting in growth and R&D, which demands monitoring for shareholder value creation.
Mesa Laboratories, Inc.
Mesa Laboratories struggles with negative ROE at -1.24% and a net margin of -0.82%, reflecting operational challenges. Its P/E is negative but flagged as favorable due to valuation distortions. The company has weak liquidity and high debt, with a modest 0.54% dividend yield, suggesting limited capacity for shareholder returns amid ongoing restructuring.
Premium Valuation vs. Operational Safety
Celestica offers a better balance of profitability and valuation despite some stretched metrics. Mesa’s unfavorable profitability and liquidity suggest higher risk. Investors seeking operational resilience may prefer Celestica, while risk-tolerant profiles might consider Mesa’s turnaround potential.
Which one offers the Superior Shareholder Reward?
Celestica Inc. (CLS) refrains from dividends but generates steady free cash flow averaging 2.5/share in 2024, funding modest buybacks that enhance value sustainably. Mesa Laboratories, Inc. (MLAB) pays a small dividend (~0.54% yield) but suffers net losses and high debt, relying on buybacks despite weak profitability. I see CLS’s conservative distribution and reinvestment strategy as more sustainable and attractive for long-term total return in 2026.
Comparative Score Analysis: The Strategic Profile
The radar chart reveals the fundamental DNA and trade-offs of Celestica Inc. and Mesa Laboratories, Inc., highlighting their financial strengths and vulnerabilities:
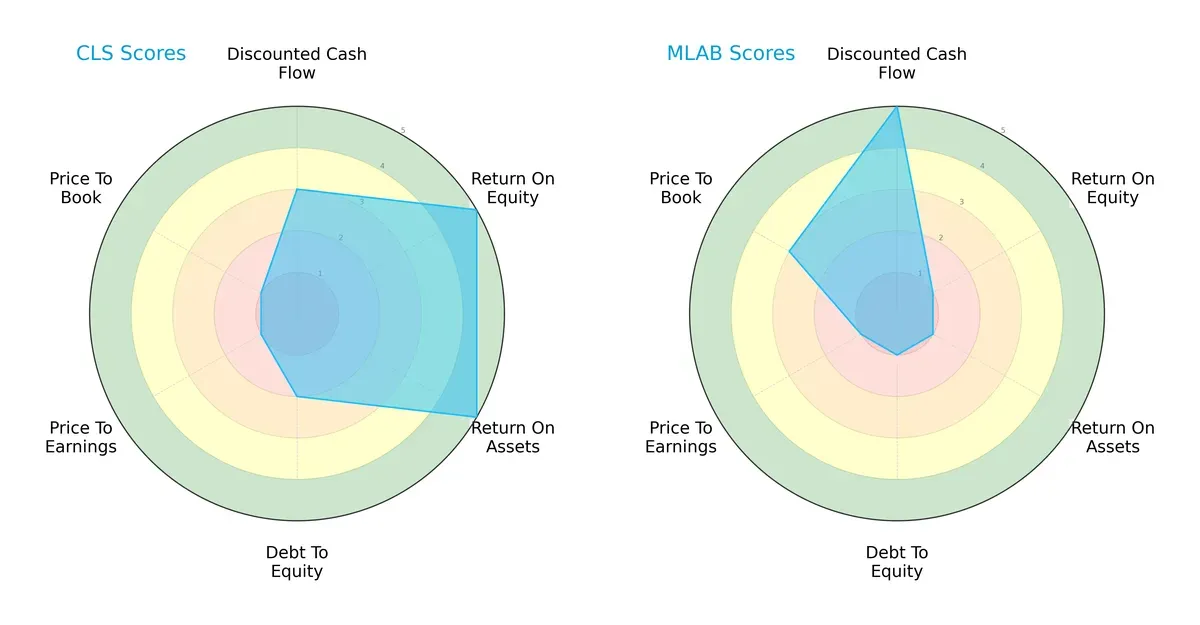
Celestica exhibits balanced strengths in profitability with high ROE and ROA scores (5 each), while Mesa Laboratories excels in discounted cash flow valuation (score of 5) but lags significantly in profitability and financial stability. Celestica’s moderate debt-to-equity score (2) contrasts with Mesa’s weak leverage position (1). Valuation metrics favor neither, both scoring low on P/E, but Mesa has a slight edge in price-to-book. Overall, Celestica presents a more balanced profile, whereas Mesa relies heavily on cash flow valuation optimism.
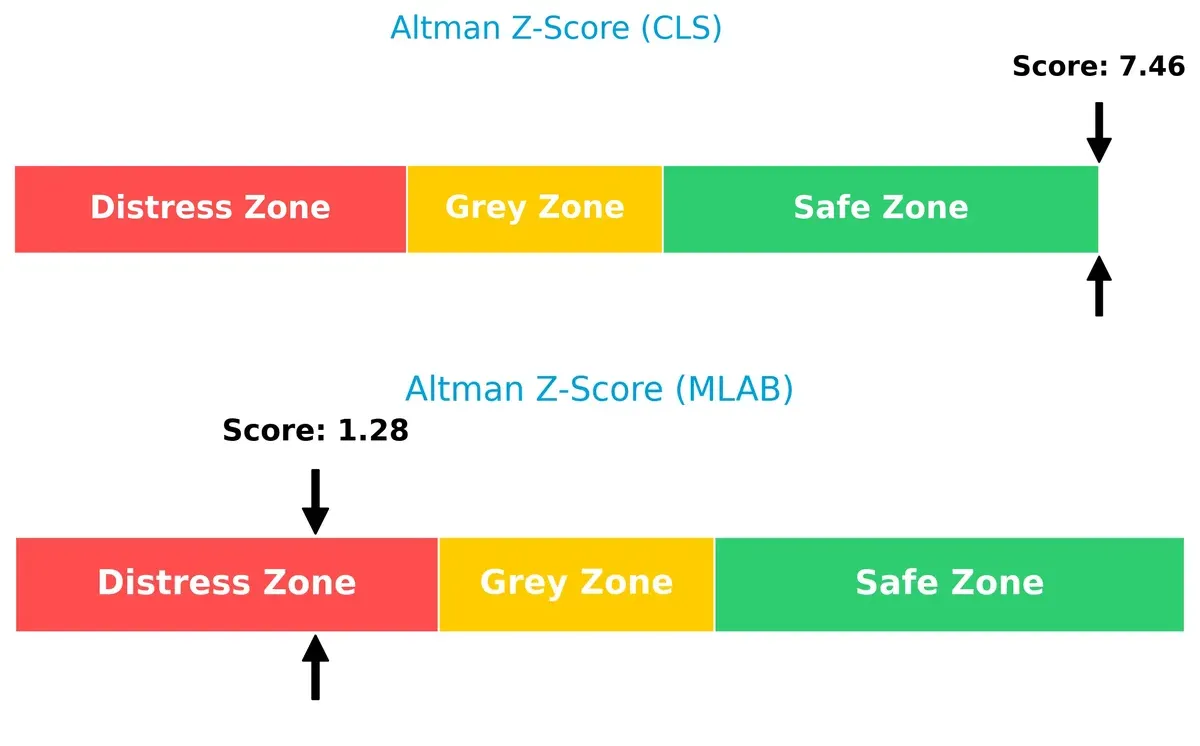
Bankruptcy Risk: Solvency Showdown
Celestica’s Altman Z-Score of 7.46 places it firmly in the safe zone, indicating strong solvency and low bankruptcy risk. Mesa Laboratories, with a score of 1.28, sits in the distress zone, signaling substantial long-term survival risk in this cycle:
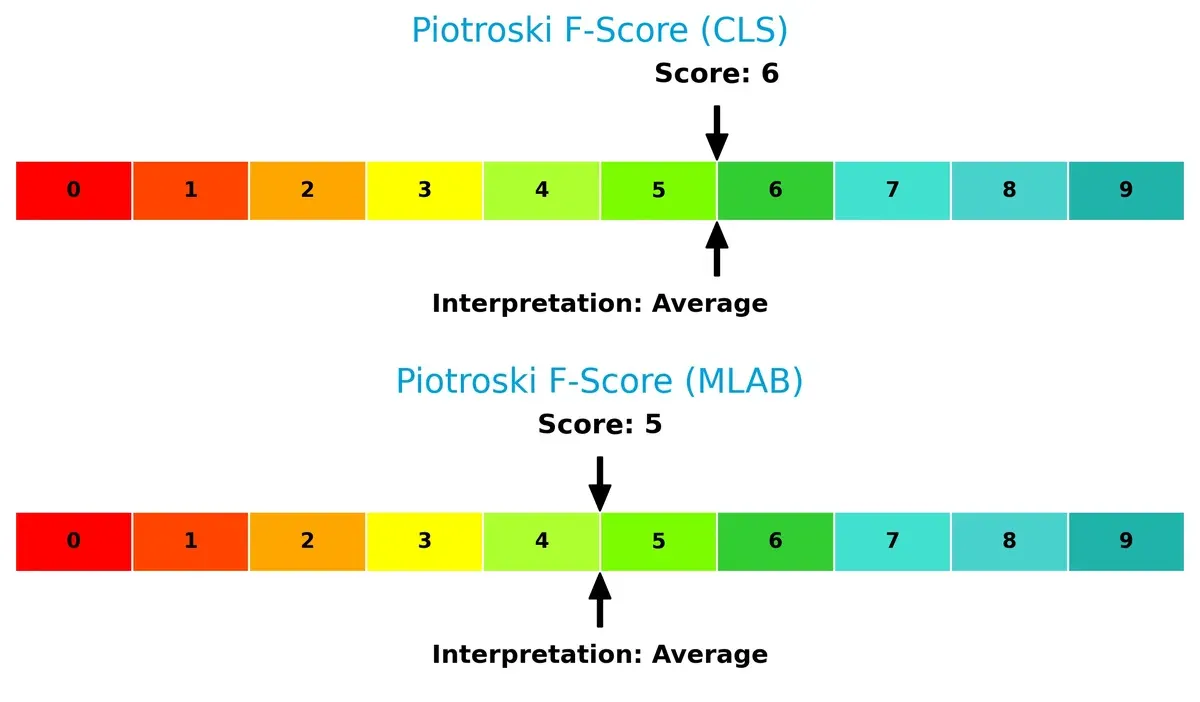
Financial Health: Quality of Operations
Celestica scores a 6 on the Piotroski F-Score, reflecting average but stable financial health. Mesa Laboratories scores slightly lower at 5, also average but closer to potential red flags in operational efficiency and profitability:
How are the two companies positioned?
This section dissects the operational DNA of Celestica and Mesa by comparing their revenue distribution by segment and internal dynamics. The goal is to confront their economic moats and reveal which model offers the most resilient competitive advantage today.
Revenue Segmentation: The Strategic Mix
The comparison below dissects how Celestica Inc. and Mesa Laboratories, Inc. diversify their income streams and reveals where each firm places its primary sector bets:
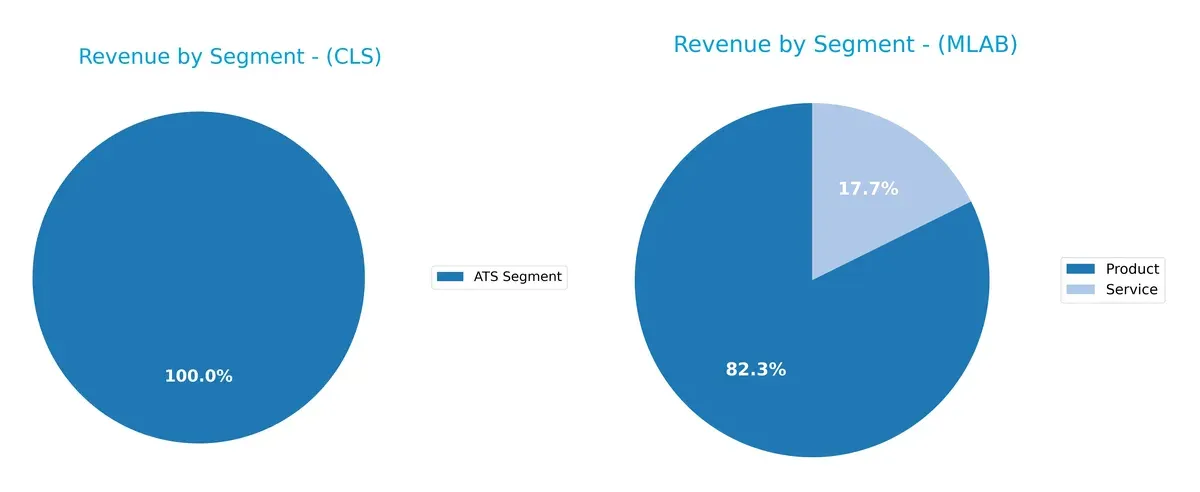
Celestica leans heavily on its ATS segment, generating $3.16B, which anchors its revenue and signals a focused industrial or technology services play. Mesa Laboratories displays a more diversified portfolio, with $198M from Product and $43M from Service, spreading risk across offerings. Celestica’s concentration suggests infrastructure dominance but also higher exposure to sector swings. Mesa’s spread cushions volatility but may dilute scale advantages.
Strengths and Weaknesses Comparison
This table compares the Strengths and Weaknesses of Celestica Inc. and Mesa Laboratories, Inc.:
Celestica Inc. Strengths
- Strong profitability with 22.57% ROE
- Favorable debt-to-equity and interest coverage ratios
- High asset and fixed asset turnover indicating operational efficiency
Mesa Laboratories, Inc. Strengths
- Favorable WACC at 6.56% supports capital efficiency
- Positive fixed asset turnover shows asset productivity
- Diverse revenue streams across products and services
Celestica Inc. Weaknesses
- Low net margin at 4.44% signals limited profitability
- High price-to-book ratio (5.75) may indicate overvaluation
- No dividend yield limits income appeal
- Lack of available ROIC and WACC data restricts full financial insight
Mesa Laboratories, Inc. Weaknesses
- Negative net margin, ROE, and ROIC indicate operational losses
- Weak liquidity ratios below 1 pose financial risk
- High debt-to-equity ratio (1.14) increases leverage concerns
- Low interest coverage at 1.5 times raises solvency risk
The comparison reveals Celestica’s financial stability and operational efficiency contrast Mesa’s struggles with profitability and liquidity. These factors critically influence each company’s strategic options and risk profile.
The Moat Duel: Analyzing Competitive Defensibility
A structural moat is the only true defense protecting long-term profits from relentless competitive erosion. Let’s dissect the moat dynamics of these two firms:
Celestica Inc.: Supply Chain Mastery with Scale and Integration
Celestica’s moat stems from its cost advantage and integrated supply chain solutions, reflected in strong revenue growth and expanding net margins. Its diverse end markets and new tech deployments in 2026 could deepen this advantage.
Mesa Laboratories, Inc.: Specialized Life Sciences Tools with Intangible Assets
Mesa leans on niche intellectual property and product specialization, contrasting Celestica’s scale. Yet, its declining ROIC and value destruction warn of weakening moat durability despite pockets of revenue growth and clinical genomics expansion.
Moat Stability: Scale-Driven Cost Advantage vs. Niche Intellectual Property
Celestica’s growing ROIC and robust margin expansion signal a wider, more durable moat than Mesa’s shrinking returns and value erosion. I see Celestica better positioned to defend and grow its market share amid evolving industry pressures.
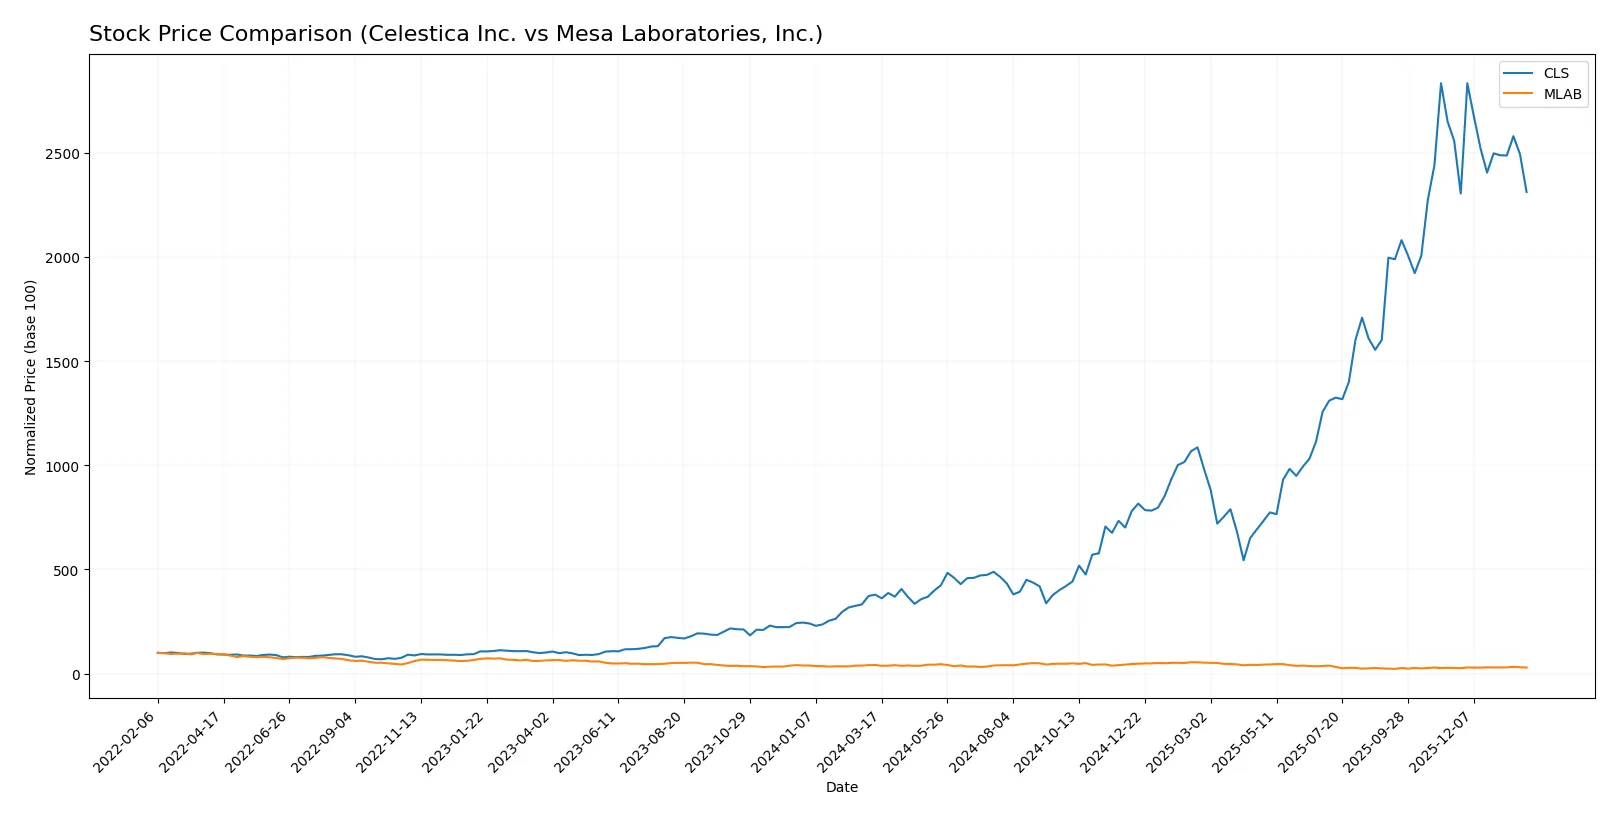
Which stock offers better returns?
The past year saw Celestica Inc. rally sharply before recent weakness, while Mesa Laboratories, Inc. endured an extended decline with signs of modest recovery in the last quarter. Trading volume trends diverged notably.
Trend Comparison
Celestica Inc. posted a strong 509.52% gain over 12 months, marking a bullish trend with decelerating momentum. Its price peaked at 344.48 and bottomed at 40.73, reflecting high volatility (92.63 std deviation).
Mesa Laboratories, Inc. declined 29.68% over the same period, confirming a bearish trend despite accelerating losses. The stock ranged between 61.66 and 147.79, showing moderate volatility (23.47 std deviation).
Celestica’s return vastly outperformed Mesa’s in the last year, despite a negative short-term trend, delivering the highest market gains between the two.
Target Prices
Analysts project a moderate upside for Celestica Inc. and a stable outlook for Mesa Laboratories, Inc.
| Company | Target Low | Target High | Consensus |
|---|---|---|---|
| Celestica Inc. | 300 | 440 | 365.6 |
| Mesa Laboratories, Inc. | 83 | 83 | 83 |
Celestica’s consensus target price of 365.6 suggests a roughly 30% gain from the current 281 price. Mesa Laboratories’ target matches its current price, indicating limited near-term price appreciation expected.

Don’t Let Luck Decide Your Entry Point
Optimize your entry points with our advanced ProRealTime indicators. You’ll get efficient buy signals with precise price targets for maximum performance. Start outperforming now!
How do institutions grade them?
Celestica Inc. Grades
The following table summarizes recent grades from major financial institutions for Celestica Inc.:
| Grading Company | Action | New Grade | Date |
|---|---|---|---|
| Citigroup | Maintain | Buy | 2026-01-30 |
| Barclays | Maintain | Overweight | 2026-01-30 |
| Goldman Sachs | Maintain | Buy | 2025-12-01 |
| Barclays | Maintain | Overweight | 2025-11-14 |
| Citigroup | Upgrade | Buy | 2025-11-10 |
| Goldman Sachs | Maintain | Buy | 2025-10-29 |
| CIBC | Maintain | Outperform | 2025-10-29 |
| Stifel | Maintain | Buy | 2025-10-29 |
| Barclays | Maintain | Overweight | 2025-10-29 |
| JP Morgan | Maintain | Overweight | 2025-10-29 |
Mesa Laboratories, Inc. Grades
Below is a summary of recent institutional grades for Mesa Laboratories, Inc.:
| Grading Company | Action | New Grade | Date |
|---|---|---|---|
| Wells Fargo | Maintain | Equal Weight | 2025-12-15 |
| Wells Fargo | Upgrade | Equal Weight | 2025-08-08 |
| Wells Fargo | Maintain | Underweight | 2025-05-30 |
| Evercore ISI Group | Maintain | Outperform | 2024-10-01 |
| Evercore ISI Group | Maintain | Outperform | 2024-08-06 |
| Evercore ISI Group | Maintain | Outperform | 2024-07-02 |
| Evercore ISI Group | Maintain | Outperform | 2024-04-04 |
| Evercore ISI Group | Upgrade | Outperform | 2024-01-04 |
| Evercore ISI Group | Downgrade | In Line | 2021-01-04 |
| Evercore ISI Group | Downgrade | In Line | 2021-01-03 |
Which company has the best grades?
Celestica consistently receives Buy and Overweight ratings from top-tier banks, indicating stronger institutional confidence. Mesa Laboratories shows mixed ratings, with moderate upgrades and some downgrades, suggesting more cautious sentiment. This contrast may influence investors seeking stability versus those accepting higher risk.
Risks specific to each company
The following categories identify the critical pressure points and systemic threats facing both firms in the 2026 market environment:
1. Market & Competition
Celestica Inc.
- Operates in a highly competitive hardware and supply chain sector with global scale and diverse clients.
Mesa Laboratories, Inc.
- Faces niche competition in life sciences tools and quality control with limited scale and specialized segments.
2. Capital Structure & Debt
Celestica Inc.
- Maintains a conservative debt-to-equity ratio (0.42) and strong interest coverage (19.7), indicating low financial risk.
Mesa Laboratories, Inc.
- Carries high leverage (debt-to-equity 1.14) with weak interest coverage (1.5), signaling elevated financial risk.
3. Stock Volatility
Celestica Inc.
- Beta of 1.46 suggests above-market volatility, reflecting sensitivity to tech sector swings.
Mesa Laboratories, Inc.
- Lower beta of 0.89 indicates less volatility, offering some defensive characteristics.
4. Regulatory & Legal
Celestica Inc.
- Subject to global trade regulations and supply chain compliance risks across multiple regions.
Mesa Laboratories, Inc.
- Faces strict regulatory scrutiny in healthcare and life sciences, increasing compliance complexity.
5. Supply Chain & Operations
Celestica Inc.
- Complex global supply chain exposes firm to geopolitical disruptions and component shortages.
Mesa Laboratories, Inc.
- Smaller scale limits supply chain risk but depends heavily on specialized suppliers.
6. ESG & Climate Transition
Celestica Inc.
- Industry pressure to adopt sustainable manufacturing; transition risks in energy-intensive operations.
Mesa Laboratories, Inc.
- ESG focus on life sciences offers opportunities but with regulatory scrutiny on chemical and biological products.
7. Geopolitical Exposure
Celestica Inc.
- Operations span North America, Europe, Asia; exposed to trade tensions and regional instability.
Mesa Laboratories, Inc.
- Primarily US-based with international sales, less direct geopolitical risk but affected by export controls.
Which company shows a better risk-adjusted profile?
Celestica’s dominant risk lies in market competition and supply chain complexity but benefits from strong capital structure and financial stability. Mesa Laboratories faces severe financial risk from high leverage and weak profitability, compounded by regulatory and operational challenges. Celestica exhibits a markedly better risk-adjusted profile. Its Altman Z-score of 7.46 places it safely above distress thresholds, while Mesa’s 1.28 signals potential bankruptcy risk. This stark contrast highlights Celestica’s resilience amid intense sector volatility versus Mesa’s fragile financial footing in 2026.
Final Verdict: Which stock to choose?
Celestica Inc. (CLS) stands out for its robust capital efficiency and steadily improving return on invested capital. Its superpower lies in converting invested capital into growing profits, signaling disciplined management and operational strength. A point of vigilance remains its relatively high price multiples. CLS suits an aggressive growth portfolio aiming to capitalize on operational momentum.
Mesa Laboratories, Inc. (MLAB) offers a strategic moat rooted in specialized product niches and recurring revenue streams. While it lacks CLS’s balance sheet strength and profitability, MLAB presents a more cautious safety profile for investors prioritizing niche market exposure. It fits a GARP (Growth at a Reasonable Price) portfolio seeking selective growth with moderate risk.
If you prioritize disciplined capital allocation and consistent profitability, Celestica appears the compelling choice due to its clear value creation and operational traction. However, if you seek exposure to niche markets with steady revenue potential, Mesa Laboratories offers better stability despite its value destruction concerns. Both scenarios demand careful risk assessment given their divergent financial health profiles.
Disclaimer: Investment carries a risk of loss of initial capital. The past performance is not a reliable indicator of future results. Be sure to understand risks before making an investment decision.
Go Further
I encourage you to read the complete analyses of Celestica Inc. and Mesa Laboratories, Inc. to enhance your investment decisions: