Home > Comparison > Technology > KEYS vs CLS
The strategic rivalry between Keysight Technologies, Inc. and Celestica Inc. shapes the evolution of the technology hardware sector. Keysight operates as a specialized electronic test and measurement solutions provider, while Celestica offers broad hardware platform and supply chain services. This head-to-head contrasts precision engineering against scalable manufacturing. I will analyze which company’s trajectory delivers superior risk-adjusted returns for portfolios seeking exposure to technology hardware and equipment.
Table of contents
Companies Overview
Keysight Technologies and Celestica stand as pivotal players in the hardware and equipment sector, shaping technology infrastructure globally.
Keysight Technologies, Inc.: Precision Electronic Test Solutions Leader
Keysight dominates as a provider of electronic design and test solutions across communications, aerospace, defense, and semiconductor industries. Its revenue stems from advanced electronic design automation software and a broad portfolio of hardware test platforms. In 2026, the company focuses strategically on expanding virtual network test platforms and software applications, reinforcing its competitive edge in high-tech testing environments.
Celestica Inc.: Comprehensive Hardware Platform and Supply Chain Innovator
Celestica operates as a hardware platform and supply chain solutions provider, servicing aerospace, energy, and cloud industries. Its core revenue comes from electronics manufacturing, engineering, and supply chain management services. For 2026, Celestica concentrates on enhancing advanced technology solutions and connectivity services, targeting growth in cloud infrastructure and precision manufacturing capabilities.
Strategic Collision: Similarities & Divergences
Both companies emphasize hardware and technology services but diverge sharply in approach. Keysight focuses on high-precision test solutions and virtual platforms, while Celestica prioritizes extensive manufacturing and supply chain integration. Their primary battleground is the evolving technology infrastructure market, where precision testing meets scalable production. This contrast defines their distinct investment profiles—Keysight as a niche technology enabler, Celestica as a broad-based hardware integrator.
Income Statement Comparison
This data dissects the core profitability and scalability of both corporate engines to reveal who dominates the bottom line:
| Metric | Keysight Technologies, Inc. (KEYS) | Celestica Inc. (CLS) |
|---|---|---|
| Revenue | 5.38B | 12.61B |
| Cost of Revenue | 2.04B | 11.13B |
| Operating Expenses | 2.39B | 385M |
| Gross Profit | 3.34B | 1.47B |
| EBITDA | 1.43B | 1.23B |
| EBIT | 1.15B | 1.05B |
| Interest Expense | 96M | 54M |
| Net Income | 846M | 847M |
| EPS | 4.9 | 7.22 |
| Fiscal Year | 2025 | 2025 |
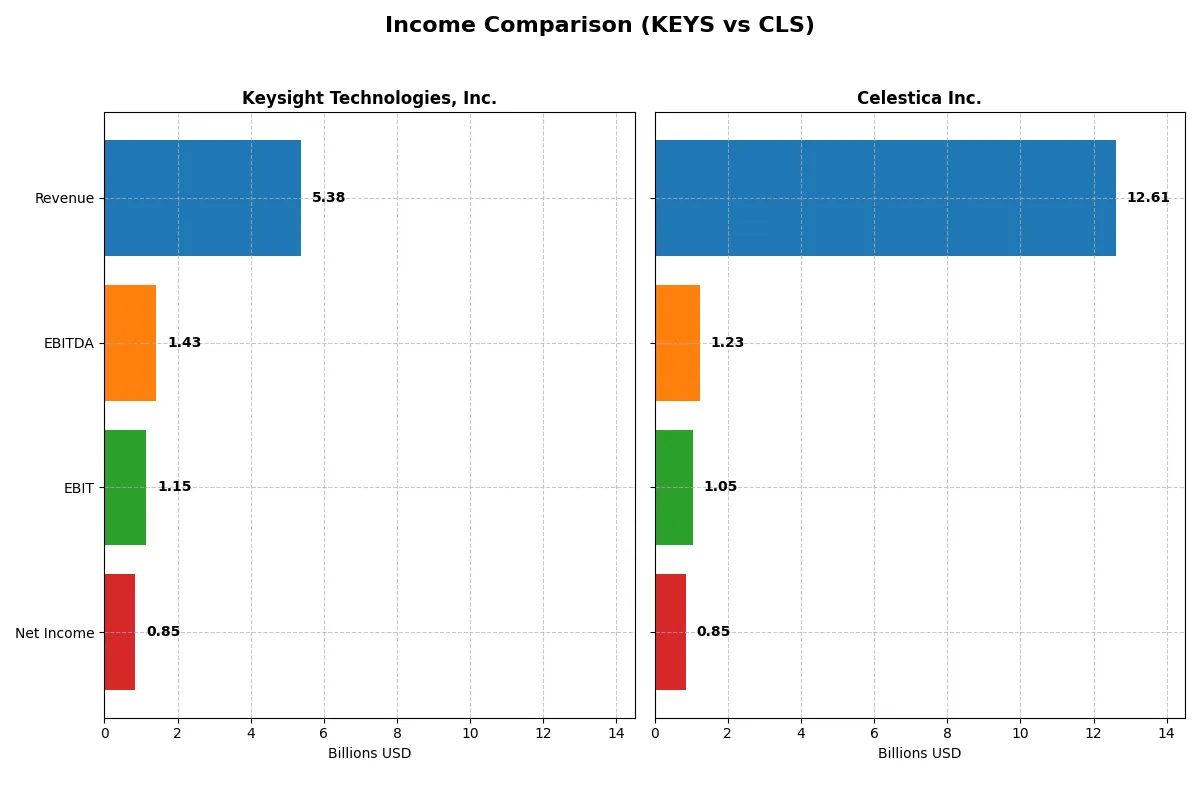
Income Statement Analysis: The Bottom-Line Duel
The following income statement comparison reveals the true efficiency and profitability of each company’s core business engine over recent years.
Keysight Technologies, Inc. Analysis
Keysight’s revenue shows moderate growth, reaching $5.38B in 2025, with net income at $846M. The company maintains strong gross (62.1%) and net margins (15.7%), signaling solid operational efficiency. In 2025, it accelerated EBIT growth by over 21%, reflecting improved cost control and profit momentum despite a slight net income decline over the broader period.
Celestica Inc. Analysis
Celestica’s revenue surged to $12.6B in 2025, more than doubling since 2021. Its net income climbed sharply to $847M, supported by a modest 11.7% gross margin and 6.7% net margin. The firm posted impressive one-year growth rates across revenue (30.7%), EBIT (80.4%), and EPS (98.3%), highlighting strong operational leverage amid rapid expansion.
Margin Strength vs. High Growth Scale
Keysight delivers superior margin quality and consistent profitability, while Celestica impresses with robust revenue and earnings growth but at thinner margins. Fundamentally, Keysight’s disciplined cost structure wins on efficiency. Investors seeking steady margin power may prefer Keysight’s profile; those prioritizing high momentum might lean toward Celestica’s growth trajectory.
Financial Ratios Comparison
These vital ratios act as a diagnostic tool to expose the underlying fiscal health, valuation premiums, and capital efficiency of each company:
| Ratios | Keysight Technologies, Inc. (KEYS) | Celestica Inc. (CLS) |
|---|---|---|
| ROE | 14.40% | 22.57% |
| ROIC | 8.02% | 16.10% |
| P/E | 37.41 | 25.47 |
| P/B | 5.39 | 5.75 |
| Current Ratio | 2.35 | 1.49 |
| Quick Ratio | 1.78 | 0.91 |
| D/E | 0.51 | 0.42 |
| Debt-to-Assets | 26.31% | 13.30% |
| Interest Coverage | 9.88 | 11.50 |
| Asset Turnover | 0.48 | 1.61 |
| Fixed Asset Turnover | 5.21 | 14.58 |
| Payout ratio | 0 | 0 |
| Dividend yield | 0 | 0 |
| Fiscal Year | 2025 | 2024 |
Efficiency & Valuation Duel: The Vital Signs
Financial ratios serve as a company’s DNA, exposing hidden risks and revealing operational strengths crucial for investment decisions.
Keysight Technologies, Inc.
Keysight posts a solid 14.4% ROE and a favorable 15.7% net margin, indicating decent profitability. However, its valuation appears stretched with a high 37.4 P/E and a 5.4 P/B ratio. The company offers no dividend, instead channeling funds into substantial R&D, supporting growth and innovation.
Celestica Inc.
Celestica delivers a strong 22.6% ROE but struggles with a low 4.4% net margin, reflecting cost pressures. Its valuation is more reasonable at a 25.5 P/E, though the 5.8 P/B ratio remains elevated. Like Keysight, it pays no dividend, focusing instead on operational efficiency and asset turnover to enhance returns.
Premium Valuation vs. Operational Safety
Keysight’s higher profitability and R&D investment come at a premium valuation, while Celestica balances risk with superior ROE but weaker margins. Keysight suits growth investors, whereas Celestica appeals to those favoring operational efficiency and value.
Which one offers the Superior Shareholder Reward?
I observe that Keysight Technologies (KEYS) pays no dividends but generates strong free cash flow of 7.4/share in 2025. Its buyback program, supported by a robust 0.91 FCF-to-OCF ratio, signals aggressive capital return. Celestica (CLS) also pays no dividends and reveals weaker free cash flow at 2.6/share in 2024, with a modest buyback capacity indicated by a 0.64 FCF-to-OCF ratio. KEYS’ higher margins (EBIT ~21%) and stronger cash coverage ratios outpace CLS (EBIT ~6%). I conclude Keysight’s distribution through buybacks is more sustainable and offers superior total shareholder return potential in 2026.
Comparative Score Analysis: The Strategic Profile
The radar chart reveals the fundamental DNA and trade-offs of Keysight Technologies, Inc. and Celestica Inc., highlighting their core financial strengths and valuation nuances:
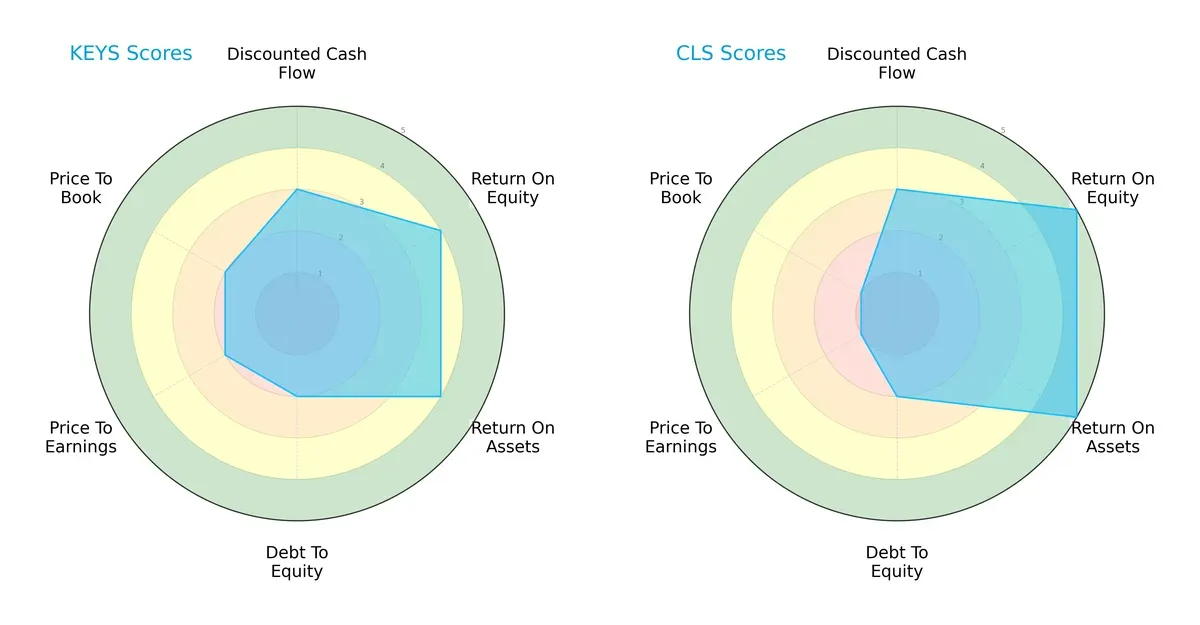
Keysight and Celestica share similar overall and DCF scores, signaling moderate valuation appeal. Celestica excels in profitability metrics with top-tier ROE and ROA scores (5 each), outperforming Keysight’s favorable 4s. Both carry moderate debt risk (score 2). Keysight holds a valuation edge with moderate P/E and P/B scores (2), while Celestica’s low valuation scores (1) suggest potential undervaluation but also risk. Keysight’s profile is more balanced; Celestica leans heavily on operational efficiency.
—
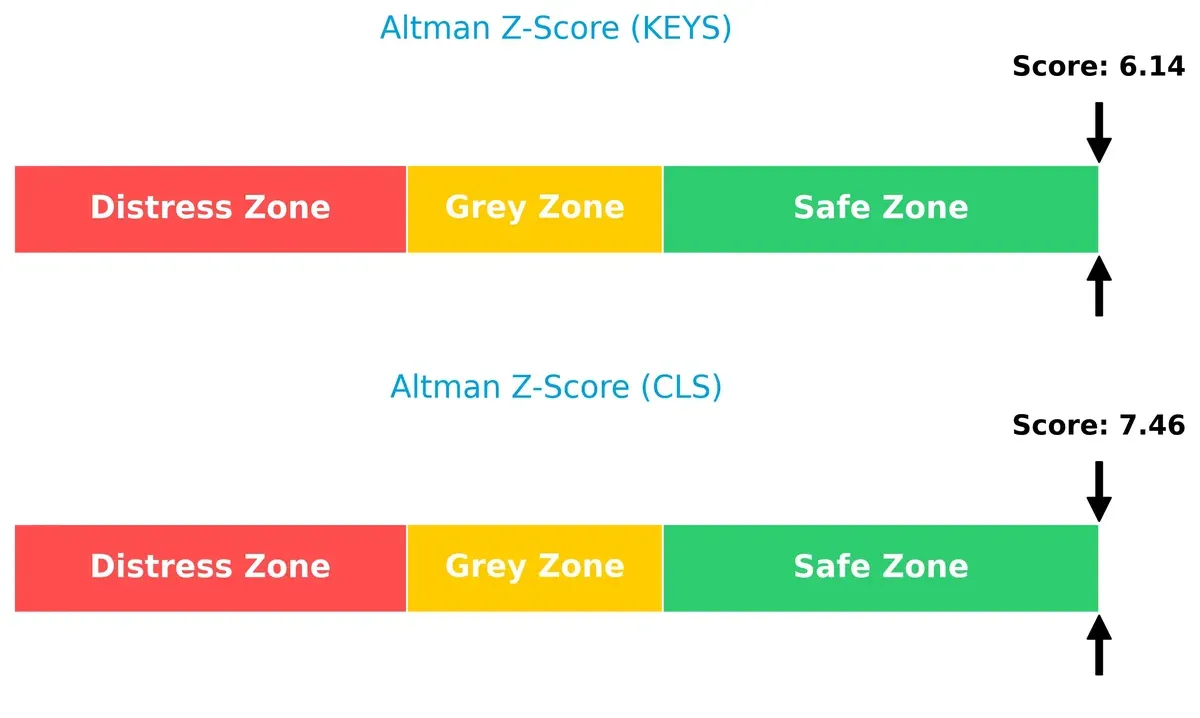
Bankruptcy Risk: Solvency Showdown
Celestica’s Altman Z-Score (7.46) surpasses Keysight’s (6.14), both firmly in the safe zone, indicating strong solvency and low bankruptcy risk amid current economic conditions:
—
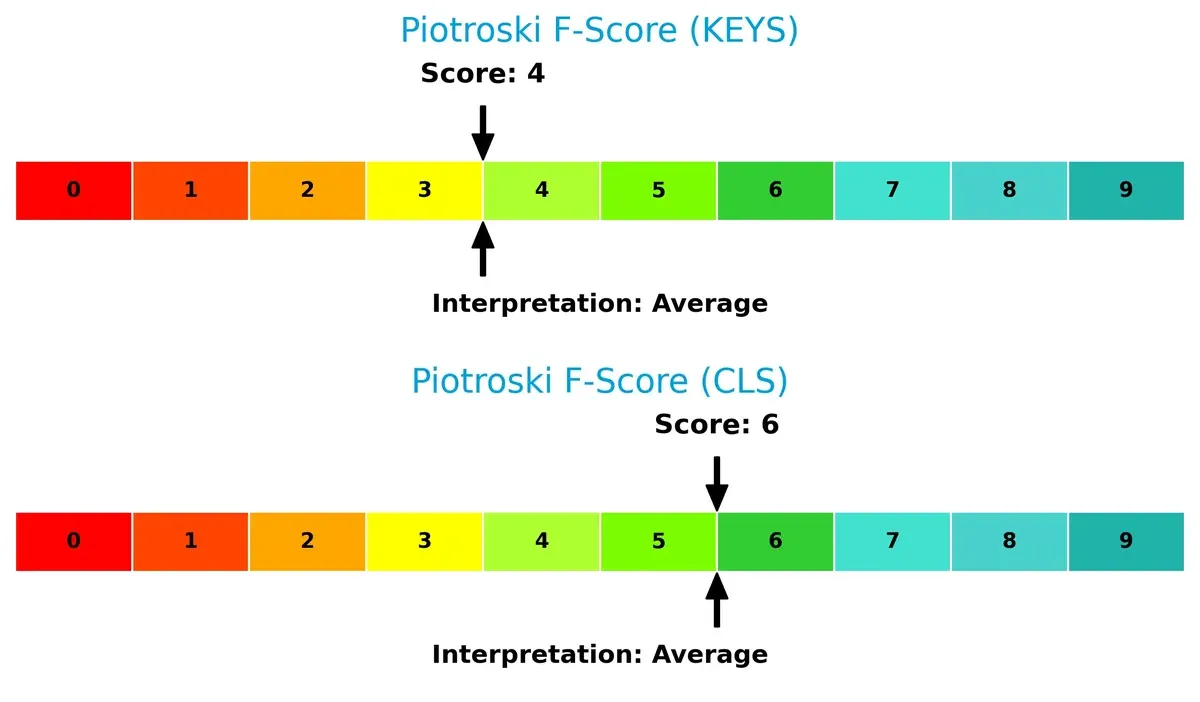
Financial Health: Quality of Operations
Celestica’s Piotroski F-Score of 6 outperforms Keysight’s 4, suggesting Celestica maintains healthier internal operations and financial quality, though neither hits peak strength:
How are the two companies positioned?
This section dissects the operational DNA of KEYS and CLS by comparing their revenue distribution and internal dynamics. The goal is to confront their economic moats to reveal which model offers the most resilient, sustainable advantage today.
Revenue Segmentation: The Strategic Mix
The following visual comparison dissects how Keysight Technologies and Celestica diversify their income streams and reveals where their primary sector bets lie:
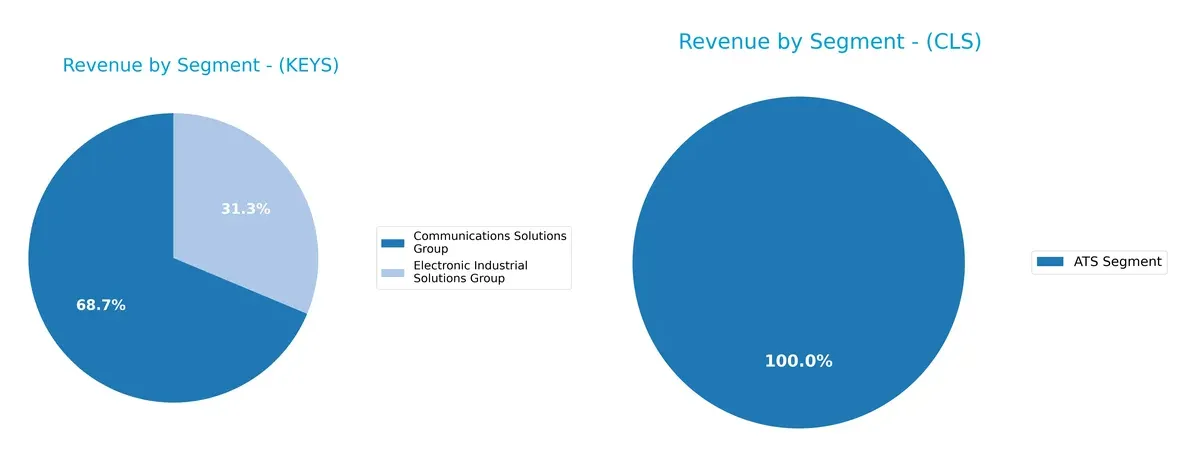
Keysight Technologies pivots between two robust segments: Communications Solutions Group at $3.42B and Electronic Industrial Solutions Group at $1.56B, showing a balanced yet communications-anchored revenue base. Celestica relies heavily on a single ATS Segment, generating $3.16B, reflecting concentration risk but also infrastructure dominance in its niche. Keysight’s diversification offers resilience; Celestica’s focus demands close monitoring amid market shifts.
Strengths and Weaknesses Comparison
This table compares the Strengths and Weaknesses of Keysight Technologies, Inc. (KEYS) and Celestica Inc. (CLS):
KEYS Strengths
- Strong diversification with Communications and Electronic Industrial Solutions segments
- Favorable net margin at 15.74%
- Solid liquidity with current ratio 2.35 and quick ratio 1.78
- Balanced debt profile with debt to assets at 26.31%
- Global presence across Americas, Asia Pacific, Europe
- Favorable interest coverage at 11.98
CLS Strengths
- High return on equity at 22.57%
- Favorable debt to equity at 0.42 and debt to assets at 13.3%
- Strong asset turnover at 1.61 and fixed asset turnover at 14.58
- Favorable interest coverage at 19.69
- ATS segment concentration offers focused market presence
- Slightly favorable overall ratio profile
KEYS Weaknesses
- Unfavorable PE of 37.41 and PB of 5.39 indicate valuation concerns
- Neutral ROE at 14.4% barely above WACC at 8.89% suggests limited capital efficiency
- Unfavorable asset turnover at 0.48 signals asset utilization issues
- No dividend yield limits income appeal
- Neutral debt to equity at 0.51
- Slightly unfavorable overall ratio composition
CLS Weaknesses
- Low net margin at 4.44% limits profitability
- Unfavorable PE at 25.47 and PB at 5.75 reflect valuation pressures
- Neutral liquidity ratios with current ratio 1.49 and quick ratio 0.91
- Unavailable ROIC and WACC data hinder comprehensive capital efficiency assessment
- Zero dividend yield reduces income potential
Both companies present slightly favorable financial profiles but differ in key areas. KEYS shows stronger diversification and global reach but faces valuation and asset utilization challenges. CLS delivers high ROE and asset efficiency but struggles with profitability and incomplete capital cost data. These contrasts highlight distinct strategic priorities for each firm.
The Moat Duel: Analyzing Competitive Defensibility
A structural moat shields long-term profits from relentless competitive pressures. It defines who wins or loses in market share battles:
Keysight Technologies, Inc.: Intangible Asset Moat Anchored in Innovation
Keysight leverages proprietary electronic test solutions driving high gross margins (62%) and stable net margins (15.7%). However, its declining ROIC signals looming challenges to sustaining this advantage in 2026.
Celestica Inc.: Operational Excellence and Scaling Cost Advantage
Celestica contrasts with Keysight by harnessing supply chain mastery and manufacturing scale. Its rapid revenue growth (124% over five years) and improving ROIC trend highlight a deepening moat poised for expansion in cloud and industrial sectors.
Verdict: Proprietary Innovation vs. Scalable Supply Chain Mastery
While Keysight’s intangible assets have historically commanded premium returns, its deteriorating ROIC warns of margin erosion. Celestica’s operational moat, fueled by accelerating growth and improving capital efficiency, appears wider and more durable. I see Celestica better positioned to defend and grow market share into 2026.
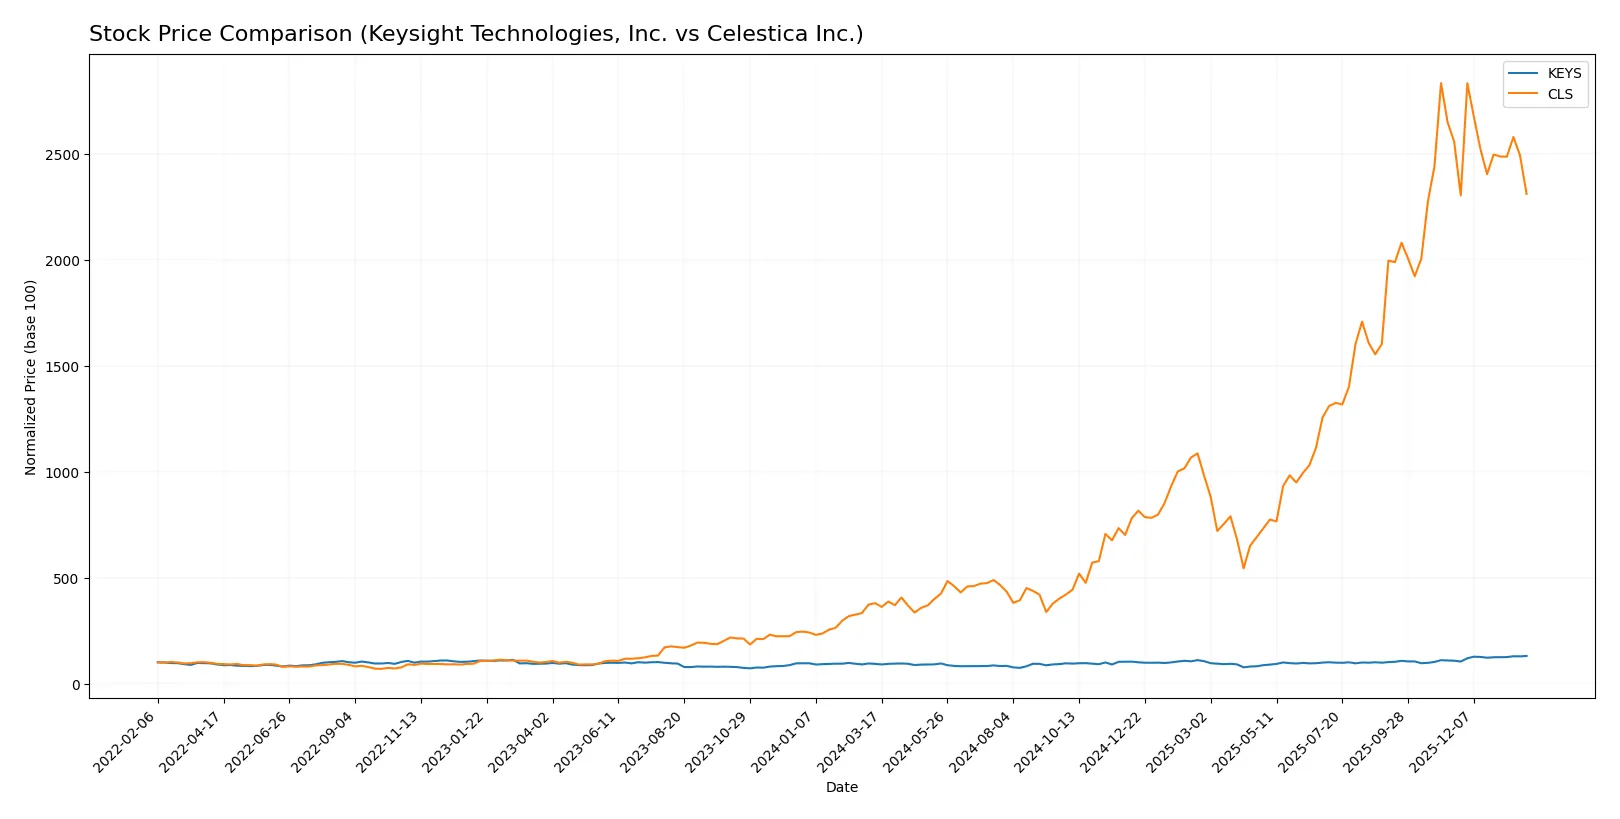
Which stock offers better returns?
Over the past year, Keysight Technologies and Celestica have shown contrasting price dynamics, with Keysight steadily gaining and Celestica exhibiting extreme swings and recent weakness.
Trend Comparison
Keysight Technologies’ stock rose 40.17% over the past year, showing a bullish trend with accelerating momentum and a high of 216.33. Volatility is moderate with a 20.07 standard deviation.
Celestica’s stock surged 509.52% over the year, marking a strong bullish trend but with deceleration recently and a sharp 9.61% decline in the last two and a half months. Volatility remains high at 92.63.
Celestica outperformed Keysight over the full year but has weakened recently, while Keysight shows steadier gains and accelerating momentum.
Target Prices
Analysts present a cautiously optimistic consensus for Keysight Technologies, Inc. and Celestica Inc.
| Company | Target Low | Target High | Consensus |
|---|---|---|---|
| Keysight Technologies, Inc. | 210 | 243 | 226.5 |
| Celestica Inc. | 300 | 440 | 365.6 |
The target consensus for Keysight slightly exceeds its current 216.33 price, suggesting moderate upside. Celestica’s 365.6 consensus target significantly surpasses the 280.99 market price, indicating stronger growth expectations.

Don’t Let Luck Decide Your Entry Point
Optimize your entry points with our advanced ProRealTime indicators. You’ll get efficient buy signals with precise price targets for maximum performance. Start outperforming now!
How do institutions grade them?
Keysight Technologies, Inc. Grades
The following table summarizes recent institutional grades for Keysight Technologies, Inc.:
| Grading Company | Action | New Grade | Date |
|---|---|---|---|
| Morgan Stanley | Maintain | Equal Weight | 2025-12-17 |
| Jefferies | Maintain | Hold | 2025-12-10 |
| Baird | Maintain | Outperform | 2025-11-26 |
| Barclays | Maintain | Overweight | 2025-11-25 |
| Morgan Stanley | Maintain | Equal Weight | 2025-11-25 |
| Wells Fargo | Maintain | Overweight | 2025-11-25 |
| JP Morgan | Maintain | Overweight | 2025-11-25 |
| Susquehanna | Maintain | Positive | 2025-11-25 |
| Citigroup | Maintain | Buy | 2025-11-25 |
| UBS | Maintain | Buy | 2025-11-25 |
Celestica Inc. Grades
The following table summarizes recent institutional grades for Celestica Inc.:
| Grading Company | Action | New Grade | Date |
|---|---|---|---|
| Citigroup | Maintain | Buy | 2026-01-30 |
| Barclays | Maintain | Overweight | 2026-01-30 |
| Goldman Sachs | Maintain | Buy | 2025-12-01 |
| Barclays | Maintain | Overweight | 2025-11-14 |
| Citigroup | Upgrade | Buy | 2025-11-10 |
| Goldman Sachs | Maintain | Buy | 2025-10-29 |
| CIBC | Maintain | Outperform | 2025-10-29 |
| Stifel | Maintain | Buy | 2025-10-29 |
| Barclays | Maintain | Overweight | 2025-10-29 |
| JP Morgan | Maintain | Overweight | 2025-10-29 |
Which company has the best grades?
Celestica Inc. holds a stronger consensus, with multiple recent Buy and Overweight ratings, including upgrades. Keysight shows more mixed opinions, with several Equal Weight and Hold ratings. Investors might interpret Celestica’s grades as reflecting greater near-term confidence.
Risks specific to each company
The following categories identify the critical pressure points and systemic threats facing both firms in the 2026 market environment:
1. Market & Competition
Keysight Technologies, Inc.
- Operates in a highly specialized test and measurement niche with strong innovation moat but faces intense competition in semiconductor and network testing sectors.
Celestica Inc.
- Faces broad competition in hardware manufacturing and supply chain services, with pressure from lower-cost providers and rapid technology shifts.
2. Capital Structure & Debt
Keysight Technologies, Inc.
- Moderate leverage with debt-to-assets at 26.3%, backed by strong interest coverage (12x), indicating prudent financial management.
Celestica Inc.
- Lower leverage at 13.3% debt-to-assets and very strong interest coverage (19.7x), signaling solid balance sheet strength.
3. Stock Volatility
Keysight Technologies, Inc.
- Beta of 1.18 suggests moderately higher volatility relative to the market but within typical sector range.
Celestica Inc.
- Higher beta of 1.46 indicates greater stock price swings, increasing risk for risk-averse investors.
4. Regulatory & Legal
Keysight Technologies, Inc.
- Exposed to export controls and defense contracting regulations, which can constrain market access and increase compliance costs.
Celestica Inc.
- Faces complex regulatory environments across multiple jurisdictions due to global manufacturing footprint, increasing compliance complexity and risk.
5. Supply Chain & Operations
Keysight Technologies, Inc.
- Relies on advanced components and global supply chains, vulnerable to semiconductor shortages and geopolitical tensions.
Celestica Inc.
- High exposure to supply chain disruptions given contract manufacturing nature, with operational risks from component sourcing and logistics volatility.
6. ESG & Climate Transition
Keysight Technologies, Inc.
- Faces pressure to enhance energy efficiency in manufacturing and reduce carbon footprint to meet client and regulatory demands.
Celestica Inc.
- Increasing demand for ESG compliance among clients, with risks linked to environmental regulations and sustainable supply chain mandates.
7. Geopolitical Exposure
Keysight Technologies, Inc.
- Significant US-centric operations with exposure to US-China tech tensions impacting sales and supply chains.
Celestica Inc.
- Broad international presence including Asia and Europe, exposing it to geopolitical risks and currency fluctuations.
Which company shows a better risk-adjusted profile?
Keysight’s principal risk centers on supply chain fragility amid semiconductor shortages and geopolitical tensions. Celestica’s greatest vulnerability lies in its stock volatility and complex regulatory landscape across multiple regions. Despite these risks, Celestica’s stronger balance sheet and higher asset turnover underpin a more resilient operational profile. Keysight offers stability with moderate leverage and favorable liquidity, but its niche market and slower asset turnover temper its risk-adjusted appeal. The recent surge in Celestica’s beta to 1.46 and its significant stock price decline (-6.3%) highlight elevated market sensitivity, reinforcing my caution. Overall, Celestica shows a slightly better risk-adjusted profile given operational efficiency, but investors must weigh volatility risks carefully.
Final Verdict: Which stock to choose?
Keysight Technologies, Inc. (KEYS) excels as a cash-generating powerhouse with robust operating margins and solid liquidity. Its superpower lies in operational efficiency and innovation-driven growth. However, its declining ROIC relative to WACC signals a point of vigilance on value creation. KEYS suits investors targeting aggressive growth with tolerance for valuation premiums.
Celestica Inc. (CLS) benefits from a strategic moat in operational asset turnover and rapid revenue expansion. Its improving ROIC trend suggests growing efficiency and value creation, offering a safer profile than KEYS in terms of capital deployment. CLS fits well in Growth at a Reasonable Price (GARP) portfolios focused on scaling profitability sustainably.
If you prioritize aggressive expansion and operational excellence, KEYS is the compelling choice due to its strong income statement and innovation focus despite valuation concerns. However, if you seek improving capital efficiency and better stability amid rapid growth, CLS offers superior operational leverage and a more favorable ROIC trajectory. Both present analytical scenarios worth considering based on your risk appetite and growth strategy.
Disclaimer: Investment carries a risk of loss of initial capital. The past performance is not a reliable indicator of future results. Be sure to understand risks before making an investment decision.
Go Further
I encourage you to read the complete analyses of Keysight Technologies, Inc. and Celestica Inc. to enhance your investment decisions: