Home > Comparison > Technology > CLS vs JBL
The strategic rivalry between Celestica Inc. and Jabil Inc. shapes the Technology sector’s manufacturing landscape. Celestica specializes in advanced hardware platforms and supply chain solutions, combining precision engineering with cloud infrastructure products. Jabil operates as a global electronics manufacturing powerhouse, offering diverse design and production services across multiple industries. This analysis explores their contrasting operational models to identify which offers superior risk-adjusted returns for a diversified portfolio in today’s dynamic market environment.
Table of contents
Companies Overview
Celestica and Jabil stand as pivotal players in the global hardware manufacturing landscape.
Celestica Inc.: Advanced Hardware & Supply Chain Solutions
Celestica dominates as a provider of hardware platform and supply chain solutions across North America, Europe, and Asia. Its core revenue stems from complex electronics manufacturing, design, and supply chain services. In 2026, it strategically emphasizes advanced technology solutions and cloud connectivity to support aerospace, defense, and hyperscalers, reinforcing its competitive edge in integrated service offerings.
Jabil Inc.: Global Electronics Manufacturing Powerhouse
Jabil is a global leader in electronics manufacturing services and diversified manufacturing solutions. It earns revenue through design, production, and assembly of electronic and electro-mechanical products. The company focuses on expanding 5G, wireless, and cloud industrial segments, leveraging its expertise in rapid prototyping and product validation to meet evolving market demands in 2026.
Strategic Collision: Similarities & Divergences
Both companies operate in hardware manufacturing but diverge in strategy. Celestica leans on integrated supply chain and cloud infrastructure, while Jabil prioritizes design innovation and diversified manufacturing services. Their primary battleground is in advanced electronics production for tech-driven industries. Each presents distinct investment profiles—Celestica with a tighter focus on technology solutions, Jabil on broad manufacturing scale and service diversification.
Income Statement Comparison
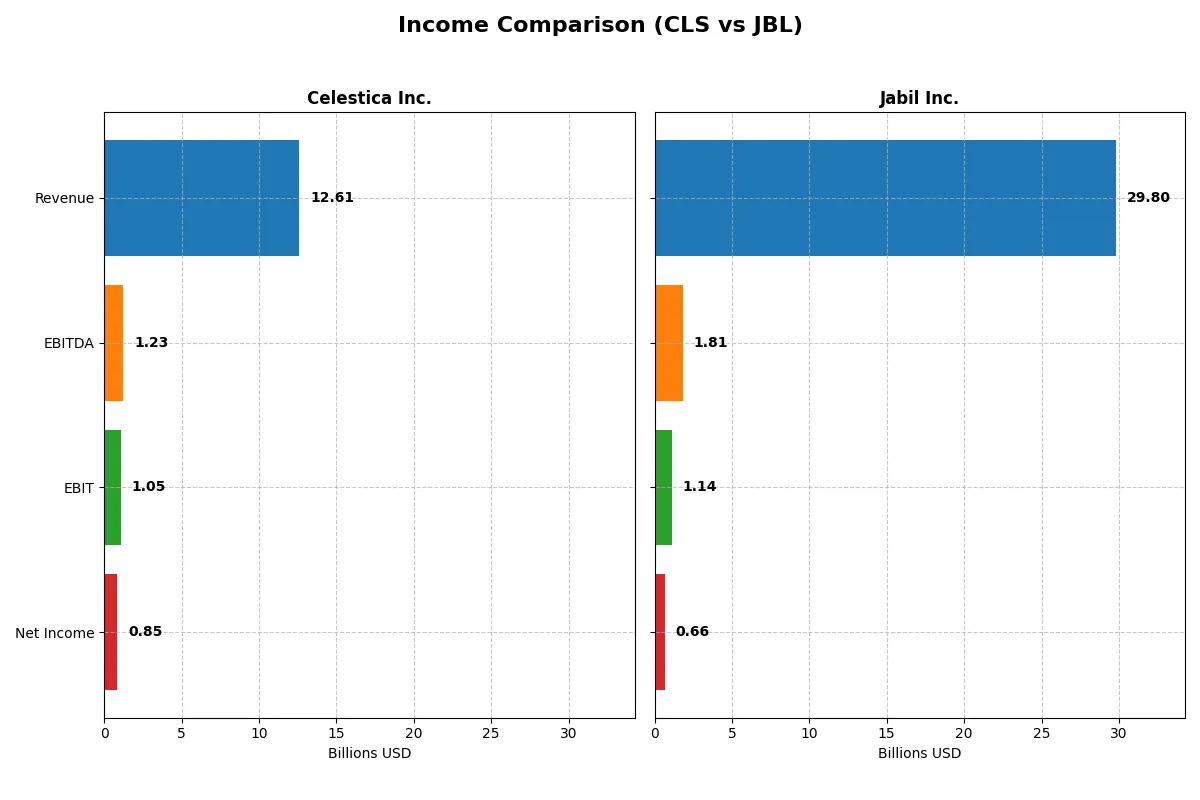
The following data dissects the core profitability and scalability of both corporate engines to reveal who dominates the bottom line:
| Metric | Celestica Inc. (CLS) | Jabil Inc. (JBL) |
|---|---|---|
| Revenue | 12.6B | 29.8B |
| Cost of Revenue | 11.1B | 27.2B |
| Operating Expenses | 385M | 1.46B |
| Gross Profit | 1.47B | 2.65B |
| EBITDA | 1.23B | 1.81B |
| EBIT | 1.05B | 1.14B |
| Interest Expense | 54M | 244M |
| Net Income | 847M | 657M |
| EPS | 7.22 | 6.00 |
| Fiscal Year | 2025 | 2025 |
Income Statement Analysis: The Bottom-Line Duel
The following income statement comparison reveals which company operates with superior efficiency and stronger profit momentum.
Celestica Inc. Analysis
Celestica posted a strong revenue surge from 5.6B in 2021 to 12.6B in 2025, more than doubling in four years. Net income soared, increasing over 8x to 847M in 2025, reflecting robust bottom-line growth. Gross and net margins improved, reaching 11.7% and 6.7% respectively, signaling enhanced operational control and profitability momentum.
Jabil Inc. Analysis
Jabil’s revenue grew modestly from 29.3B in 2021 to 29.8B in 2025, showing stagnation over five years. Net income declined from 696M to 657M, with net margins compressing to 2.2%, indicating margin pressure. Gross margin slipped slightly below 9%, while EBIT margin halved to 3.8%, highlighting weakening profitability and efficiency challenges.
Margin Expansion vs. Revenue Stagnation
Celestica clearly outpaces Jabil in profitability growth and margin expansion despite smaller scale. Celestica’s efficient cost management and strong earnings growth contrast with Jabil’s flat revenue and shrinking margins. For investors, Celestica’s profile offers a more compelling mix of momentum and improving profitability.
Financial Ratios Comparison
These vital ratios act as a diagnostic tool to expose underlying fiscal health, valuation premiums, and capital efficiency for a clear comparative assessment:
| Ratios | Celestica Inc. (CLS) | Jabil Inc. (JBL) |
|---|---|---|
| ROE | 22.6% | 43.4% |
| ROIC | 16.1% | 16.1% |
| P/E | 25.5 | 34.1 |
| P/B | 5.7 | 14.8 |
| Current Ratio | 1.49 | 1.00 |
| Quick Ratio | 0.91 | 0.66 |
| D/E (Debt-to-Equity) | 0.42 | 2.22 |
| Debt-to-Assets | 13.3% | 18.2% |
| Interest Coverage | 11.5 | 4.8 |
| Asset Turnover | 1.61 | 1.61 |
| Fixed Asset Turnover | 14.6 | 9.0 |
| Payout Ratio | 0 | 5.5% |
| Dividend Yield | 0 | 0.16% |
| Fiscal Year | 2024 | 2025 |
Efficiency & Valuation Duel: The Vital Signs
Financial ratios act as the company’s DNA, revealing hidden risks and operational excellence vital for investment decisions.
Celestica Inc.
Celestica posts a strong ROE of 22.57%, signaling effective equity use despite a modest 4.44% net margin. Its P/E of 25.47 and P/B of 5.75 suggest a stretched valuation. The absence of dividends highlights focus on reinvestment in R&D and growth initiatives, reflecting a strategy to enhance long-term value.
Jabil Inc.
Jabil delivers an impressive ROE of 43.42% but with a lower net margin of 2.2%, indicating high leverage in profitability. Its P/E at 34.14 and P/B at 14.82 mark it as expensive. The slight dividend yield of 0.16% contrasts with significant reinvestment, balancing shareholder returns with capital allocation for expansion.
Valuation Stretch vs. Operational Strength
Celestica offers a more balanced risk profile with favorable leverage and efficiency ratios, despite its stretched valuation. Jabil’s operational excellence comes at a premium, burdened by weaker liquidity and higher debt. Investors seeking stability might prefer Celestica, while those targeting high growth with tolerance for risk may lean toward Jabil.
Which one offers the Superior Shareholder Reward?
I observe that Celestica Inc. (CLS) pays no dividends, focusing on reinvesting free cash flow of 2.57/share into growth and acquisitions. Jabil Inc. (JBL) offers a modest dividend yield around 0.3% and a low payout ratio near 5%. JBL also deploys significant capital to share buybacks, contributing to a stronger total shareholder return. CLS’s buyback activity appears limited, favoring reinvestment for long-term value. JBL’s distribution model balances income and buybacks sustainably, while CLS prioritizes growth. In 2026, I conclude JBL provides a more attractive total return profile due to its shareholder-friendly capital allocation and moderate yield.
Comparative Score Analysis: The Strategic Profile
The radar chart reveals the fundamental DNA and trade-offs of Celestica Inc. and Jabil Inc., highlighting their distinct financial strengths and weaknesses:
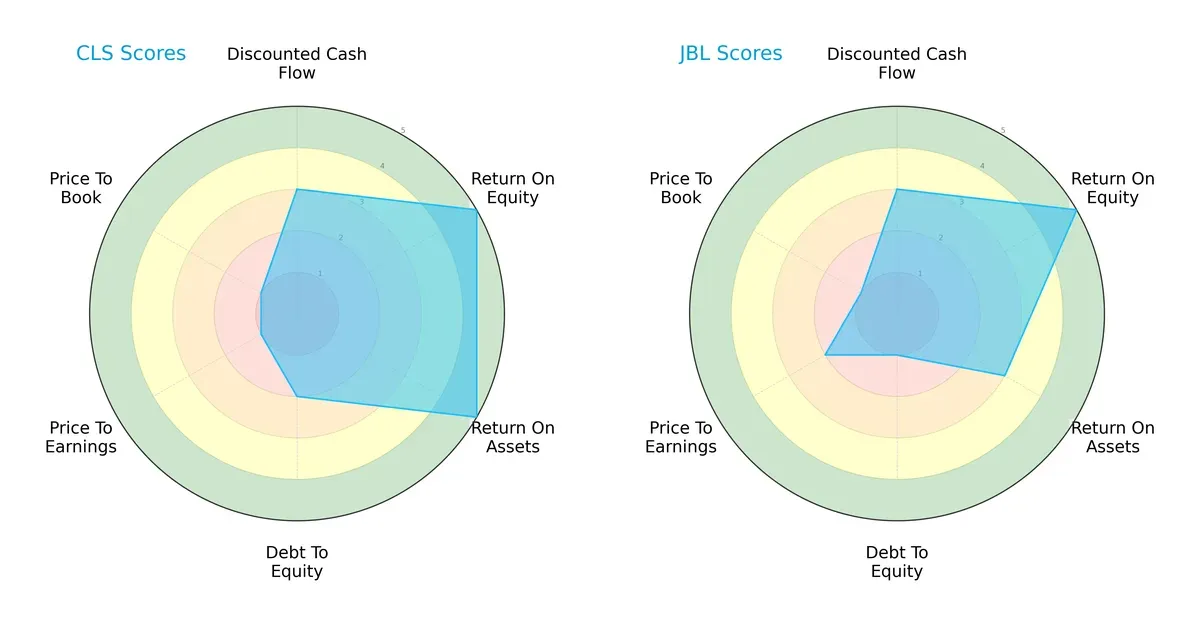
Celestica excels in asset utilization and equity returns, scoring very favorable in ROE and ROA. Jabil matches Celestica’s ROE but lags in ROA, suggesting less efficient asset use. Celestica maintains a stronger debt position (score 2 vs. 1), signaling better financial stability. Both firms show moderate DCF scores, but Jabil fares slightly better on P/E valuation. Celestica’s profile is more balanced, while Jabil relies heavily on equity returns amid higher leverage risks.
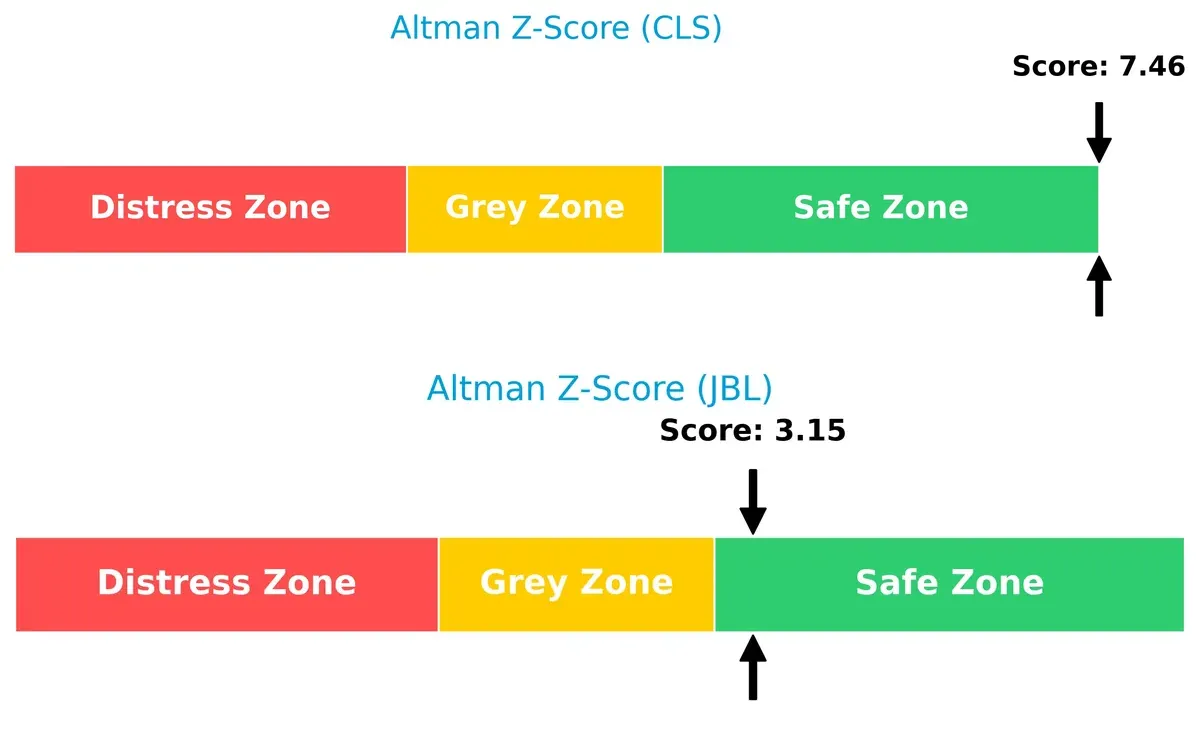
Bankruptcy Risk: Solvency Showdown
The Altman Z-Score differential indicates that Celestica’s 7.46 score far surpasses Jabil’s 3.15, placing both safely above distress but highlighting Celestica’s superior long-term solvency:
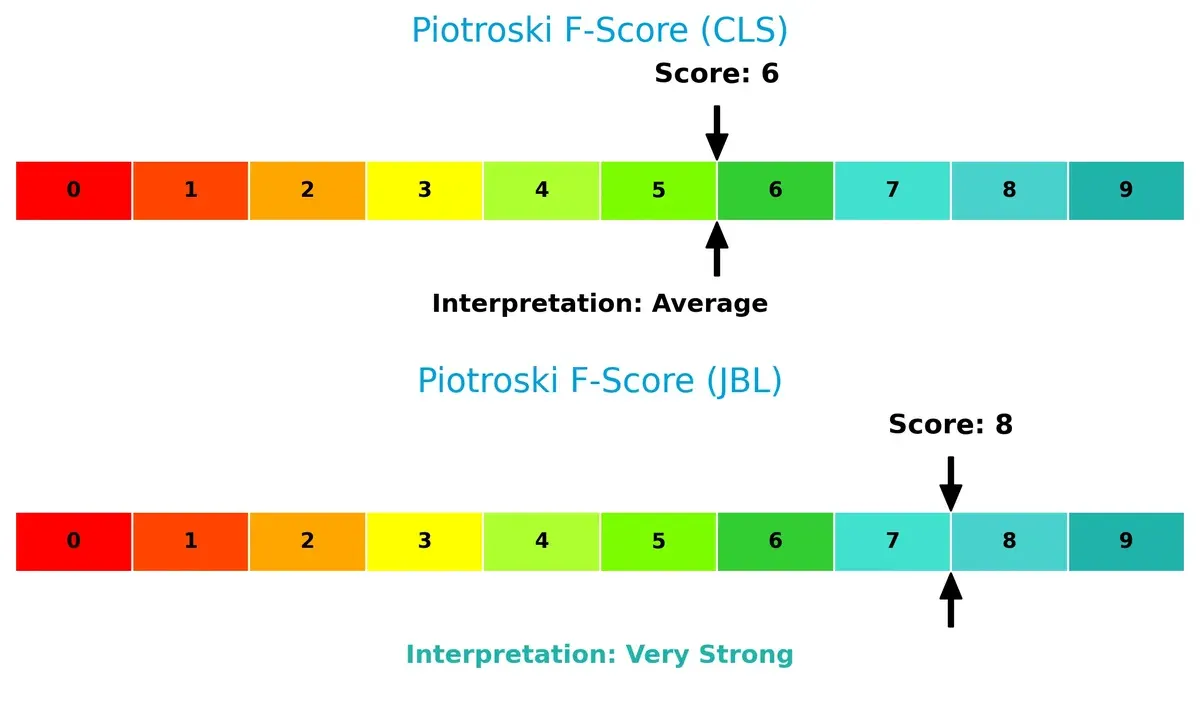
Financial Health: Quality of Operations
Jabil’s Piotroski F-Score of 8 signals very strong operational health, outpacing Celestica’s average 6. This suggests Jabil has more robust internal financial controls and fewer red flags in profitability, leverage, and liquidity:
How are the two companies positioned?
This section dissects Celestica’s and Jabil’s operational DNA by comparing revenue distribution and internal dynamics. The goal is to confront their economic moats to identify the more resilient, sustainable advantage.
Revenue Segmentation: The Strategic Mix
This visual comparison dissects how Celestica Inc. and Jabil Inc. diversify their income streams and where their primary sector bets lie:
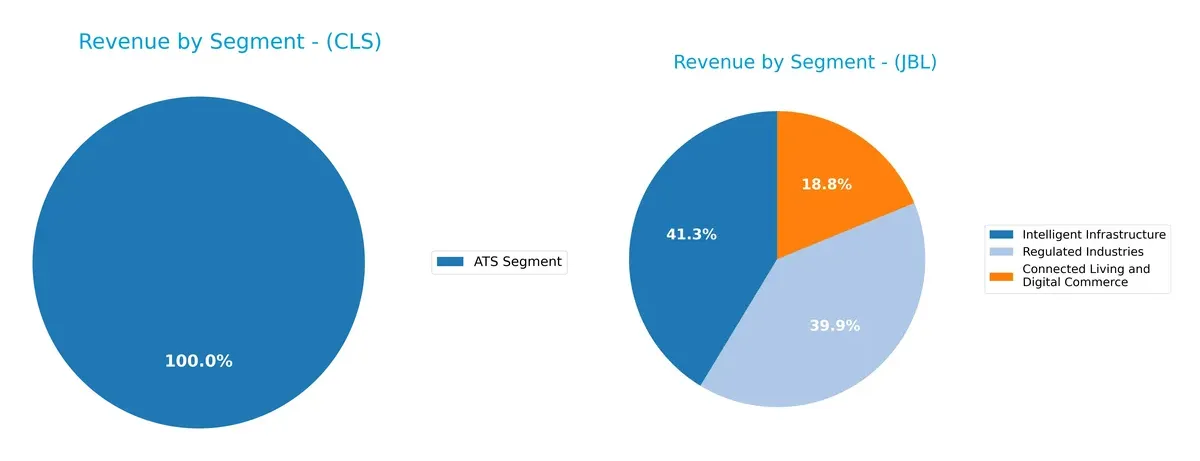
Celestica Inc. generates $3.16B solely from its ATS segment, showing high concentration risk. In contrast, Jabil Inc. spreads revenue across Connected Living ($5.61B), Intelligent Infrastructure ($12.32B), and Regulated Industries ($11.88B), reflecting a robust, diversified model. Jabil’s multi-sector exposure anchors stability and ecosystem lock-in. Celestica’s reliance on one segment could amplify vulnerability to industry shifts.
Strengths and Weaknesses Comparison
This table compares the Strengths and Weaknesses of Celestica Inc. (CLS) and Jabil Inc. (JBL):
CLS Strengths
- Favorable ROE at 22.57%
- Low debt to equity at 0.42
- Strong interest coverage of 19.69
- High asset turnover at 1.61
- High fixed asset turnover at 14.58
JBL Strengths
- Favorable ROE at 43.42%
- Favorable ROIC at 16.06%
- Diverse revenue streams across multiple segments
- Global geographic presence in US, China, Mexico, Malaysia
- Favorable asset turnover at 1.61
- Solid fixed asset turnover at 9.01
CLS Weaknesses
- Unfavorable net margin at 4.44%
- Unfavorable P/E of 25.47
- Unfavorable P/B of 5.75
- No dividend yield
- Neutral liquidity ratios (current 1.49, quick 0.91)
- Unavailable WACC and ROIC data
JBL Weaknesses
- Unfavorable net margin at 2.2%
- High P/E at 34.14
- Very high P/B of 14.82
- Unfavorable quick ratio at 0.66
- High debt to equity at 2.22
- Low interest coverage of 4.66
- Slightly unfavorable overall ratios rating
Celestica shows financial strength in leverage and efficiency but struggles with profitability metrics and valuation multiples. Jabil displays a diversified revenue base and global footprint but faces challenges in profitability, leverage, and liquidity. Both companies reveal trade-offs between operational scale and financial risk management.
The Moat Duel: Analyzing Competitive Defensibility
A structural moat alone preserves long-term profits from relentless competition and market entry pressures. Let’s dissect the moat types and durability of Celestica Inc. and Jabil Inc.:
Celestica Inc.: Operational Excellence and Innovation Moat
Celestica’s primary moat stems from complex supply chain and manufacturing integration. Its financials show rapidly growing ROIC trends, signaling improving capital efficiency. New tech segments in cloud and aerospace may deepen this moat in 2026.
Jabil Inc.: Scale and Cost-Advantage Moat
Jabil relies on scale economies and diversified manufacturing services, contrasting Celestica’s innovation focus. Its ROIC exceeds WACC by nearly 7%, confirming value creation and a very favorable moat. Expansion in 5G and automotive sectors could further fortify this lead.
Scale Efficiency vs. Innovation Integration: The Moat Showdown
Jabil’s wider moat benefits from scale and consistent excess returns, while Celestica shows a promising but unquantified moat improvement. I see Jabil better equipped to defend market share through cost advantage and geographic diversification in 2026.
Which stock offers better returns?
Over the past 12 months, Celestica Inc. and Jabil Inc. showed strong price movements with contrasting recent momentum and volume dynamics.
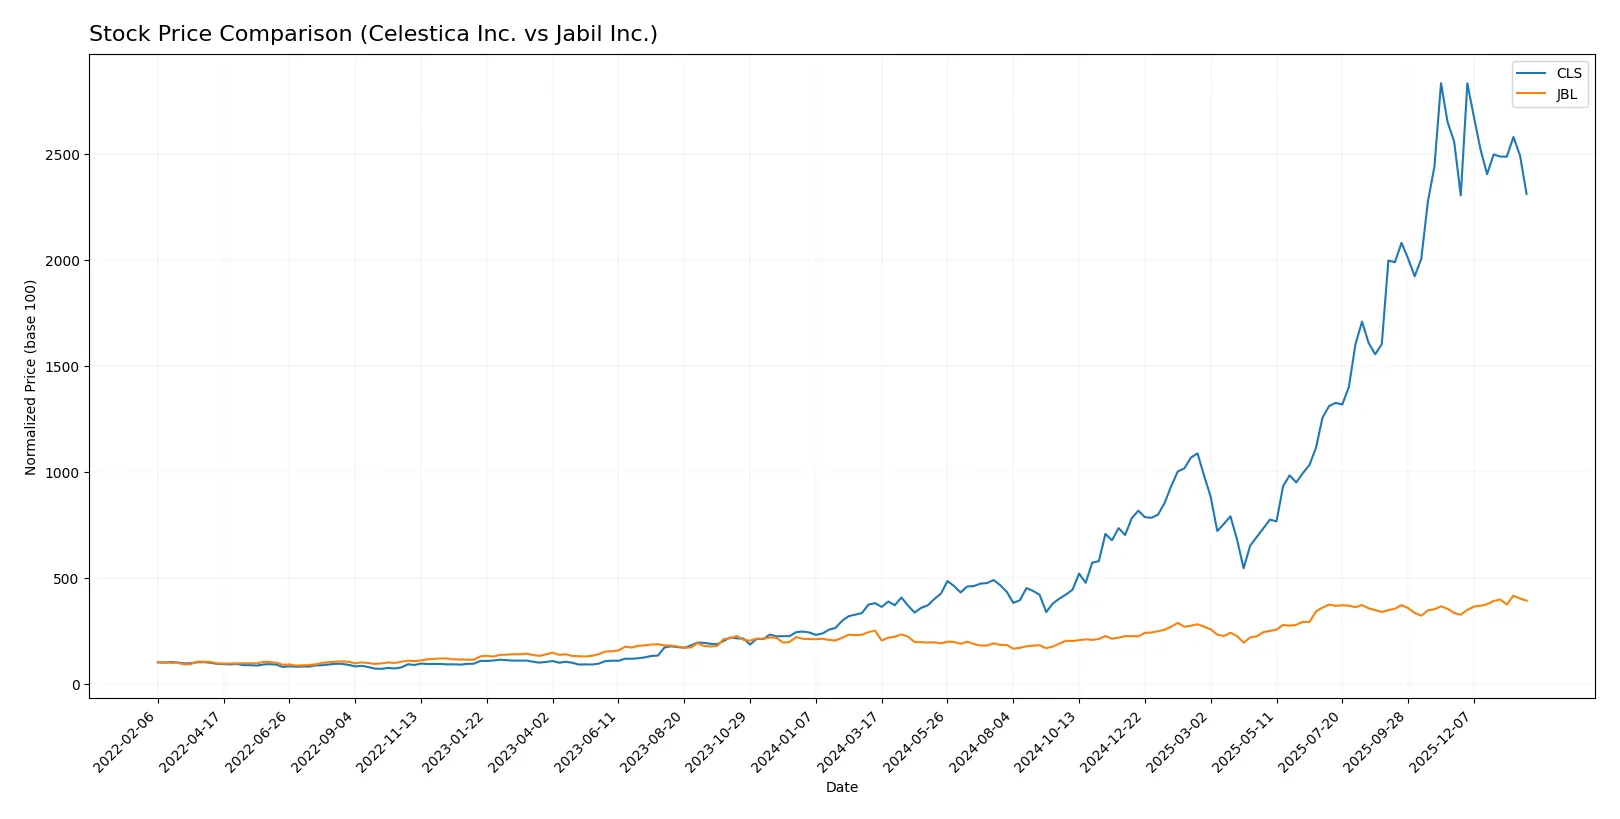
Trend Comparison
Celestica Inc. exhibits a bullish trend with a 509.52% price increase over the past year, though recent months show a 9.61% decline and decelerating momentum. Volatility remains high with a 92.63 standard deviation.
Jabil Inc. displays a bullish trend with a 56.83% gain over the last 12 months, accelerating recently with a 17.5% rise and lower volatility at 44.31 standard deviation.
Celestica’s overall return far surpasses Jabil’s, but Jabil shows stronger recent upward momentum and buyer dominance.
Target Prices
Analysts show a bullish stance on both Celestica Inc. and Jabil Inc. with solid upside potential.
| Company | Target Low | Target High | Consensus |
|---|---|---|---|
| Celestica Inc. | 300 | 440 | 365.6 |
| Jabil Inc. | 244 | 283 | 267.25 |
Celestica’s consensus target of 365.6 implies a 30% upside from the current 281. Jabil’s 267.25 target suggests a 13% gain from 237. Both show attractive growth prospects relative to their prices.

Don’t Let Luck Decide Your Entry Point
Optimize your entry points with our advanced ProRealTime indicators. You’ll get efficient buy signals with precise price targets for maximum performance. Start outperforming now!
How do institutions grade them?
Celestica Inc. Grades
The table below summarizes recent institutional grades for Celestica Inc.:
| Grading Company | Action | New Grade | Date |
|---|---|---|---|
| Citigroup | Maintain | Buy | 2026-01-30 |
| Barclays | Maintain | Overweight | 2026-01-30 |
| Goldman Sachs | Maintain | Buy | 2025-12-01 |
| Barclays | Maintain | Overweight | 2025-11-14 |
| Citigroup | Upgrade | Buy | 2025-11-10 |
| Goldman Sachs | Maintain | Buy | 2025-10-29 |
| CIBC | Maintain | Outperform | 2025-10-29 |
| Stifel | Maintain | Buy | 2025-10-29 |
| Barclays | Maintain | Overweight | 2025-10-29 |
| JP Morgan | Maintain | Overweight | 2025-10-29 |
Jabil Inc. Grades
The table below summarizes recent institutional grades for Jabil Inc.:
| Grading Company | Action | New Grade | Date |
|---|---|---|---|
| UBS | Maintain | Neutral | 2025-12-18 |
| Barclays | Maintain | Overweight | 2025-12-18 |
| JP Morgan | Maintain | Overweight | 2025-12-18 |
| B of A Securities | Maintain | Buy | 2025-12-10 |
| B of A Securities | Maintain | Buy | 2025-09-26 |
| Barclays | Maintain | Overweight | 2025-09-26 |
| JP Morgan | Maintain | Overweight | 2025-07-17 |
| B of A Securities | Maintain | Buy | 2025-06-20 |
| UBS | Maintain | Neutral | 2025-06-18 |
| B of A Securities | Maintain | Buy | 2025-06-18 |
Which company has the best grades?
Celestica Inc. consistently receives Buy and Overweight grades from top firms, including upgrades. Jabil Inc. shows a mix of Buy, Overweight, and Neutral grades. Celestica’s stronger consensus may suggest higher institutional confidence, potentially influencing investor sentiment more positively.
Risks specific to each company
The following categories identify the critical pressure points and systemic threats facing both firms in the 2026 market environment:
1. Market & Competition
Celestica Inc. (CLS)
- Faces intense competition in hardware and supply chain sectors, with a broad but specialized product mix.
Jabil Inc. (JBL)
- Operates in highly competitive electronics manufacturing with diversified services, facing pressure from global peers.
2. Capital Structure & Debt
Celestica Inc. (CLS)
- Maintains a conservative debt-to-equity ratio of 0.42, signaling financial stability and manageable leverage.
Jabil Inc. (JBL)
- Exhibits high leverage with debt-to-equity at 2.22, increasing financial risk and interest burden.
3. Stock Volatility
Celestica Inc. (CLS)
- Beta of 1.46 indicates above-market volatility, raising risk during downturns.
Jabil Inc. (JBL)
- Beta of 1.25 shows moderate volatility, less sensitivity to market swings than CLS.
4. Regulatory & Legal
Celestica Inc. (CLS)
- Exposure to multi-jurisdictional regulations across North America, Europe, and Asia; moderate legal risks.
Jabil Inc. (JBL)
- Faces complex compliance challenges worldwide, especially in electronics and manufacturing standards.
5. Supply Chain & Operations
Celestica Inc. (CLS)
- Supply chain complexity is high but benefits from integrated services and precision assembly capabilities.
Jabil Inc. (JBL)
- Extensive global operations increase exposure to supply disruptions and operational inefficiencies.
6. ESG & Climate Transition
Celestica Inc. (CLS)
- Increasing pressure to meet ESG standards; energy storage and smart meters could be growth drivers.
Jabil Inc. (JBL)
- ESG compliance is critical due to broad manufacturing footprint and regulatory scrutiny on emissions.
7. Geopolitical Exposure
Celestica Inc. (CLS)
- Significant exposure in Asia and Europe creates risks from trade tensions and political instability.
Jabil Inc. (JBL)
- U.S.-based with global operations, faces tariffs and geopolitical risks but benefits from domestic base.
Which company shows a better risk-adjusted profile?
Celestica’s controlled leverage and strong operational focus offer a more stable risk profile. Jabil’s high debt and wider operational exposure amplify risks despite robust profitability metrics. Celestica’s higher beta and market competition remain concerns, but its financial prudence mitigates them better than Jabil’s stretched balance sheet.
Final Verdict: Which stock to choose?
Celestica Inc. (CLS) shines with a superpower in its impressive growth trajectory and efficiency improvements. Its rising return on invested capital signals a company sharpening its competitive edge. A point of vigilance remains its valuation premium, which could pressure returns. CLS suits an aggressive growth portfolio aiming for capital appreciation amid moderate risk.
Jabil Inc. (JBL) secures a durable moat through consistent value creation and a robust return on invested capital exceeding its cost of capital. Its solid asset utilization and very strong financial health provide relative safety compared to CLS. JBL fits well in a GARP portfolio, balancing growth potential with a focus on financial stability.
If you prioritize aggressive growth and are comfortable with valuation risks, Celestica stands out due to its accelerating profitability and operational momentum. However, if you seek better stability with a durable competitive advantage and stronger balance sheet resilience, Jabil offers a more prudent choice despite trading at a premium. Both scenarios require caution around market volatility and sector cyclicality.
Disclaimer: Investment carries a risk of loss of initial capital. The past performance is not a reliable indicator of future results. Be sure to understand risks before making an investment decision.
Go Further
I encourage you to read the complete analyses of Celestica Inc. and Jabil Inc. to enhance your investment decisions: