Home > Comparison > Technology > GRMN vs CLS
The strategic rivalry between Garmin Ltd. and Celestica Inc. defines the current trajectory of the hardware, equipment & parts sector. Garmin operates as a diversified technology innovator with proprietary wireless devices and avionics solutions. Celestica, by contrast, excels as a capital-intensive contract manufacturer and supply chain solutions provider. This analysis will determine which distinct corporate model offers the superior risk-adjusted return for a diversified portfolio in 2026.
Table of contents
Companies Overview
Garmin Ltd. and Celestica Inc. stand as pivotal players in the global hardware and technology sectors.
Garmin Ltd.: Innovator in Wireless and Avionics Devices
Garmin Ltd. dominates as a designer and manufacturer of wireless devices across fitness, outdoor, aviation, marine, and automotive segments. Its revenue primarily stems from sales of specialized hardware like fitness watches, avionics solutions, and marine electronics. In 2026, Garmin strategically focuses on expanding its connected device ecosystem and enhancing user platforms like Garmin Connect to deepen customer engagement.
Celestica Inc.: Leader in Hardware Platform and Supply Chain Solutions
Celestica Inc. specializes in providing manufacturing and supply chain services for advanced technology and cloud connectivity products. It earns revenue by offering design, sourcing, assembly, and after-market repair across industries such as aerospace, energy, and healthtech. The company’s 2026 strategy emphasizes innovation in complex systems integration and expanding its footprint in hyperscaler and cloud-based infrastructure markets.
Strategic Collision: Similarities & Divergences
Both companies operate in hardware and technology, yet Garmin pursues a direct-to-consumer model with proprietary products, while Celestica acts as an outsourced manufacturer and supply chain partner. Their primary battle unfolds in the high-tech hardware supply chain and service ecosystem, where Garmin’s branded devices compete indirectly with Celestica’s contract manufacturing scale. Their investment profiles diverge sharply: Garmin offers stable, product-driven growth; Celestica presents cyclical exposure tied to diverse industrial demand.
Income Statement Comparison
This data dissects the core profitability and scalability of both corporate engines to reveal who dominates the bottom line:
| Metric | Garmin Ltd. (GRMN) | Celestica Inc. (CLS) |
|---|---|---|
| Revenue | 6.3B | 9.6B |
| Cost of Revenue | 2.6B | 8.6B |
| Operating Expenses | 2.1B | 434M |
| Gross Profit | 3.7B | 1.0B |
| EBITDA | 1.8B | 736M |
| EBIT | 1.6B | 584M |
| Interest Expense | 0 | 52M |
| Net Income | 1.4B | 428M |
| EPS | 7.35 | 3.62 |
| Fiscal Year | 2024 | 2024 |
Income Statement Analysis: The Bottom-Line Duel
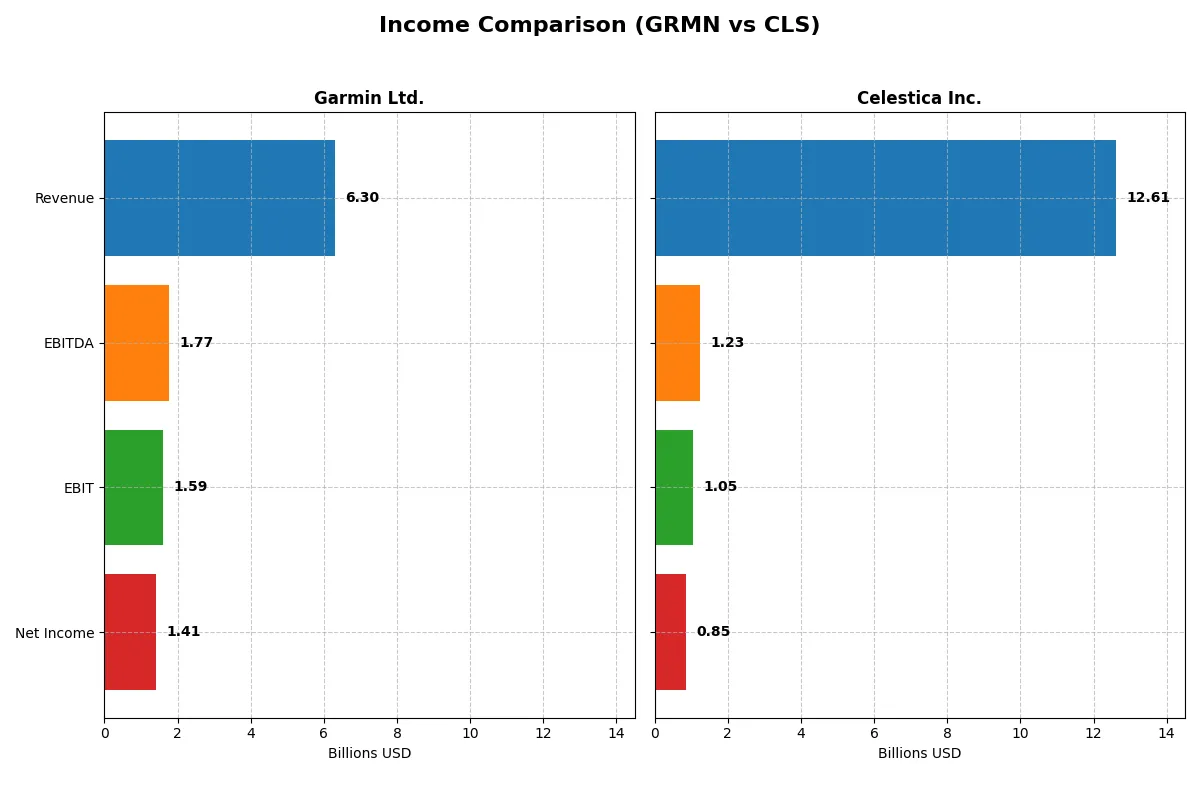
This income statement comparison reveals which company runs a more efficient and profitable business engine through their revenue and profit metrics.
Garmin Ltd. Analysis
Garmin’s revenue climbed steadily from $4.19B in 2020 to $6.30B in 2024, with net income rising from $992M to $1.41B. The company maintains strong gross margins near 59%, reflecting healthy cost control. Its 2024 EBIT margin at 25.3% signals robust operating efficiency, though net margin dipped slightly. Garmin shows consistent momentum with favorable revenue and earnings growth.
Celestica Inc. Analysis
Celestica’s revenue surged from $5.63B in 2021 to $12.61B in 2025, more than doubling over five years. Net income expanded even faster, from $104M to $847M, pushing net margin up to 6.7%. Despite lower margins than Garmin, Celestica’s rapid growth and operational improvements drove an 80% EBIT increase in the last year, showing accelerating profitability and scale.
Margin Strength vs. Growth Velocity
Garmin leads on margin strength with a 22.4% net margin versus Celestica’s 6.7%, reflecting superior cost management and profitability. However, Celestica outpaces Garmin in top-line and bottom-line growth, more than doubling revenue and increasing net income sevenfold over the period. Investors seeking stable, high-margin earnings may prefer Garmin, while those favoring high-growth profiles might find Celestica more attractive.
Financial Ratios Comparison
These vital ratios act as a diagnostic tool to expose the underlying fiscal health, valuation premiums, and capital efficiency of the companies compared below:
| Ratios | Garmin Ltd. (GRMN) | Celestica Inc. (CLS) |
|---|---|---|
| ROE | 18.0% | 22.6% |
| ROIC | 16.3% | 16.1% |
| P/E | 28.5 | 25.5 |
| P/B | 5.13 | 5.75 |
| Current Ratio | 3.54 | 1.49 |
| Quick Ratio | 2.56 | 0.91 |
| D/E | 0.021 | 0.42 |
| Debt-to-Assets | 1.7% | 13.3% |
| Interest Coverage | 0 | 11.5 |
| Asset Turnover | 0.65 | 1.61 |
| Fixed Asset Turnover | 4.49 | 14.58 |
| Payout Ratio | 40.6% | 0% |
| Dividend Yield | 1.42% | 0% |
| Fiscal Year | 2024 | 2024 |
Efficiency & Valuation Duel: The Vital Signs
Financial ratios act as a company’s DNA, exposing hidden risks and highlighting operational excellence critical for investment decisions.
Garmin Ltd.
Garmin posts strong profitability with a 17.98% ROE and a robust 22.41% net margin, signaling operational efficiency. However, its valuation appears stretched, with a P/E of 28.5 and P/B of 5.13. Garmin offers shareholders a modest 1.42% dividend yield, balancing returns with reinvestment in R&D at 15.8% of revenue.
Celestica Inc.
Celestica delivers a higher ROE of 22.57% but suffers from a weaker net margin of 4.44%, reflecting margin pressure. The stock trades at a slightly lower P/E of 25.47 but remains expensive relative to fundamentals. Celestica pays no dividend, focusing on growth through capital allocation and maintaining a lean cost structure.
Premium Valuation vs. Operational Safety
Garmin combines solid profitability with a premium valuation, suggesting a mature company balancing shareholder returns and innovation. Celestica offers higher ROE but lower margins and no dividends, indicating a riskier growth profile. Conservative investors may prefer Garmin’s stability; growth seekers might lean toward Celestica’s potential.
Which one offers the Superior Shareholder Reward?
Garmin (GRMN) delivers a balanced distribution approach with a 1.42% dividend yield and a 40.6% payout ratio, supported by strong free cash flow (6.45/share). Its buyback program consistently enhances shareholder value. Celestica (CLS) pays no dividend, focusing on reinvestment and modest buybacks amid lower profitability. Garmin’s sustainable dividend and aggressive buybacks offer a superior total return profile in 2026.
Comparative Score Analysis: The Strategic Profile
The radar chart reveals the fundamental DNA and trade-offs of Garmin Ltd. and Celestica Inc., highlighting their financial strengths and valuation challenges:
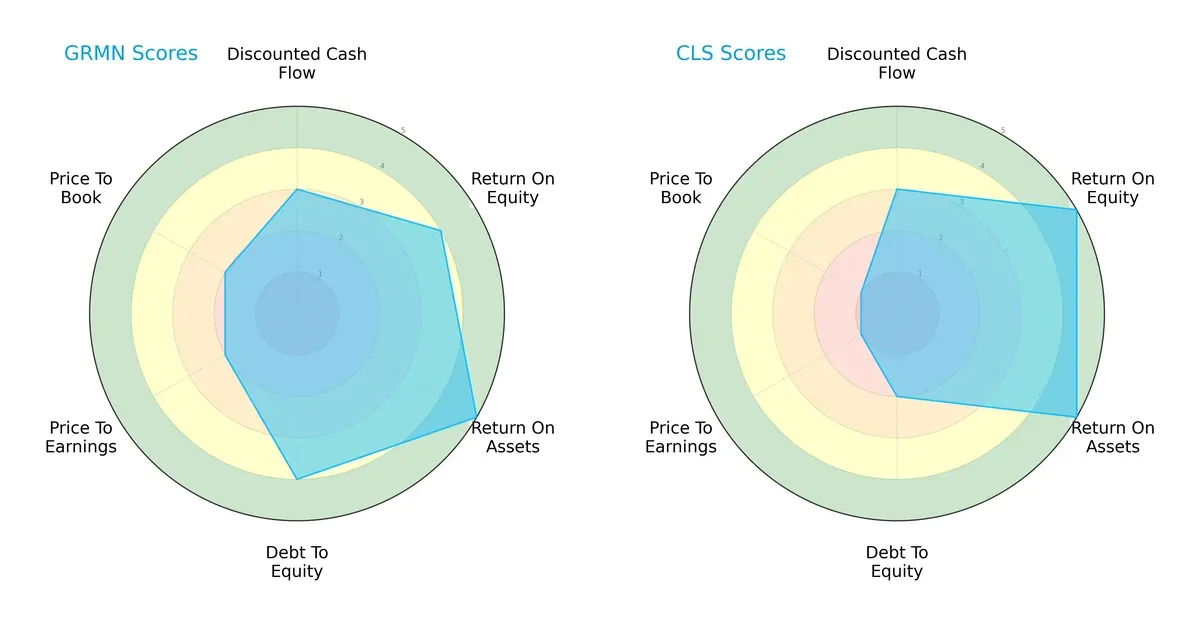
Garmin shows a more balanced profile, excelling in asset efficiency (ROA 5) and financial stability (Debt/Equity 4). Celestica outperforms in profitability (ROE 5) but struggles with leverage (Debt/Equity 2) and valuation metrics (P/E and P/B scores at 1). Garmin’s moderate valuation scores suggest a fair price, while Celestica’s very low valuation scores indicate potential undervaluation but also higher risk.
Bankruptcy Risk: Solvency Showdown
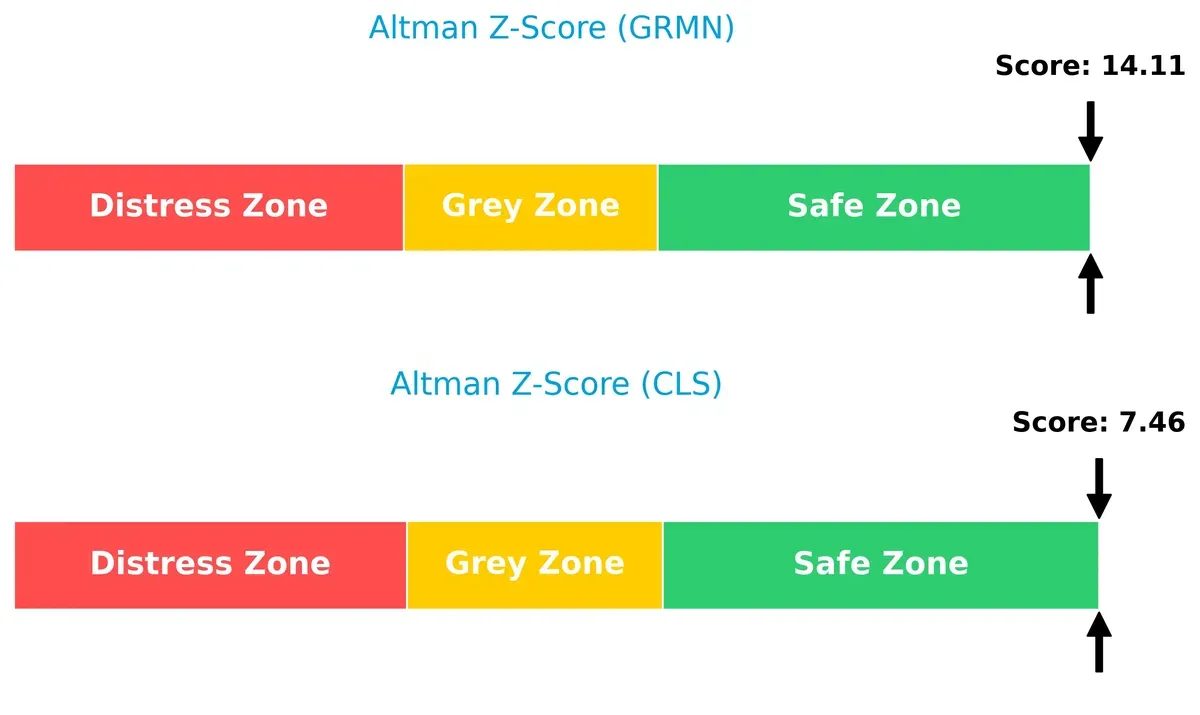
Garmin’s Altman Z-Score of 14.1 versus Celestica’s 7.5 signals both firms reside safely above distress thresholds; Garmin, however, demonstrates a significantly stronger cushion for long-term survival in this cycle:
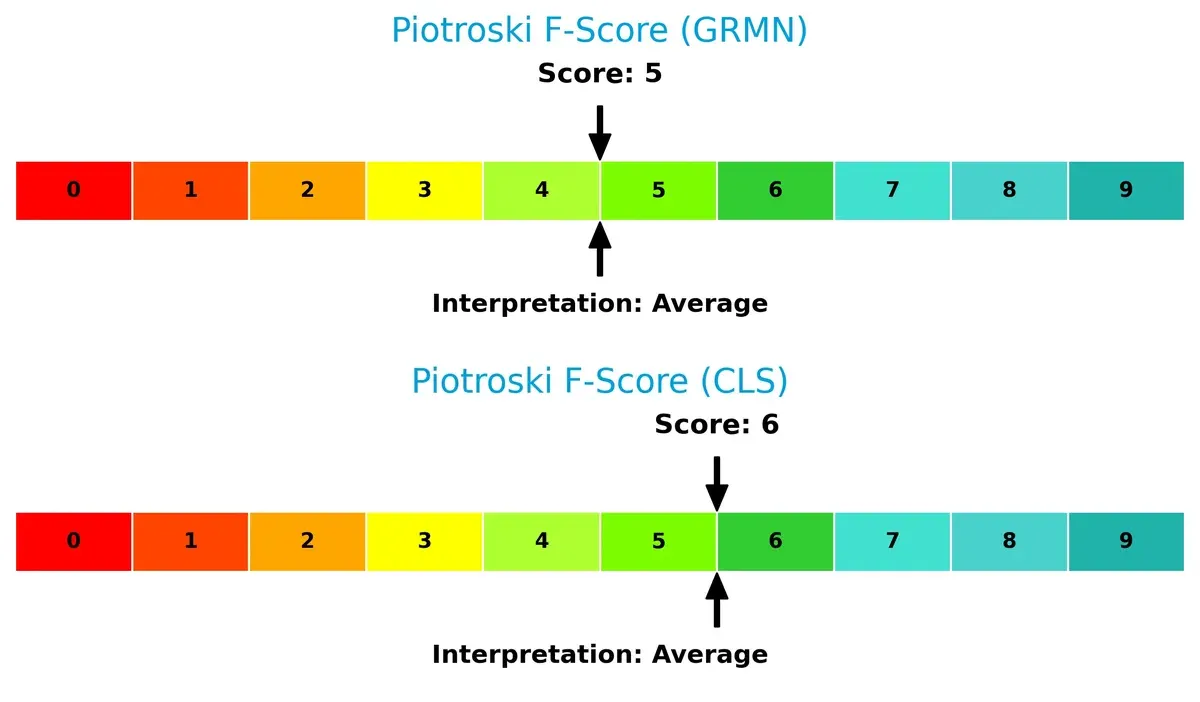
Financial Health: Quality of Operations
Celestica’s Piotroski F-Score of 6 edges out Garmin’s 5, indicating slightly stronger operational quality. Neither firm shows red flags, but Garmin’s average score suggests room for improvement in internal financial metrics:
How are the two companies positioned?
This section dissects Garmin and Celestica’s operational DNA by comparing their revenue distribution and internal dynamics. The goal is to confront their economic moats and identify the more resilient competitive advantage today.
Revenue Segmentation: The Strategic Mix
This visual comparison dissects how Garmin Ltd. and Celestica Inc. diversify their income streams and reveals where their primary sector bets lie:
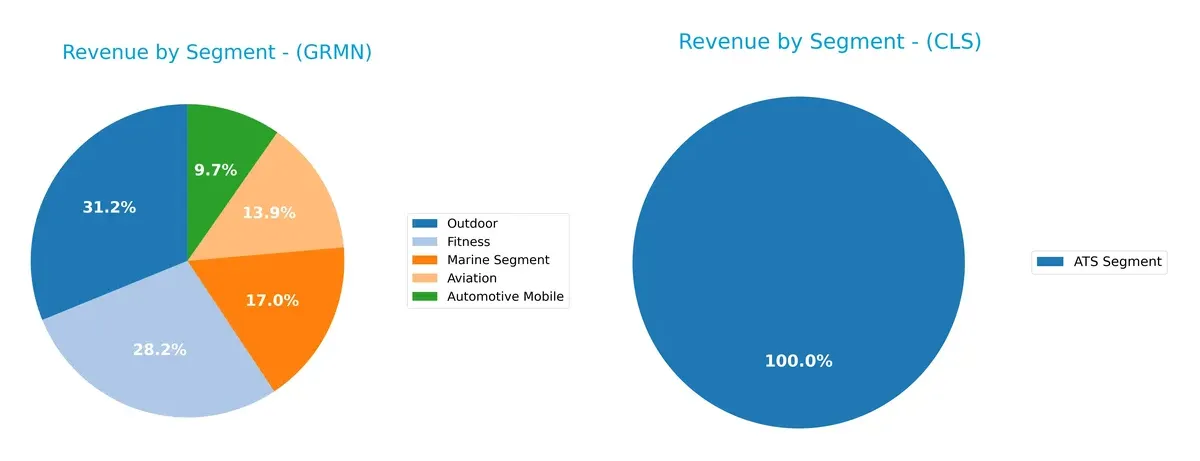
Garmin displays a well-diversified revenue base with Outdoor leading at $1.96B, followed closely by Fitness at $1.77B and Marine at $1.07B. Automotive Mobile and Aviation contribute less but add balance. Celestica, in contrast, relies entirely on its ATS Segment with $3.16B, anchoring its revenue in a single business line. Garmin’s diversification reduces concentration risk and supports ecosystem lock-in, while Celestica’s focus signals infrastructure dominance but exposes it to sector volatility.
Strengths and Weaknesses Comparison
This table compares the strengths and weaknesses of Garmin Ltd. and Celestica Inc. based on diversification, profitability, financials, innovation, global presence, and market share:
Garmin Ltd. Strengths
- Diverse revenue streams across five product segments
- Strong net margin at 22.41%
- ROE and ROIC indicate efficient capital use
- Very low debt ratio enhances financial stability
- Solid presence in Americas, EMEA, Asia Pacific
- Favorable fixed asset turnover
Celestica Inc. Strengths
- Favorable ROE at 22.57%
- Strong asset turnover and fixed asset turnover ratios
- Moderate debt levels but manageable
- Interest coverage ratio indicates good debt service ability
Garmin Ltd. Weaknesses
- Unfavorable high P/E and P/B ratios suggest overvaluation
- Very high current ratio may indicate inefficient asset use
- Market presence less focused on single segment
- Neutral asset turnover ratio
Celestica Inc. Weaknesses
- Low net margin at 4.44% restrains profitability
- Unavailable ROIC and WACC data limit valuation clarity
- No dividend yield affects income investors
- Limited product diversification with one segment
Garmin’s broad product and geographic diversification support its financial strength and global market position. Conversely, Celestica’s reliance on a single segment and lower profitability highlight challenges despite solid capital efficiency. These dynamics have clear implications for each company’s strategic focus on growth and risk management.
The Moat Duel: Analyzing Competitive Defensibility
A structural moat is the only reliable shield guarding long-term profits from relentless competition erosion. Here’s how Garmin and Celestica stack up:
Garmin Ltd.: Intangible Assets and Brand Loyalty
Garmin leverages strong brand loyalty and proprietary software platforms, reflected in a high 58.7% gross margin and steady ROIC exceeding WACC by 7.7%. New fitness and aviation products aim to reinforce this moat in 2026.
Celestica Inc.: Operational Efficiency and Scale
Celestica’s competitive edge lies in cost advantage through scale and supply chain expertise. Unlike Garmin, it operates with slimmer margins (~11.7%) but shows a rapidly growing ROIC trend, signaling improving capital efficiency and expansion potential.
Verdict: Intangible Assets vs. Operational Scale
Garmin’s wider moat stems from its durable brand and software ecosystem, delivering stable high returns. Celestica’s rising ROIC hints at a deepening moat but remains unproven. Garmin is better equipped to defend market share long term.
Which stock offers better returns?
The past year saw Garmin Ltd. steadily gain 42%, showing accelerating bullish momentum, while Celestica Inc. surged over 500% but decelerated recently with notable volatility.
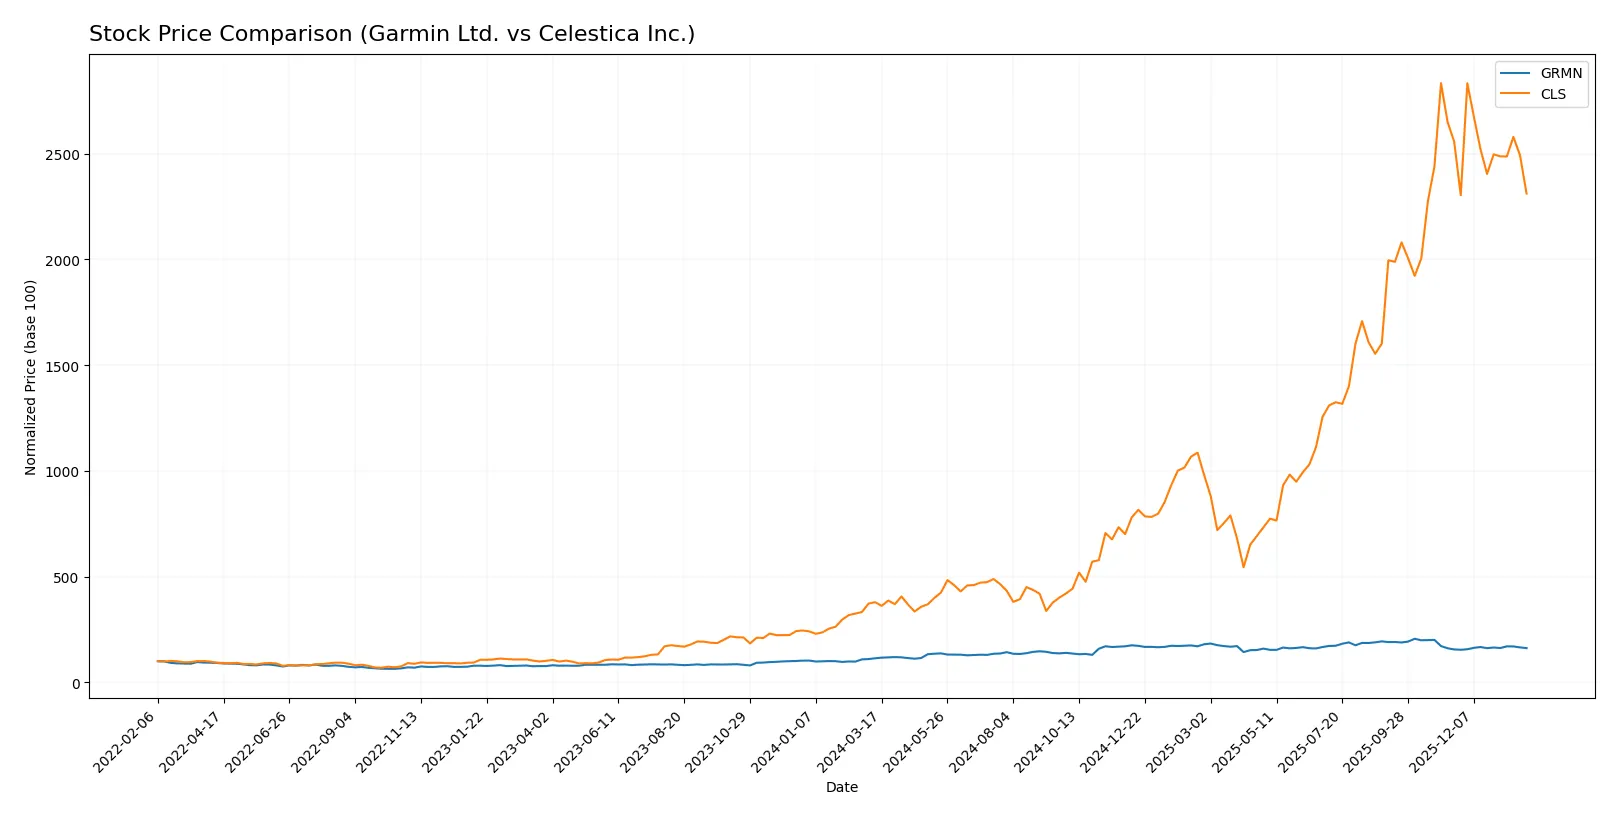
Trend Comparison
Garmin Ltd. recorded a 42.06% price increase over 12 months with accelerating bullish momentum and a standard deviation of 28.33, peaking at 257.06 and bottoming at 139.52.
Celestica Inc. surged 509.52% in the same period, though its trend decelerated recently with a -9.61% decline and higher volatility, shown by a 92.63 standard deviation.
Celestica’s massive overall gain outperformed Garmin, despite recent weakness, delivering the highest market return among the two stocks analyzed.
Target Prices
Analysts project moderate upside potential for Garmin Ltd. and Celestica Inc. based on current consensus targets.
| Company | Target Low | Target High | Consensus |
|---|---|---|---|
| Garmin Ltd. | 193 | 310 | 240 |
| Celestica Inc. | 300 | 440 | 365.6 |
Garmin’s consensus target of 240 suggests a 19% gain from the current 2026 price of 201.64. Celestica’s 365.6 target implies a 30% increase from its 280.99 price. Both show analyst optimism relative to market levels.

Don’t Let Luck Decide Your Entry Point
Optimize your entry points with our advanced ProRealTime indicators. You’ll get efficient buy signals with precise price targets for maximum performance. Start outperforming now!
How do institutions grade them?
The following tables summarize the latest institutional grades for Garmin Ltd. and Celestica Inc.:
Garmin Ltd. Grades
The table below shows recent grade changes and maintained ratings for Garmin Ltd.:
| Grading Company | Action | New Grade | Date |
|---|---|---|---|
| Barclays | Upgrade | Equal Weight | 2026-01-16 |
| Tigress Financial | Maintain | Strong Buy | 2025-12-19 |
| Longbow Research | Upgrade | Buy | 2025-12-03 |
| Morgan Stanley | Maintain | Underweight | 2025-10-30 |
| Barclays | Maintain | Underweight | 2025-10-30 |
| Tigress Financial | Maintain | Strong Buy | 2025-09-30 |
| Morgan Stanley | Maintain | Underweight | 2025-09-19 |
| Morgan Stanley | Maintain | Underweight | 2025-07-31 |
| Barclays | Maintain | Underweight | 2025-07-31 |
| JP Morgan | Maintain | Neutral | 2025-07-17 |
Celestica Inc. Grades
Here are the latest institutional grades and rating changes for Celestica Inc.:
| Grading Company | Action | New Grade | Date |
|---|---|---|---|
| Citigroup | Maintain | Buy | 2026-01-30 |
| Barclays | Maintain | Overweight | 2026-01-30 |
| Goldman Sachs | Maintain | Buy | 2025-12-01 |
| Barclays | Maintain | Overweight | 2025-11-14 |
| Citigroup | Upgrade | Buy | 2025-11-10 |
| Goldman Sachs | Maintain | Buy | 2025-10-29 |
| CIBC | Maintain | Outperform | 2025-10-29 |
| Stifel | Maintain | Buy | 2025-10-29 |
| Barclays | Maintain | Overweight | 2025-10-29 |
| JP Morgan | Maintain | Overweight | 2025-10-29 |
Which company has the best grades?
Celestica consistently holds Buy and Overweight ratings from multiple institutions, signaling stronger market confidence than Garmin. Garmin’s mix of Underweight and Neutral grades may caution investors seeking immediate upside.
Risks specific to each company
The following categories identify the critical pressure points and systemic threats facing both Garmin Ltd. and Celestica Inc. in the 2026 market environment:
1. Market & Competition
Garmin Ltd.
- Operates in diverse hardware segments with strong brand equity but faces saturation in wearables and GPS markets.
Celestica Inc.
- Faces intense competition in electronics manufacturing with pressure on margins and technological shifts in cloud and connectivity solutions.
2. Capital Structure & Debt
Garmin Ltd.
- Extremely low debt levels (D/E 0.02) provide financial flexibility and low risk of insolvency.
Celestica Inc.
- Moderate leverage (D/E 0.42) raises financial risk but remains manageable given interest coverage ratio of 19.7x.
3. Stock Volatility
Garmin Ltd.
- Exhibits low beta (~1.01), reflecting stable stock price sensitivity aligned with market averages.
Celestica Inc.
- Higher beta (1.46) indicates more volatile stock, increasing downside risk in turbulent markets.
4. Regulatory & Legal
Garmin Ltd.
- Faces regulatory scrutiny in multiple jurisdictions, particularly in aviation and marine electronics.
Celestica Inc.
- Exposure to complex regulations in aerospace and defense sectors, with compliance costs impacting margins.
5. Supply Chain & Operations
Garmin Ltd.
- Relies on global suppliers but maintains strong operational control; disruptions could affect product availability.
Celestica Inc.
- Highly dependent on global supply chains; vulnerable to geopolitical and logistical disruptions, especially in Asia.
6. ESG & Climate Transition
Garmin Ltd.
- Moderate ESG focus; pressure to improve sustainability in manufacturing and product lifecycle management.
Celestica Inc.
- Increasing ESG demands from clients in cloud and energy sectors; must invest in greener operations to stay competitive.
7. Geopolitical Exposure
Garmin Ltd.
- Operations span multiple continents, exposed to trade tensions but benefits from diversified markets.
Celestica Inc.
- Significant exposure to US-China tensions and supply disruptions owing to manufacturing footprint in Asia.
Which company shows a better risk-adjusted profile?
Garmin’s low leverage, stable market position, and strong Altman Z-score place it in a safer zone. Celestica’s higher volatility and moderate debt raise its risk profile despite solid operational metrics. Garmin’s disciplined capital structure and lower beta underpin a superior risk-adjusted stance. Celestica’s dependence on complex supply chains and geopolitical risks demand caution. Recent data highlight Celestica’s stock suffered a sharper 6.3% drop compared to Garmin’s milder 1.5% decline, reflecting heightened investor concern on risk factors.
Final Verdict: Which stock to choose?
Garmin Ltd. exhibits a distinct superpower in operational efficiency and value creation, consistently delivering returns well above its cost of capital. Its strong balance sheet and robust cash flow generation support stability. The key point of vigilance is its relatively high valuation multiples, which could pressure future returns. Garmin suits portfolios targeting steady, quality growth with moderate risk tolerance.
Celestica Inc. leverages its strategic moat in asset turnover and operational agility, reflected in rapid revenue and earnings growth. Though less conservative financially, it offers a compelling growth trajectory backed by improving profitability metrics. Compared to Garmin, Celestica presents a higher risk profile but greater growth upside, fitting investors seeking Growth at a Reasonable Price (GARP) with a tolerance for volatility.
If you prioritize capital preservation and consistent value creation, Garmin outshines with its durable moat and financial strength. However, if you seek accelerated growth and can tolerate earnings volatility, Celestica offers superior momentum and expanding profitability. Each company presents a distinct analytical scenario aligned with differing investor risk appetites and return expectations.
Disclaimer: Investment carries a risk of loss of initial capital. The past performance is not a reliable indicator of future results. Be sure to understand risks before making an investment decision.
Go Further
I encourage you to read the complete analyses of Garmin Ltd. and Celestica Inc. to enhance your investment decisions: