Home > Comparison > Technology > CLS vs FTV
The strategic rivalry between Celestica Inc. and Fortive Corporation shapes the Technology sector’s competitive landscape. Celestica operates as a capital-intensive hardware platform and supply chain solutions provider, while Fortive focuses on engineered professional products and software services. This analysis examines their contrasting operational models and investment profiles. I aim to determine which company presents a superior risk-adjusted opportunity for diversified portfolios amid evolving industry dynamics.

Table of contents
Companies Overview
Celestica Inc. and Fortive Corporation both hold critical roles in the hardware and equipment sector, shaping technology infrastructure across diverse industries.
Celestica Inc.: Global Supply Chain and Hardware Platform Leader
Celestica operates primarily as a hardware platform and supply chain solutions provider. Its revenue stems from product manufacturing and engineering services, including electronics assembly, testing, and logistics. In 2026, Celestica’s strategic focus emphasizes advanced technology and connectivity solutions for sectors like aerospace, cloud services, and healthtech, leveraging its global footprint across North America, Europe, and Asia.
Fortive Corporation: Professional and Engineered Products Innovator
Fortive designs and markets professional test tools and enterprise software for reliability, safety, and asset management. Its revenue engine divides across Intelligent Operating Solutions, Precision Technologies, and Advanced Healthcare segments. Fortive’s 2026 strategy centers on expanding its software-driven value propositions and hardware innovation, targeting manufacturing, healthcare, and industrial markets worldwide through strong brand portfolios.
Strategic Collision: Similarities & Divergences
Celestica and Fortive both embed technology deeply but differ in their business philosophies: Celestica focuses on integrated hardware manufacturing and supply chain breadth, while Fortive pursues a software-enabled, product-service hybrid model. Their primary battleground lies in industrial automation and technology infrastructure. Celestica’s scale contrasts with Fortive’s diversified brand strategy, creating distinct risk and growth profiles for investors.
Income Statement Comparison
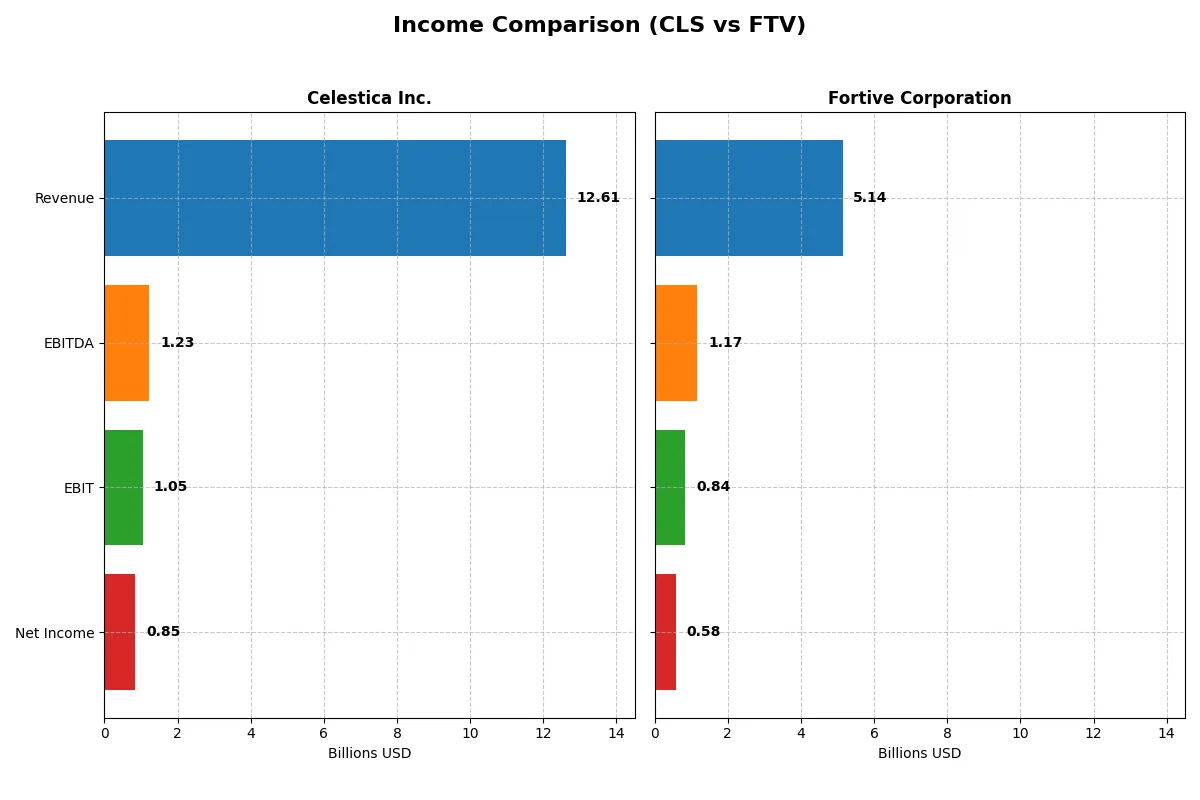
This data dissects the core profitability and scalability of both corporate engines to reveal who dominates the bottom line:
| Metric | Celestica Inc. (CLS) | Fortive Corporation (FTV) |
|---|---|---|
| Revenue | 12.6B | 5.1B |
| Cost of Revenue | 11.1B | 2.0B |
| Operating Expenses | 385M | 2.2B |
| Gross Profit | 1.5B | 3.1B |
| EBITDA | 1.2B | 1.2B |
| EBIT | 1.1B | 843M |
| Interest Expense | 54M | 121M |
| Net Income | 847M | 579M |
| EPS | 7.35 | 1.75 |
| Fiscal Year | 2025 | 2025 |
Income Statement Analysis: The Bottom-Line Duel
This income statement comparison reveals which company runs a more efficient and profitable business engine in 2025.
Celestica Inc. Analysis
Celestica’s revenue surged 31% in 2025 to 12.6B, with net income doubling to 847M, reflecting strong momentum. Its gross margin held steady at 11.7%, while net margin expanded to 6.7%, signaling improving profitability. Operating expenses grew proportionally, supporting efficient scale without margin erosion.
Fortive Corporation Analysis
Fortive posted 5.1B in revenue for 2025, down 17% from 2024, with net income declining 30% to 579M. Despite revenue contraction, its gross margin remains robust at 61%, and net margin stands at 11.3%, indicating strong cost control. However, falling top-line momentum weighs on overall growth prospects.
Verdict: Growth Momentum vs. Margin Strength
Celestica demonstrates superior growth with a 31% revenue increase and rapid net income expansion, though with lower margins. Fortive delivers higher margins but faces declining revenue and earnings. Investors seeking dynamic growth may favor Celestica, while margin-focused profiles might lean toward Fortive’s stable profitability.
Financial Ratios Comparison
These vital ratios act as a diagnostic tool to expose the underlying fiscal health, valuation premiums, and capital efficiency of the companies compared below:
| Ratios | Celestica Inc. (CLS) | Fortive Corporation (FTV) |
|---|---|---|
| ROE | 38.3% | 9.0% |
| ROIC | 28.0% | 7.4% |
| P/E | 40.2 | 30.2 |
| P/B | 15.4 | 2.7 |
| Current Ratio | 1.44 | 0.71 |
| Quick Ratio | 0.88 | 0.58 |
| D/E (Debt/Equity) | 0.35 | 0.50 |
| Debt-to-Assets | 10.8% | 27.3% |
| Interest Coverage | 20.3 | 7.5 |
| Asset Turnover | 1.75 | 0.44 |
| Fixed Asset Turnover | 17.8 | 19.1 |
| Payout Ratio | 0% | 15.9% |
| Dividend Yield | 0% | 0.53% |
| Fiscal Year | 2025 | 2025 |
Efficiency & Valuation Duel: The Vital Signs
Financial ratios act as a company’s DNA, exposing hidden risks and operational strengths crucial for investment decisions.
Celestica Inc.
Celestica delivers a strong ROE of 38.3% and an impressive ROIC at 28%, signaling robust profitability and efficient capital use. However, its P/E of 40.2 and P/B of 15.4 mark the stock as expensive relative to peers. The company pays no dividend, instead reinvesting in R&D to fuel future growth.
Fortive Corporation
Fortive posts a solid net margin of 11.3% and a moderate ROIC of 7.4%, reflecting steady operational returns. The P/E ratio of 30.2, though lower than Celestica, still suggests a stretched valuation. Fortive offers a modest 0.53% dividend yield, balancing shareholder returns with ongoing investment in innovation.
Premium Valuation vs. Operational Safety
Celestica’s superior returns come at a premium valuation, while Fortive offers steadier margins and some income but with weaker profitability metrics. Investors seeking growth might prefer Celestica’s operational efficiency, whereas those favoring income and stability may lean toward Fortive’s profile.
Which one offers the Superior Shareholder Reward?
I observe Celestica Inc. (CLS) pays no dividends, opting to reinvest all free cash flow, which grew to 4.0/share in 2025. Its payout ratio is zero, signaling a growth-focused strategy without buybacks. Fortive Corporation (FTV) yields 0.53%, with a modest 13–16% payout ratio and consistent 0.3/share dividends. FTV also repurchases shares aggressively, enhancing total return through buybacks supported by strong free cash flow of 3.1/share. CLS’s reinvestment promises long-term growth but lacks immediate income. FTV’s balanced dividends and buybacks offer a sustainable, attractive yield plus capital return. In 2026, I find Fortive’s distribution model superior for total shareholder reward, blending income and buyback-driven appreciation effectively.
Comparative Score Analysis: The Strategic Profile
The radar chart reveals the fundamental DNA and trade-offs of Celestica Inc. and Fortive Corporation, highlighting their financial strengths and valuation contrasts:
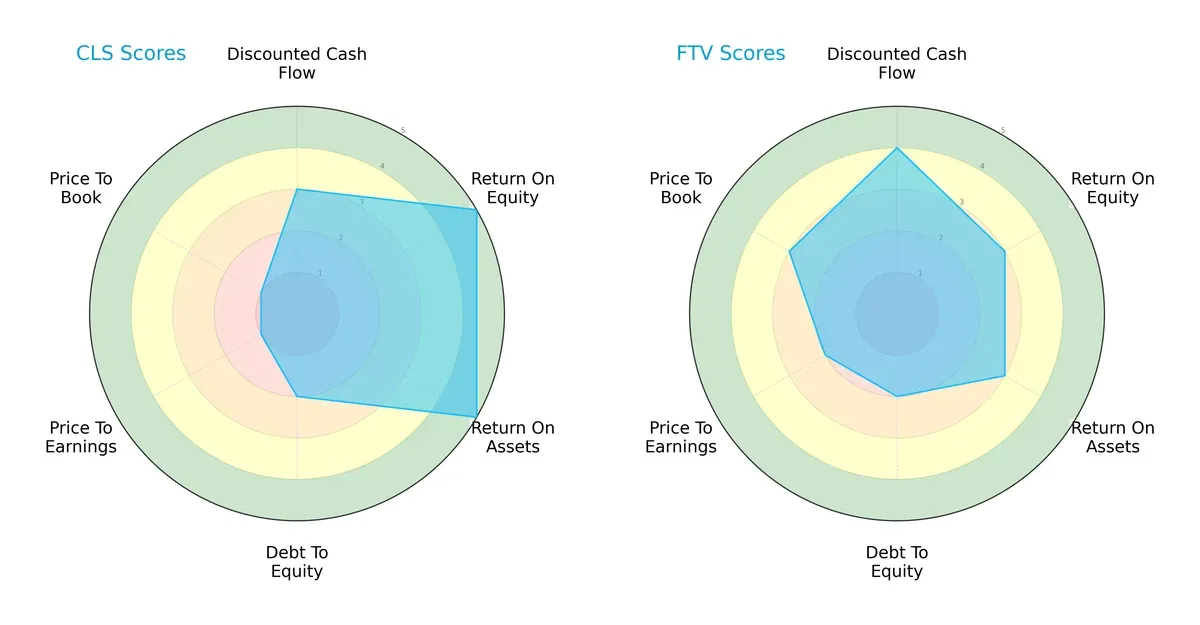
Celestica excels in return on equity and assets (both scores 5), showing operational efficiency. Fortive leads in discounted cash flow (4) and valuation metrics (P/E 2, P/B 3), indicating better market pricing. Both share weak debt-to-equity scores (2), signaling moderate leverage risks. Celestica has a more concentrated edge in profitability, while Fortive offers a balanced profile with valuation appeal.
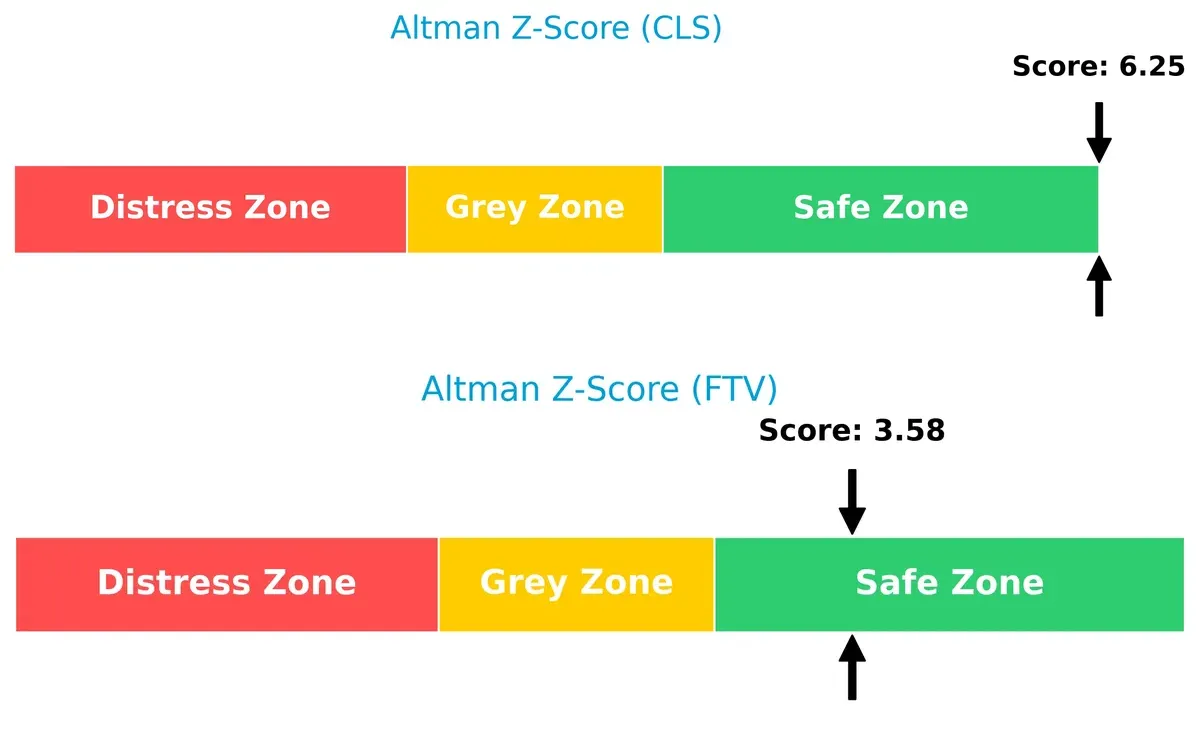
Bankruptcy Risk: Solvency Showdown
Celestica’s Altman Z-Score of 6.25 significantly surpasses Fortive’s 3.58, both in the safe zone, underscoring Celestica’s superior long-term solvency resilience in this economic cycle:
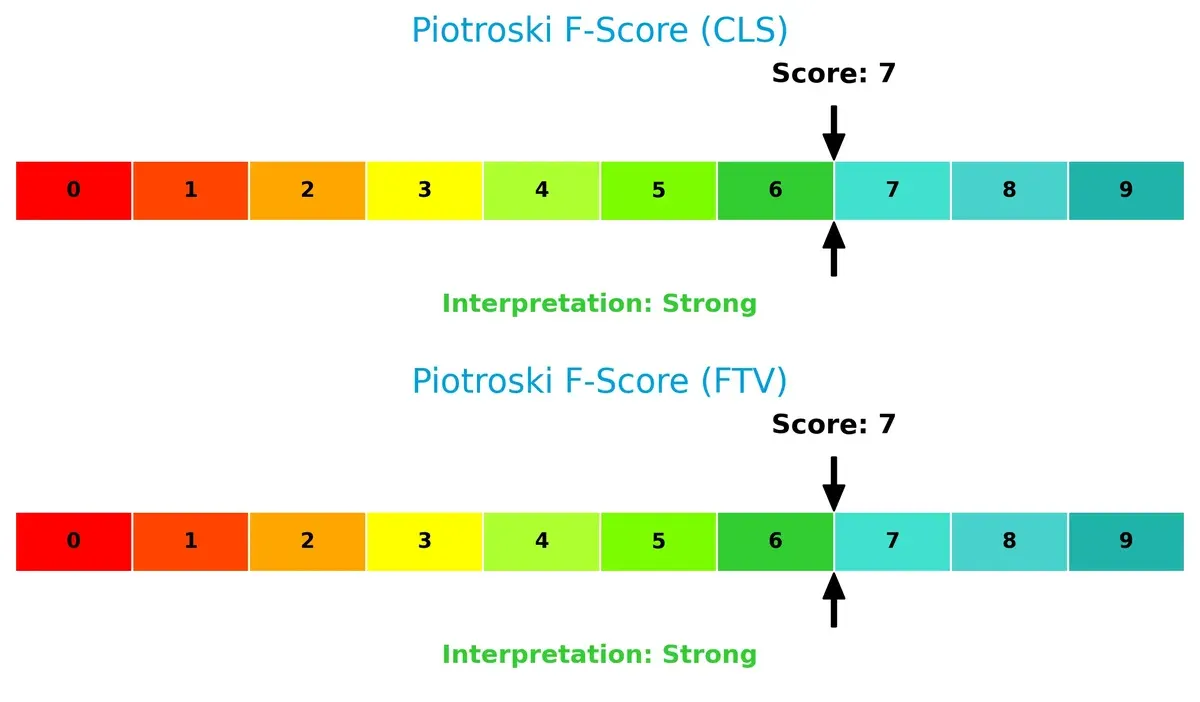
Financial Health: Quality of Operations
Both companies score a strong 7 on the Piotroski F-Score, indicating robust financial health without red flags. Their internal operations, profitability, and efficiency metrics appear solid and comparable:
How are the two companies positioned?
This section dissects the operational DNA of Celestica and Fortive by comparing their revenue distribution and internal dynamics. The goal is to confront their economic moats to reveal which model offers a more resilient, sustainable competitive advantage today.
Revenue Segmentation: The Strategic Mix
The following visual comparison dissects how Celestica Inc. and Fortive Corporation diversify their income streams and where their primary sector bets lie:
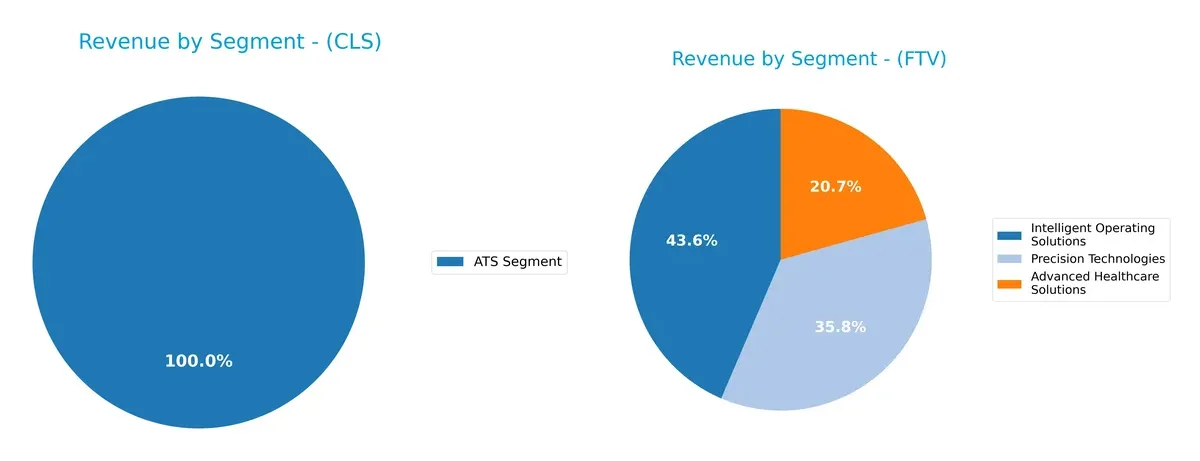
Celestica relies solely on its ATS Segment, generating $3.16B, anchoring its revenue in a single line. Fortive, by contrast, spreads $6.23B across three robust segments: Intelligent Operating Solutions ($2.71B), Precision Technologies ($2.23B), and Advanced Healthcare Solutions ($1.29B). This diversification reduces Fortive’s concentration risk and signals strategic bets on healthcare innovation and industrial tech, while Celestica’s focus suggests higher exposure but potential ecosystem lock-in.
Strengths and Weaknesses Comparison
This table compares the strengths and weaknesses of Celestica Inc. and Fortive Corporation based on diversification, profitability, financials, innovation, global presence, and market share:
Celestica Inc. Strengths
- Favorable ROE and ROIC indicate strong capital efficiency
- Low debt-to-assets ratio shows conservative leverage
- High asset turnover reflects effective use of assets
- Broad product segment focus supports stability
Fortive Corporation Strengths
- Diversified revenue streams across three distinct segments
- Favorable net margin and WACC suggest efficient operations
- Strong fixed asset turnover signals productive investments
- Significant global presence with large US and China sales
Celestica Inc. Weaknesses
- High PE and PB ratios imply rich valuation
- Neutral current and quick ratios hint at liquidity constraints
- Unfavorable WACC could pressure returns
- No dividend yield may deter income investors
Fortive Corporation Weaknesses
- Unfavorable current and quick ratios raise liquidity concerns
- Lower ROE and ROIC challenge profitability
- Unfavorable asset turnover suggests less efficient asset use
- Low dividend yield may limit appeal for yield investors
Celestica’s strengths lie in capital efficiency and conservative leverage but face valuation and liquidity headwinds. Fortive shows strong diversification and operational margins but struggles with liquidity and asset utilization, shaping distinct strategic priorities.
The Moat Duel: Analyzing Competitive Defensibility
A structural moat is the only reliable shield against competition eroding long-term profits. Let’s examine how each company defends its economic turf:
Celestica Inc.: Operational Excellence and Value Creation
Celestica’s moat stems from efficient capital allocation and supply chain integration, driving a ROIC well above WACC by 17.3%. Its income growth and margin expansion signal a strong, sustainable advantage deepening in 2026.
Fortive Corporation: Brand and Product Diversification
Fortive relies on diversified professional tools and software brands. Despite margin strength, its ROIC lags slightly below WACC, indicating value erosion. However, steady ROIC growth hints at potential recovery from recent revenue setbacks.
Verdict: Capital Efficiency vs. Brand Breadth
Celestica’s wider moat emerges from superior capital returns and expanding profitability. Fortive’s brand portfolio offers scope but currently lacks the financial muscle to defend market share as robustly as Celestica.
Which stock offers better returns?
Over the past 12 months, Celestica Inc. surged with strong gains despite decelerating momentum, while Fortive Corporation struggled amid accelerating losses but showed recent recovery signs. Trading volumes rose for both.
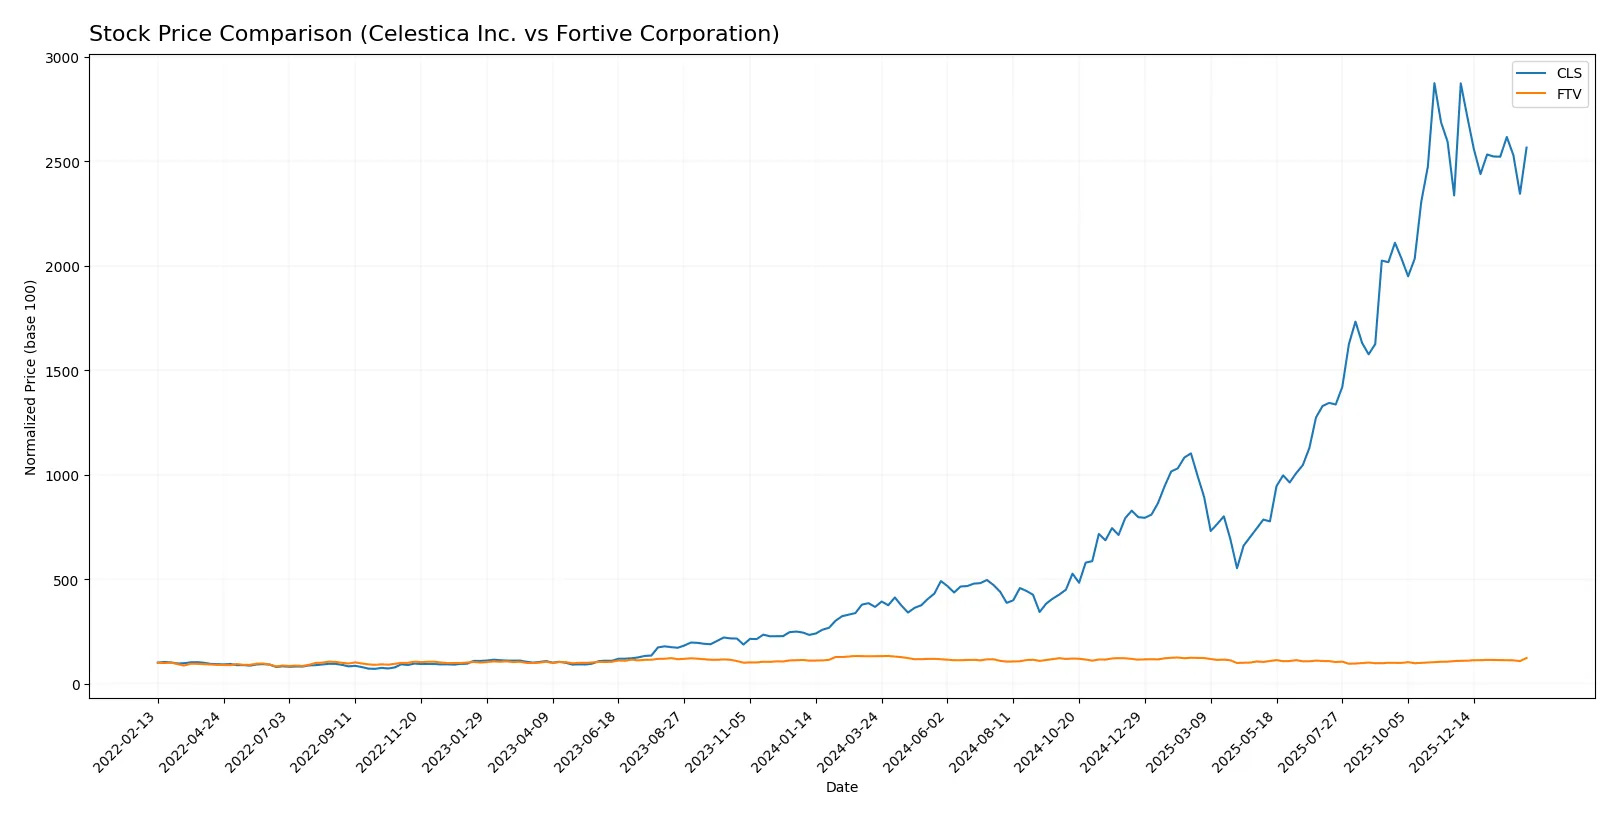
Trend Comparison
Celestica Inc. posted a 599.41% price increase over the last year, marking a clear bullish trend with decelerating momentum and high volatility, peaking at 344.48 and bottoming at 40.73.
Fortive Corporation experienced a 6.53% decline, reflecting a bearish trend with accelerating losses and low volatility; however, recent months showed a 13.82% rebound with a slight positive slope.
Celestica’s substantial overall gains outperformed Fortive’s losses, making it the top performer in market returns during this period.
Target Prices
Analysts present a clear target consensus for Celestica Inc. and Fortive Corporation.
| Company | Target Low | Target High | Consensus |
|---|---|---|---|
| Celestica Inc. | 300 | 440 | 365.6 |
| Fortive Corporation | 51 | 70 | 59.83 |
Celestica’s target consensus at 365.6 exceeds its current 307.53 price, signaling upside potential. Fortive’s consensus of 59.83 aligns closely with its 60.12 market price, indicating stable expectations.

Don’t Let Luck Decide Your Entry Point
Optimize your entry points with our advanced ProRealTime indicators. You’ll get efficient buy signals with precise price targets for maximum performance. Start outperforming now!
How do institutions grade them?
Celestica Inc. Grades
These are the latest institutional grades for Celestica Inc. from top financial firms:
| Grading Company | Action | New Grade | Date |
|---|---|---|---|
| Citigroup | Maintain | Buy | 2026-01-30 |
| Barclays | Maintain | Overweight | 2026-01-30 |
| Goldman Sachs | Maintain | Buy | 2025-12-01 |
| Barclays | Maintain | Overweight | 2025-11-14 |
| Citigroup | Upgrade | Buy | 2025-11-10 |
| Goldman Sachs | Maintain | Buy | 2025-10-29 |
| Barclays | Maintain | Overweight | 2025-10-29 |
| UBS | Maintain | Neutral | 2025-10-29 |
| CIBC | Maintain | Outperform | 2025-10-29 |
| JP Morgan | Maintain | Overweight | 2025-10-29 |
Fortive Corporation Grades
Below are the recent grades from recognized institutions for Fortive Corporation:
| Grading Company | Action | New Grade | Date |
|---|---|---|---|
| Wells Fargo | Maintain | Equal Weight | 2026-02-05 |
| RBC Capital | Maintain | Sector Perform | 2026-02-05 |
| Citigroup | Maintain | Neutral | 2026-02-05 |
| JP Morgan | Downgrade | Underweight | 2026-01-16 |
| Mizuho | Downgrade | Underperform | 2026-01-05 |
| Wells Fargo | Maintain | Equal Weight | 2025-12-22 |
| Citigroup | Maintain | Neutral | 2025-12-08 |
| Morgan Stanley | Maintain | Equal Weight | 2025-11-05 |
| Baird | Maintain | Outperform | 2025-11-04 |
| JP Morgan | Maintain | Neutral | 2025-10-30 |
Which company has the best grades?
Celestica Inc. consistently receives strong buy and overweight ratings, signaling institutional confidence. Fortive Corporation’s grades cluster around equal weight and neutral, with recent downgrades. Investors may view Celestica’s superior grades as a sign of stronger market endorsement and potential relative strength.
Risks specific to each company
In 2026’s volatile market, these categories pinpoint critical pressure points and systemic threats both Celestica Inc. and Fortive Corporation face:
1. Market & Competition
Celestica Inc.
- Faces intense competition in hardware solutions with rapid tech innovation pressures.
Fortive Corporation
- Competes in diversified engineered products with steady demand but exposed to niche market shifts.
2. Capital Structure & Debt
Celestica Inc.
- Low debt-to-equity (0.35) supports financial stability; strong interest coverage at 19.7x.
Fortive Corporation
- Higher debt-to-equity (0.5) signals more leverage; interest coverage of 7x is adequate but riskier.
3. Stock Volatility
Celestica Inc.
- Beta of 1.505 indicates higher volatility and sensitivity to market swings.
Fortive Corporation
- Beta of 1.033 shows moderate volatility, closer to market average.
4. Regulatory & Legal
Celestica Inc.
- Exposure to complex international compliance, especially in aerospace and defense sectors.
Fortive Corporation
- Faces regulatory scrutiny in healthcare and industrial safety markets; compliance costs can rise.
5. Supply Chain & Operations
Celestica Inc.
- Operates global supply chains with risks from geopolitical tensions and component shortages.
Fortive Corporation
- Relies on specialized manufacturing and software delivery; susceptible to tech disruptions.
6. ESG & Climate Transition
Celestica Inc.
- Pressured to enhance sustainability in energy products and supply chain transparency.
Fortive Corporation
- ESG focus on industrial safety and healthcare aligns with evolving regulatory and consumer demands.
7. Geopolitical Exposure
Celestica Inc.
- Significant presence in North America, Europe, and Asia increases geopolitical risk.
Fortive Corporation
- Primarily US-based but with global customers, facing moderate geopolitical headwinds.
Which company shows a better risk-adjusted profile?
Celestica’s key risk lies in stock volatility and valuation stretched by a high P/E and P/B ratio. Fortive’s greatest vulnerability is its weaker liquidity ratios and higher leverage. Despite this, Celestica’s higher beta and overvaluation expose it to greater market risk. Fortive’s stable beta and moderate valuation provide a more balanced risk-return profile in 2026. Recent data show Celestica’s beta at 1.505 versus Fortive’s 1.033, justifying my concern over Celestica’s market sensitivity.
Final Verdict: Which stock to choose?
Celestica Inc. (CLS) wields a powerful advantage in capital efficiency, delivering a very favorable ROIC well above its cost of capital. Its sharp earnings growth signals a robust value creator. However, its high valuation multiples present a point of vigilance for risk-sensitive investors. CLS suits aggressive growth portfolios willing to pay for premium performance.
Fortive Corporation (FTV) offers a strategic moat through strong recurring revenue streams and resilience in cash flow generation. While its recent earnings growth has slowed, FTV provides better balance sheet stability than CLS and operates with a more conservative capital structure. This profile aligns with GARP investors seeking steady growth at a reasonable price.
If you prioritize dynamic value creation and can tolerate high multiple risk, CLS outshines due to its superior profitability and growth trajectory. However, if you seek better stability with a durable business model and moderate growth, FTV offers a safer analytical scenario despite its current earnings headwinds. Each fits distinct investor appetites shaped by risk tolerance and growth expectations.
Disclaimer: Investment carries a risk of loss of initial capital. The past performance is not a reliable indicator of future results. Be sure to understand risks before making an investment decision.
Go Further
I encourage you to read the complete analyses of Celestica Inc. and Fortive Corporation to enhance your investment decisions: