Home > Comparison > Technology > CLS vs FN
The strategic rivalry between Celestica Inc. and Fabrinet shapes the future of the Technology sector’s hardware manufacturing landscape. Celestica operates as a capital-intensive supply chain and platform solutions provider, while Fabrinet excels in precision optical and electro-mechanical manufacturing services. This head-to-head highlights a contrast between broad, integrated supply chain capabilities and specialized manufacturing expertise. This analysis aims to identify which model delivers superior risk-adjusted returns for a diversified portfolio.

Table of contents
Companies Overview
Celestica and Fabrinet stand as key players in the global hardware and equipment sector, shaping supply chain and manufacturing dynamics.
Celestica Inc.: Global Hardware and Supply Chain Solutions Leader
Celestica dominates in hardware platform and supply chain services across North America, Europe, and Asia. It generates revenue by offering design, engineering, manufacturing, logistics, and after-market services primarily for aerospace, defense, healthtech, and cloud providers. In 2026, Celestica focuses on expanding its Advanced Technology and Connectivity & Cloud Solutions segments to drive innovation and capture hyperscaler demand.
Fabrinet: Precision Optical and Electro-Mechanical Manufacturing Specialist
Fabrinet excels in optical packaging and precision manufacturing targeting North America, Asia-Pacific, and Europe. Its revenue stems from manufacturing complex optical components, tunable lasers, and sensors used in communications, medical, and automotive sectors. For 2026, Fabrinet emphasizes enhancing its advanced process design and integration capabilities to support high-speed data and industrial laser markets.
Strategic Collision: Similarities & Divergences
Both companies thrive on sophisticated manufacturing but diverge philosophically: Celestica pursues a broad, integrated supply chain model, while Fabrinet concentrates on niche optical precision. Their battle for market share unfolds in high-tech hardware components for communications and industrial applications. Celestica offers a diversified portfolio with scale, whereas Fabrinet delivers specialized craftsmanship, defining distinct risk and growth profiles.
Income Statement Comparison
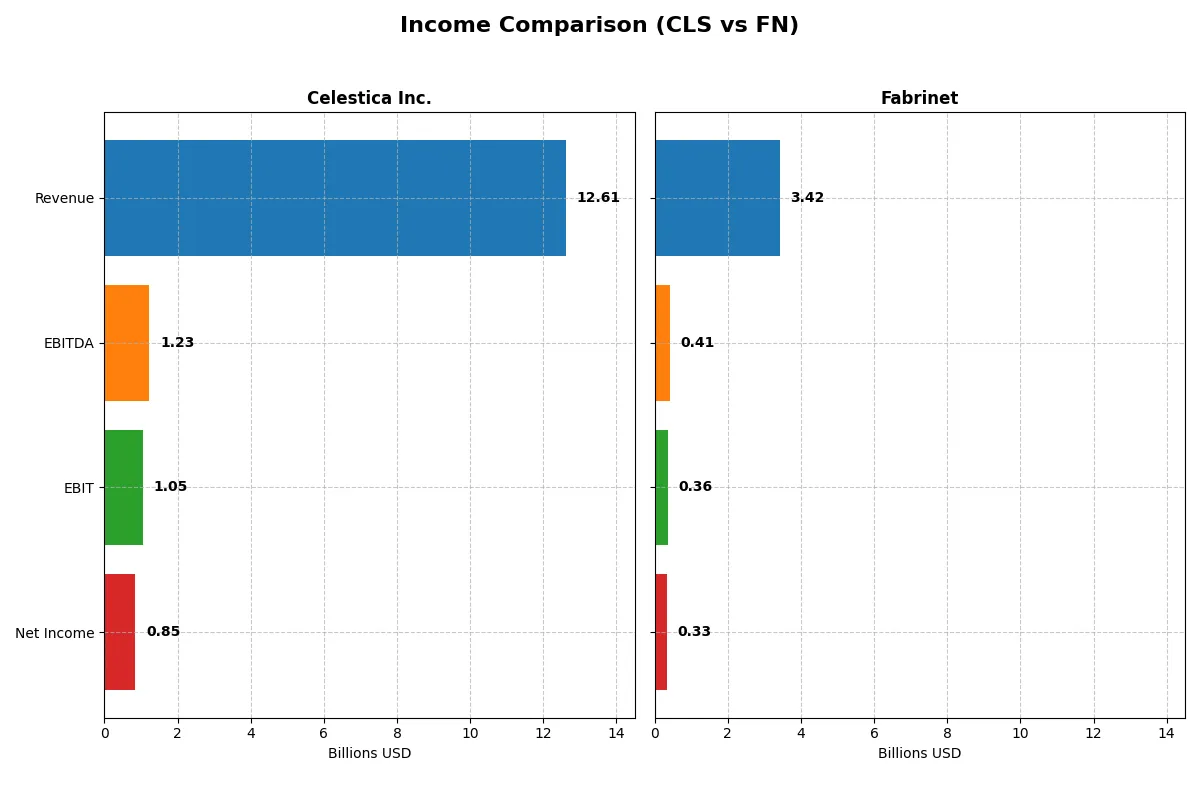
This data dissects the core profitability and scalability of both corporate engines to reveal who dominates the bottom line:
| Metric | Celestica Inc. (CLS) | Fabrinet (FN) |
|---|---|---|
| Revenue | 12.6B | 3.42B |
| Cost of Revenue | 11.1B | 3.01B |
| Operating Expenses | 385M | 89M |
| Gross Profit | 1.47B | 413M |
| EBITDA | 1.23B | 409M |
| EBIT | 1.05B | 355M |
| Interest Expense | 54M | 0 |
| Net Income | 847M | 333M |
| EPS | 7.22 | 9.23 |
| Fiscal Year | 2025 | 2025 |
Income Statement Analysis: The Bottom-Line Duel
Comparing income statements reveals which company delivers stronger operational efficiency and profit conversion in a competitive landscape.
Celestica Inc. Analysis
Celestica’s revenue surged from 5.6B in 2021 to 12.6B in 2025, more than doubling. Its net income exploded from 104M to 847M, reflecting robust margin expansion. Gross margin steadied near 11.7%, while net margin improved to 6.7%, signaling efficient cost control and accelerating profitability in 2025.
Fabrinet Analysis
Fabrinet’s revenue climbed from 1.9B in 2021 to 3.4B in 2025, showing solid growth but slower than Celestica. Its net income grew from 148M to 333M, with a slightly healthier net margin of 9.7%. Fabrinet sustains stronger EBIT margins around 10.4%, indicating better core operating efficiency despite modest net margin contraction in 2025.
Margin Expansion vs. Revenue Acceleration
Celestica dominates with explosive revenue and net income growth, backed by favorable margin improvements. Fabrinet boasts superior EBIT and net margins but grows more moderately. Investors favor Celestica’s aggressive scale and margin momentum for growth, while Fabrinet appeals as a steadier, more efficient profit generator.
Financial Ratios Comparison
These vital ratios act as a diagnostic tool to expose the underlying fiscal health, valuation premiums, and capital efficiency of the companies compared below:
| Ratios | Celestica Inc. (CLS) | Fabrinet (FN) |
|---|---|---|
| ROE | 22.57% | 16.78% |
| ROIC | 16.10% | 15.01% |
| P/E | 25.47 | 32.02 |
| P/B | 5.75 | 5.37 |
| Current Ratio | 1.49 | 3.61 |
| Quick Ratio | 0.91 | 2.78 |
| D/E | 0.42 | 0.003 |
| Debt-to-Assets | 13.30% | 0.19% |
| Interest Coverage | 11.50 | N/A |
| Asset Turnover | 1.61 | 1.23 |
| Fixed Asset Turnover | 14.58 | 9.22 |
| Payout ratio | 0 | 0 |
| Dividend yield | 0 | 0 |
| Fiscal Year | 2024 | 2025 |
Efficiency & Valuation Duel: The Vital Signs
Financial ratios act as the company’s DNA, exposing hidden risks and operational strengths that guide investment decisions clearly.
Celestica Inc.
Celestica posts a strong ROE of 22.57%, signaling efficient use of equity, but struggles with a low net margin of 4.44%. Its P/E ratio at 25.47 suggests the stock is stretched relative to earnings. Shareholders receive no dividends, indicating reinvestment likely targets growth or R&D, though this is not explicitly clear.
Fabrinet
Fabrinet delivers a solid ROE of 16.78% and a healthier net margin of 9.72%, reflecting operational efficiency. However, its P/E ratio at 32.02 marks the stock as expensive compared to peers. It pays no dividends, suggesting reinvestment in business expansion or innovation, supported by a robust balance sheet with low debt.
Premium Valuation vs. Operational Safety
Fabrinet shows a more favorable ratio profile with stronger margins and a safer balance sheet, despite higher valuation multiples. Celestica offers better equity returns but bears risks in profitability and valuation. Investors prioritizing operational safety may lean toward Fabrinet; those seeking higher ROE might consider Celestica’s profile.
Which one offers the Superior Shareholder Reward?
Celestica Inc. (CLS) and Fabrinet (FN) both forego dividends, emphasizing reinvestment and buybacks. CLS shows no dividend yield and zero payout ratio, focusing on moderate buybacks with free cash flow at 2.57/share. FN also pays no dividends but allocates substantial free cash flow (5.73/share) to aggressive buybacks, supported by a robust operating cash flow ratio (~0.74 in 2024). FN’s buyback intensity and stronger margins (net margin ~10%) offer a more sustainable and attractive total return profile than CLS, which operates with thinner margins (~4.4%) and higher financial leverage. I conclude FN provides superior shareholder reward in 2026.
Comparative Score Analysis: The Strategic Profile
The radar chart reveals the fundamental DNA and trade-offs of Celestica Inc. and Fabrinet, highlighting their financial strengths and valuation nuances:
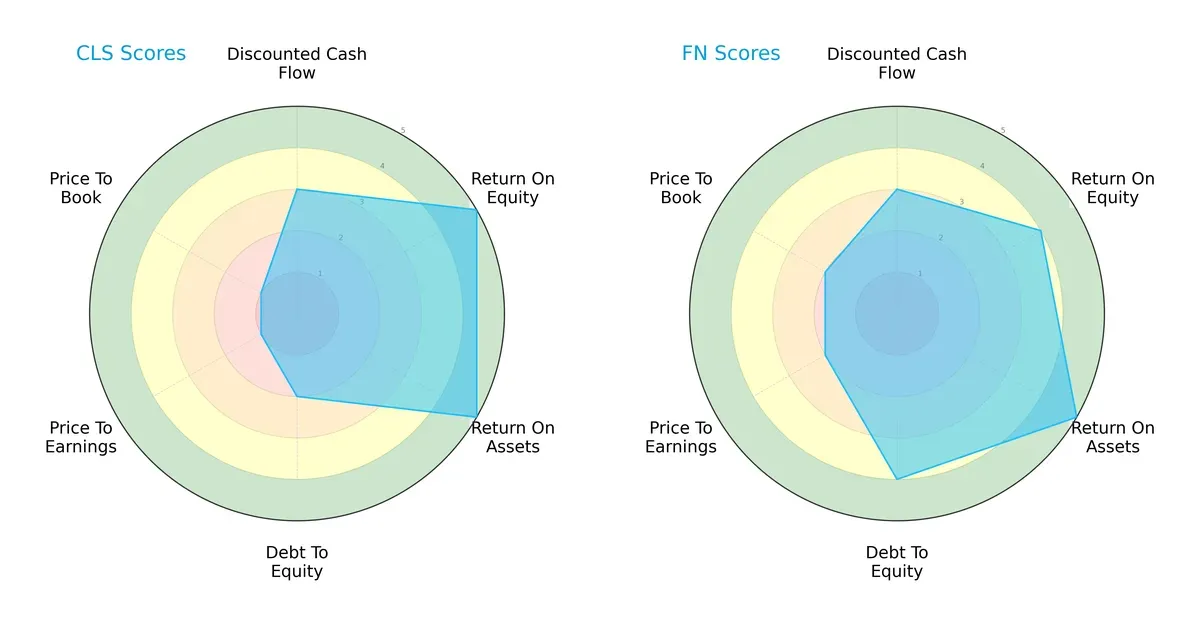
Celestica excels in profitability with top ROE and ROA scores but struggles on valuation metrics, scoring very low on P/E and P/B. Fabrinet presents a more balanced profile with solid debt management and moderate valuation scores. Fabrinet’s broader strength across leverage and valuation suggests a steadier risk-return trade-off, while Celestica relies heavily on operational efficiency.
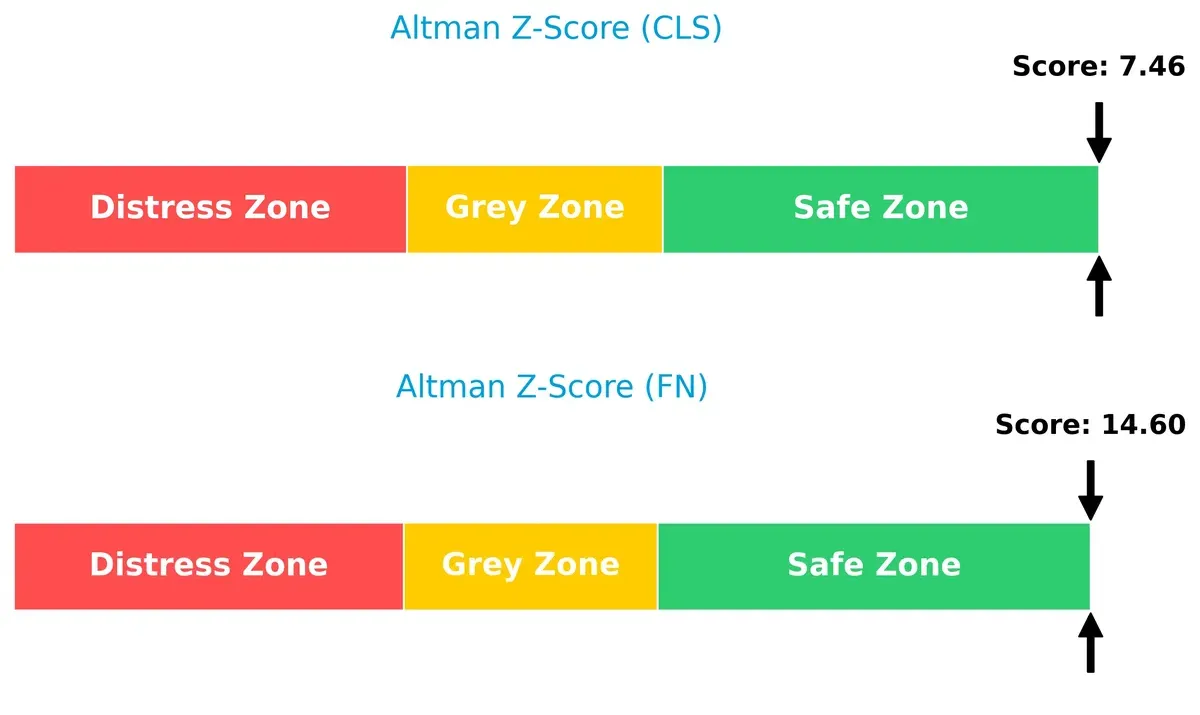
Bankruptcy Risk: Solvency Showdown
Fabrinet’s Altman Z-Score (14.6) far exceeds Celestica’s (7.5), placing both comfortably in the safe zone but signaling Fabrinet’s stronger solvency and lower bankruptcy risk in this cycle:
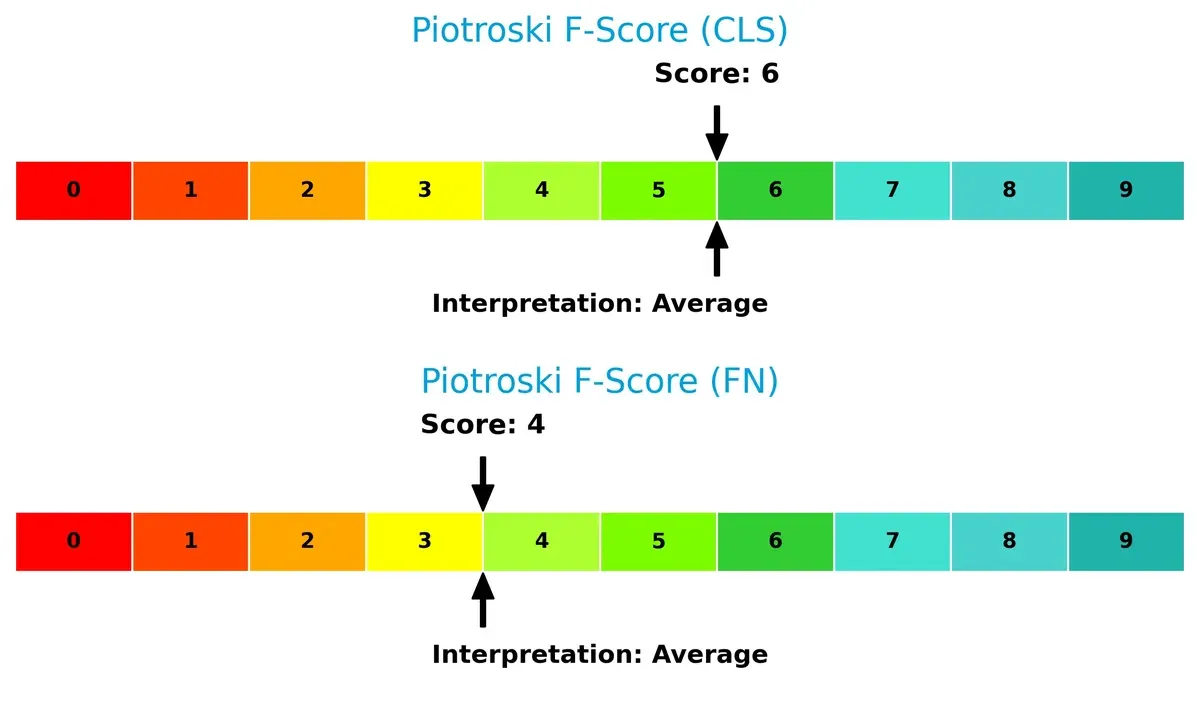
Financial Health: Quality of Operations
Celestica leads with a Piotroski F-Score of 6 versus Fabrinet’s 4, indicating better operational quality and fewer red flags in internal financial metrics:
How are the two companies positioned?
This section dissects Celestica’s and Fabrinet’s operational DNA by comparing revenue distribution and internal strengths and weaknesses. The goal is to confront their economic moats and identify which model offers the most resilient, sustainable competitive advantage today.
Revenue Segmentation: The Strategic Mix
This comparison dissects how Celestica Inc. and Fabrinet diversify their income streams and reveals their primary sector bets:
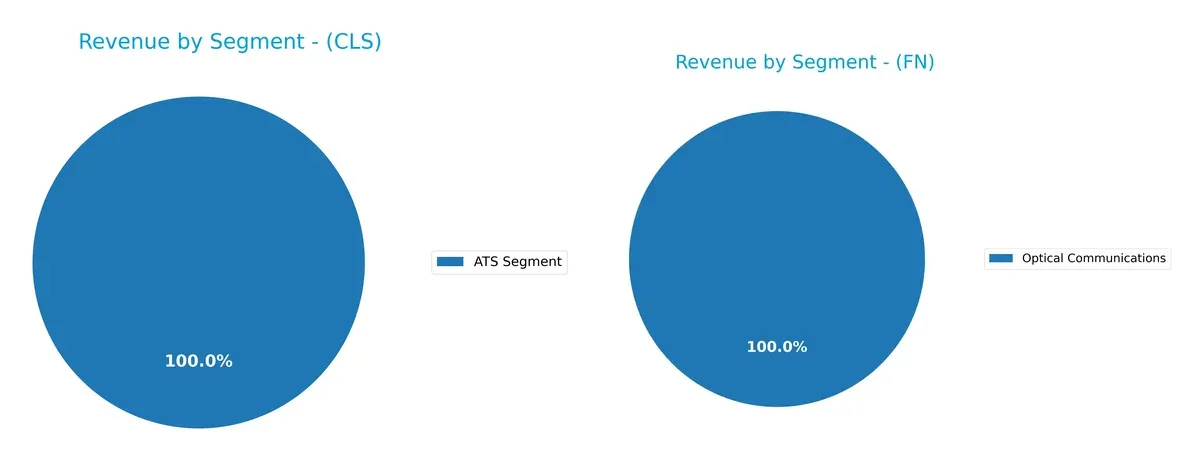
Celestica anchors its revenue solely in the ATS segment with $3.16B, showing high concentration risk. Fabrinet displays more diversification with Optical Communications at $2.62B and an additional $637M from Lasers, Sensors, and Other segments in 2023. Fabrinet’s mix reduces dependency on a single market, supporting resilience. Celestica’s focus suggests infrastructure dominance but exposes it to sector-specific volatility.
Strengths and Weaknesses Comparison
This table compares the Strengths and Weaknesses of Celestica Inc. and Fabrinet:
Celestica Inc. Strengths
- Favorable ROE at 22.57%
- Low debt-to-equity of 0.42
- Strong asset turnover of 1.61
- High fixed asset turnover at 14.58
- Slightly favorable overall financial ratios
Fabrinet Strengths
- Favorable ROE and ROIC at 16.78% and 15.01%
- Zero debt level
- Very high interest coverage
- Strong current ratio of 3.0
- Favorable overall financial ratios
Celestica Inc. Weaknesses
- Low net margin at 4.44%
- Unfavorable P/E of 25.47
- Unfavorable P/B of 5.75
- Zero dividend yield
- Neutral liquidity ratios
Fabrinet Weaknesses
- Unfavorable P/E of 32.02
- Unfavorable P/B of 5.37
- Zero dividend yield
- Moderate net margin of 9.72% (neutral)
Celestica shows solid operational efficiency and conservative leverage but struggles with profitability margins and valuation metrics. Fabrinet benefits from a strong balance sheet and profitability but faces valuation pressure and lacks dividend income. Each company’s financial profile suggests a focus on efficiency and growth over shareholder yield.
The Moat Duel: Analyzing Competitive Defensibility
Structural moats are the only shields protecting long-term profits from relentless competition erosion. Let’s dissect how Celestica and Fabrinet defend their turf:
Celestica Inc.: Efficient Supply Chain & Engineering Expertise
Celestica’s moat hinges on supply chain mastery and engineering breadth. I see this reflected in its robust revenue growth of 124% over five years and near-doubling EPS. Its expanding ROIC trend signals effective capital use. New markets in cloud and aerospace could widen its moat further in 2026.
Fabrinet: Precision Optical Manufacturing with Scale Advantage
Fabrinet leverages precision optical manufacturing and advanced packaging as its moat, contrasting Celestica’s broader service scope. Its ROIC exceeds WACC by 6.3%, confirming value creation. Despite slower growth, Fabrinet’s specialized tech and geographic diversification position it well to deepen its moat amid optical network demand.
Verdict: Scale & Engineering Depth vs. Specialized Optical Precision
Celestica’s wider moat stems from rapid growth and capital efficiency, but Fabrinet’s deeper moat derives from durable value creation and niche expertise. I judge Fabrinet better equipped to defend its market share through technology and operational focus in 2026.
Which stock offers better returns?
Over the past year, Celestica Inc. and Fabrinet showed strong price movements with contrasting recent trading dynamics, highlighting shifts in momentum and investor sentiment.
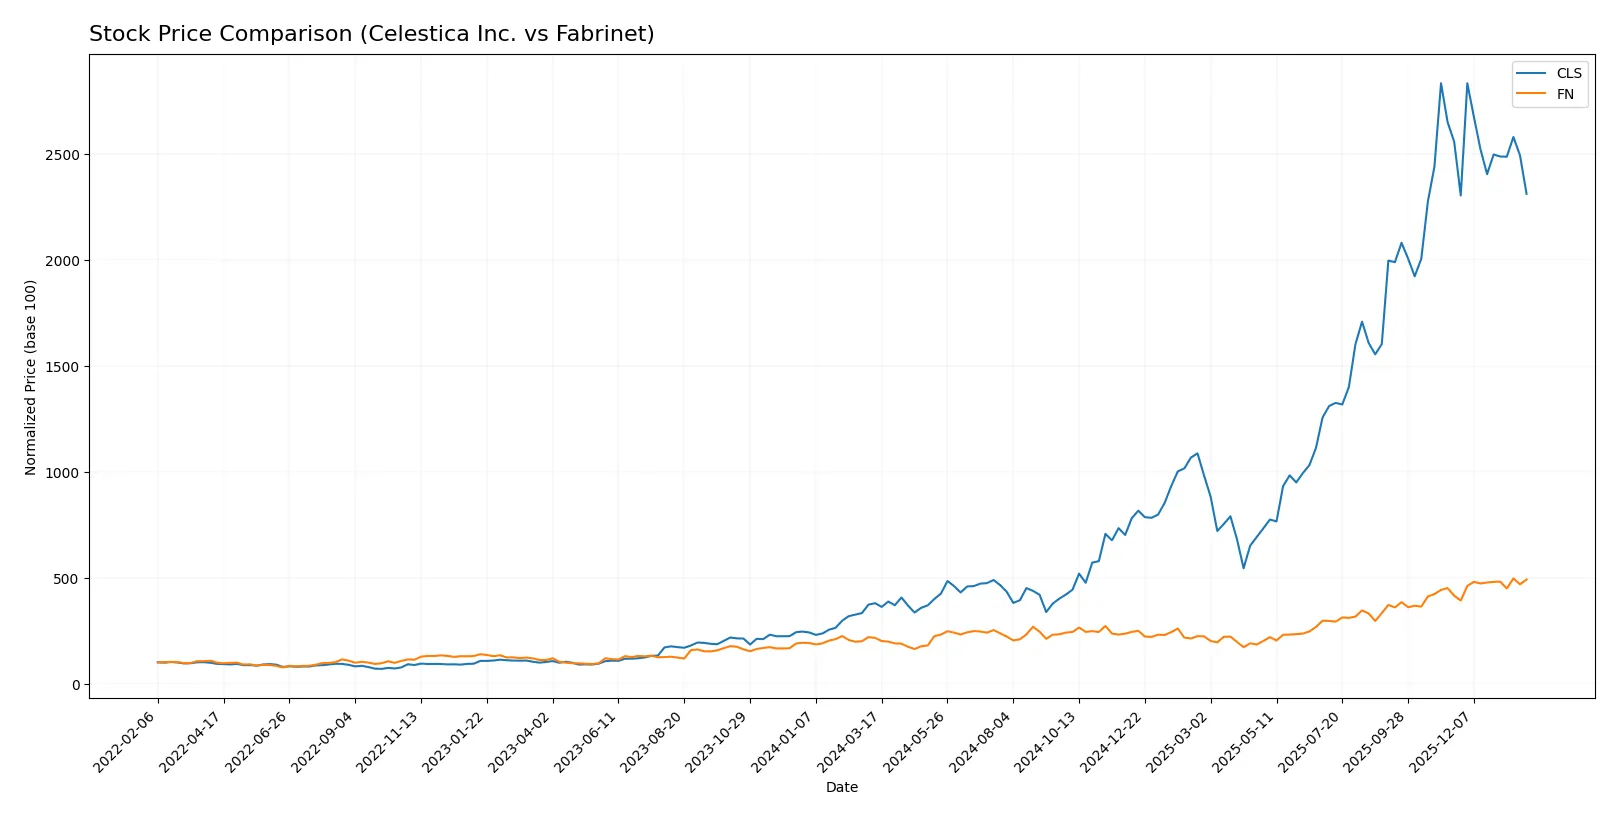
Trend Comparison
Celestica Inc. posted a 510% gain over 12 months, marking a bullish trend with decelerating momentum from a 344.48 high to a recent slight pullback. Fabrinet gained 128%, also bullish with accelerating momentum and a high near 494.45, showing strength in recent months. Comparing both, Celestica delivered superior overall returns, despite its recent moderate decline, outperforming Fabrinet’s steady acceleration.
Target Prices
Analysts project strong upside potential for both Celestica Inc. and Fabrinet based on current consensus targets.
| Company | Target Low | Target High | Consensus |
|---|---|---|---|
| Celestica Inc. | 300 | 440 | 365.6 |
| Fabrinet | 537 | 600 | 569 |
Celestica’s consensus target of 365.6 suggests about 30% upside from the 280.99 current price. Fabrinet’s 569 target implies a roughly 16% gain from its 489.44 trading level.

Don’t Let Luck Decide Your Entry Point
Optimize your entry points with our advanced ProRealTime indicators. You’ll get efficient buy signals with precise price targets for maximum performance. Start outperforming now!
How do institutions grade them?
Celestica Inc. Grades
The recent grades from leading firms for Celestica Inc. are as follows:
| Grading Company | Action | New Grade | Date |
|---|---|---|---|
| Citigroup | Maintain | Buy | 2026-01-30 |
| Barclays | Maintain | Overweight | 2026-01-30 |
| Goldman Sachs | Maintain | Buy | 2025-12-01 |
| Barclays | Maintain | Overweight | 2025-11-14 |
| Citigroup | Upgrade | Buy | 2025-11-10 |
Fabrinet Grades
Below are the latest institutional grades for Fabrinet:
| Grading Company | Action | New Grade | Date |
|---|---|---|---|
| Susquehanna | Maintain | Positive | 2026-01-22 |
| Barclays | Upgrade | Overweight | 2026-01-14 |
| Barclays | Maintain | Equal Weight | 2025-11-05 |
| JP Morgan | Maintain | Overweight | 2025-11-04 |
| Needham | Maintain | Buy | 2025-11-04 |
Which company has the best grades?
Celestica consistently earns Buy and Overweight ratings from major banks, reflecting solid institutional confidence. Fabrinet shows more mixed ratings, including Positive and Overweight, signaling cautious optimism. Investors may perceive Celestica as having stronger consensus support.
Risks specific to each company
The following categories identify critical pressure points and systemic threats facing Celestica Inc. and Fabrinet in the 2026 market environment:
1. Market & Competition
Celestica Inc.
- Faces intense competition in hardware and supply chain solutions; net margin low at 4.44% signals margin pressure.
Fabrinet
- Operates in niche optical manufacturing with stronger net margin at 9.72%, but higher P/E of 32.0 suggests growth expectations risk.
2. Capital Structure & Debt
Celestica Inc.
- Moderate leverage with D/E of 0.42; interest coverage strong at 19.7x, indicating manageable debt risk.
Fabrinet
- Virtually no debt (D/E 0.0), offering financial flexibility and low default risk; interest coverage effectively infinite.
3. Stock Volatility
Celestica Inc.
- Beta of 1.46 indicates above-market volatility, increasing risk in turbulent markets.
Fabrinet
- Beta near 1.04 reflects market-level volatility, implying relatively stable stock behavior.
4. Regulatory & Legal
Celestica Inc.
- Global operations across diverse sectors expose it to complex regulatory environments and compliance costs.
Fabrinet
- Concentrated in optical and electro-mechanical manufacturing; regulatory risks exist but less diversified impact.
5. Supply Chain & Operations
Celestica Inc.
- Complex supply chain spans North America, Europe, Asia; exposure to geopolitical and logistics disruptions is significant.
Fabrinet
- Also globally diversified; precision manufacturing processes sensitive to raw material availability and operational disruptions.
6. ESG & Climate Transition
Celestica Inc.
- Increasing pressure to reduce carbon footprint across hardware manufacturing; ESG integration critical for client retention.
Fabrinet
- Faces similar ESG pressures, especially in energy-intensive manufacturing; must innovate to meet climate transition demands.
7. Geopolitical Exposure
Celestica Inc.
- Operations in multiple continents expose it to geopolitical tensions, trade restrictions, and tariffs.
Fabrinet
- Headquartered in Cayman Islands with major operations in Asia and North America; geopolitical risks moderate but non-negligible.
Which company shows a better risk-adjusted profile?
Celestica’s highest risk is its elevated stock volatility and margin pressure amid fierce competition. Fabrinet’s primary risk lies in valuation stretched by high P/E and dependency on niche optical markets. Fabrinet’s low debt, stable liquidity, and lower volatility give it a superior risk-adjusted profile. Its recent Altman Z-Score of 14.6 versus Celestica’s 7.5 confirms stronger financial safety.
Final Verdict: Which stock to choose?
Celestica Inc. (CLS) shines as a growth engine fueled by rapidly expanding profitability and operational efficiency. Its superpower lies in accelerating returns on equity and assets, signaling improving capital allocation. A point of vigilance is its stretched valuation multiples, which may temper near-term upside. CLS suits aggressive growth portfolios seeking dynamic turnaround stories.
Fabrinet (FN) boasts a durable competitive moat supported by consistent ROIC above WACC and strong balance sheet health. Its strategic advantage stems from stable recurring revenues and robust cash conversion cycles. FN offers a safer profile than CLS, with steadier profitability, fitting well within GARP portfolios that balance growth and valuation discipline.
If you prioritize high-growth potential with improving profitability metrics, CLS emerges as the compelling choice due to its accelerating operational returns. However, if you seek superior stability and a durable moat with less valuation risk, FN offers better downside protection and consistent value creation. Both represent strong but distinct analytical scenarios tailored to differing risk appetites.
Disclaimer: Investment carries a risk of loss of initial capital. The past performance is not a reliable indicator of future results. Be sure to understand risks before making an investment decision.
Go Further
I encourage you to read the complete analyses of Celestica Inc. and Fabrinet to enhance your investment decisions: