Home > Comparison > Technology > GLW vs CLS
The strategic rivalry between Corning Incorporated and Celestica Inc. shapes the evolution of the technology hardware sector. Corning operates as a diversified manufacturer specializing in advanced glass and optical products, while Celestica focuses on comprehensive hardware platform and supply chain solutions. This head-to-head contrasts a materials innovation leader against a supply chain integrator. This analysis will identify which business model delivers superior risk-adjusted returns for a diversified portfolio in today’s dynamic market environment.
Table of contents
Companies Overview
Corning Incorporated and Celestica Inc. are major players shaping the hardware and equipment industry with distinct operational scopes.
Corning Incorporated: Innovation Leader in Specialty Glass and Optical Technologies
Corning stands as a global technology pioneer specializing in display and optical communication products. It generates revenue through advanced glass substrates for displays and optical fiber components. In 2026, Corning focuses strategically on expanding specialty materials and environmental technologies to reinforce its leadership in high-value, innovation-driven markets.
Celestica Inc.: Supply Chain and Hardware Platform Specialist
Celestica excels as a provider of comprehensive manufacturing and supply chain solutions across multiple continents. Its revenue streams derive from electronics manufacturing, system integration, and logistics services. The company’s 2026 strategy emphasizes scaling advanced technology and cloud connectivity solutions to meet rising demand in aerospace, healthtech, and hyperscaler markets.
Strategic Collision: Similarities & Divergences
Both companies operate within the hardware sector but diverge in core philosophies: Corning drives value through proprietary materials and innovation, while Celestica leverages broad supply chain expertise and service integration. Their primary competition lies in serving high-tech industrial clients with differentiated product and service offerings. These distinctions create unique investment profiles—Corning as a technology innovator, Celestica as a flexible manufacturing partner.
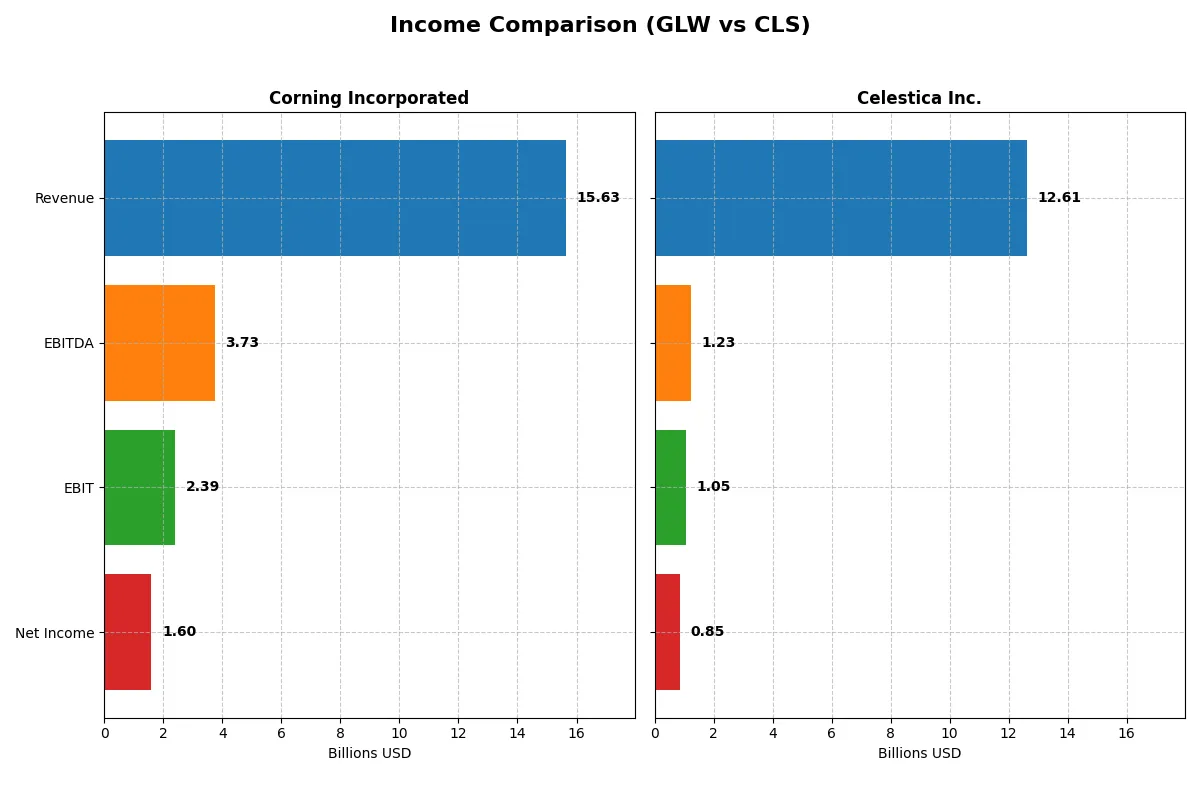
Income Statement Comparison
This data dissects the core profitability and scalability of both corporate engines to reveal who dominates the bottom line:
| Metric | Corning Incorporated (GLW) | Celestica Inc. (CLS) |
|---|---|---|
| Revenue | 15.6B | 12.6B |
| Cost of Revenue | 10.1B | 11.1B |
| Operating Expenses | 3.18B | 385M |
| Gross Profit | 5.51B | 1.47B |
| EBITDA | 3.74B | 1.23B |
| EBIT | 2.39B | 1.05B |
| Interest Expense | 336M | 54M |
| Net Income | 1.60B | 847M |
| EPS | 1.86 | 7.22 |
| Fiscal Year | 2025 | 2025 |
Income Statement Analysis: The Bottom-Line Duel
The income statement comparison unveils which corporate engine drives stronger efficiency and profit generation through recent financial performance.
Corning Incorporated Analysis
Corning’s revenue surged 19% in 2025 to $15.6B, while net income tripled to $1.6B, reflecting robust earnings momentum. Gross margin stands healthy at 35.3%. Its net margin expanded to 10.2%, showcasing improved cost control and operating leverage. The 2025 fiscal year highlights a sharp rebound in profitability and operating efficiency.
Celestica Inc. Analysis
Celestica grew revenues 31% in 2025, reaching $12.6B. Net income doubled to $847M, supported by a gross margin of 11.7%. The net margin improved to 6.7%, signaling better expense management amid rapid top-line growth. Its strong revenue expansion drives steady margin gains and accelerating earnings per share.
Verdict: Margin Power vs. Revenue Scale
Corning leads in margin strength with a gross margin over triple Celestica’s and a 2025 net margin advantage of 3.5 percentage points. Celestica, however, outpaces Corning in revenue growth, more than doubling its top-line over five years versus Corning’s modest 11%. For investors prioritizing durable profitability, Corning’s margin profile is compelling, while Celestica suits those favoring high growth momentum.
Financial Ratios Comparison
These vital ratios act as a diagnostic tool to expose the underlying fiscal health, valuation premiums, and capital efficiency of the companies analyzed:
| Ratios | Corning Incorporated (GLW) | Celestica Inc. (CLS) |
|---|---|---|
| ROE | 13.52% | 22.57% |
| ROIC | 7.40% | 16.10% |
| P/E | 47.18 | 25.47 |
| P/B | 6.38 | 5.75 |
| Current Ratio | 1.59 | 1.49 |
| Quick Ratio | 1.04 | 0.91 |
| D/E | 0.71 | 0.42 |
| Debt-to-Assets | 27.23% | 13.30% |
| Interest Coverage | 6.78 | 11.50 |
| Asset Turnover | 0.50 | 1.61 |
| Fixed Asset Turnover | 1.05 | 14.58 |
| Payout ratio | 62.59% | 0% |
| Dividend yield | 1.33% | 0% |
| Fiscal Year | 2025 | 2024 |
Efficiency & Valuation Duel: The Vital Signs
Ratios act as a company’s DNA, exposing hidden risks and operational strengths that shape investor confidence and valuation.
Corning Incorporated
Corning shows solid net margins at 10.2% and a moderate ROE of 13.5%, reflecting stable profitability. Its P/E ratio at 47.2 signals an expensive stock relative to earnings, while a P/B of 6.4 also appears stretched. Shareholders receive a modest 1.33% dividend, balancing returns with ongoing R&D investment near 7% of revenue.
Celestica Inc.
Celestica delivers a strong ROE of 22.6%, but a lower net margin of 4.4% points to operational pressure. The P/E of 25.5 and P/B near 5.8 suggest the stock remains pricey despite some valuation relief versus Corning. Celestica offers no dividend, instead directing resources toward growth and capital efficiency, highlighted by robust asset turnover ratios.
Premium Valuation vs. Operational Safety
Corning trades at a premium with higher valuation multiples and steady dividends, offering moderate profitability. Celestica benefits from superior ROE and asset efficiency but lacks dividend income. Risk-averse investors may prefer Corning’s income and stability, while growth-focused investors might lean toward Celestica’s operational leverage.
Which one offers the Superior Shareholder Reward?
Corning (GLW) pays a 1.33% dividend with a high 63% payout ratio, supported by 52% FCF coverage, showing moderate sustainability. It also executes steady buybacks, enhancing shareholder returns. Celestica (CLS) pays no dividend but invests heavily in growth, returning cash via aggressive buybacks and maintaining strong FCF conversion (64%). Historically, GLW’s balanced dividend and buyback mix offers more reliable income, but CLS’s reinvestment strategy targets higher capital appreciation. In 2026, I find GLW’s disciplined distribution model a safer total return, while CLS carries higher growth potential but with more execution risk.
Comparative Score Analysis: The Strategic Profile
The radar chart reveals the fundamental DNA and trade-offs of Corning Incorporated and Celestica Inc., highlighting their strategic strengths and weaknesses:
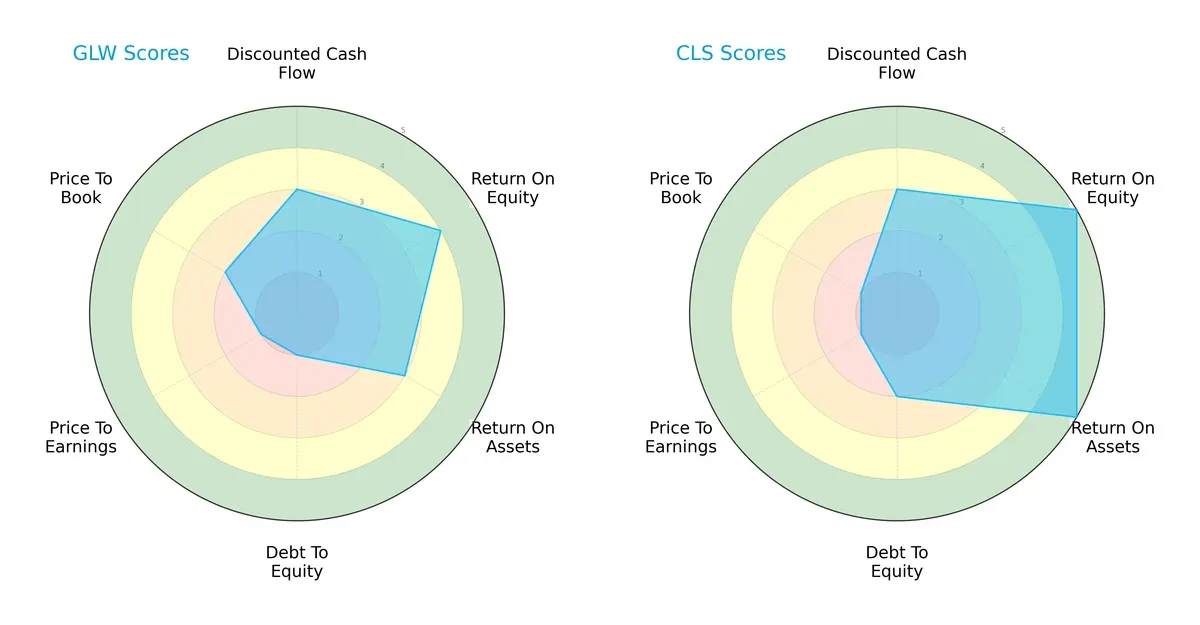
Corning shows moderate DCF and asset returns but struggles with high debt and valuation concerns. Celestica boasts superior ROE and ROA scores, reflecting operational efficiency, with a slightly better debt profile. Celestica’s profile is more balanced, while Corning relies heavily on operational returns despite financial leverage risks.
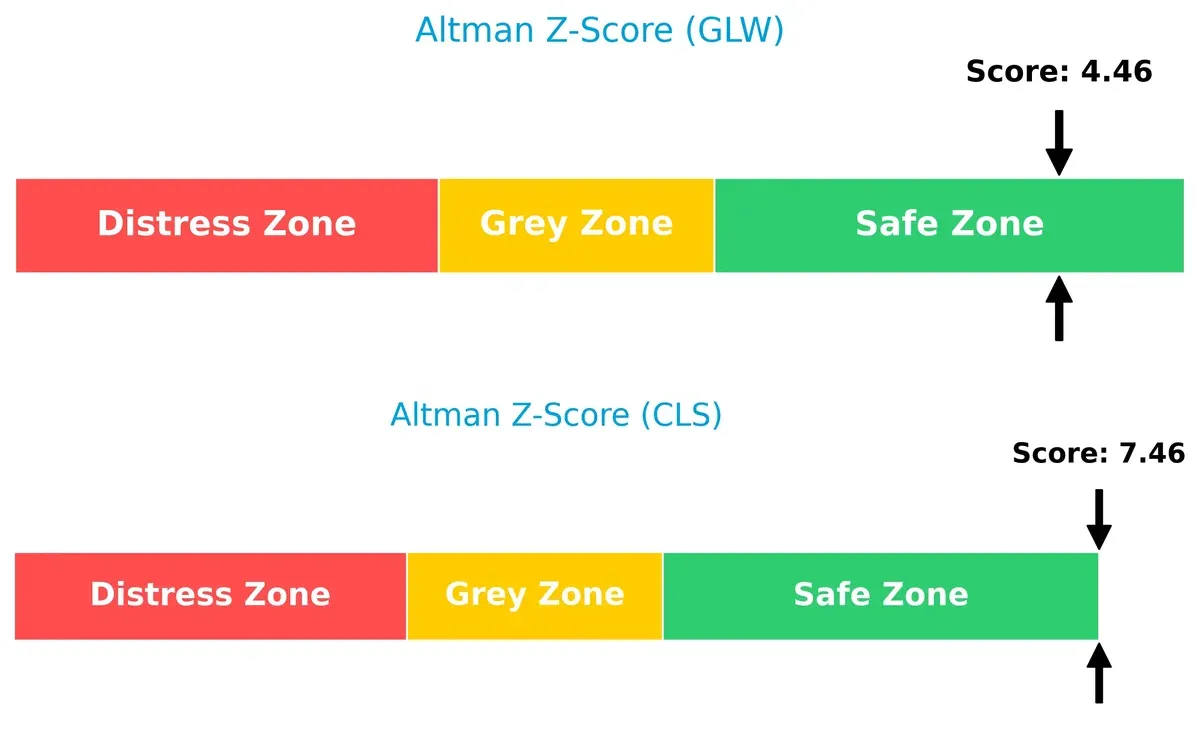
Bankruptcy Risk: Solvency Showdown
Celestica’s Altman Z-Score of 7.46 significantly exceeds Corning’s 4.46, indicating stronger solvency and lower bankruptcy risk for Celestica in this cycle:
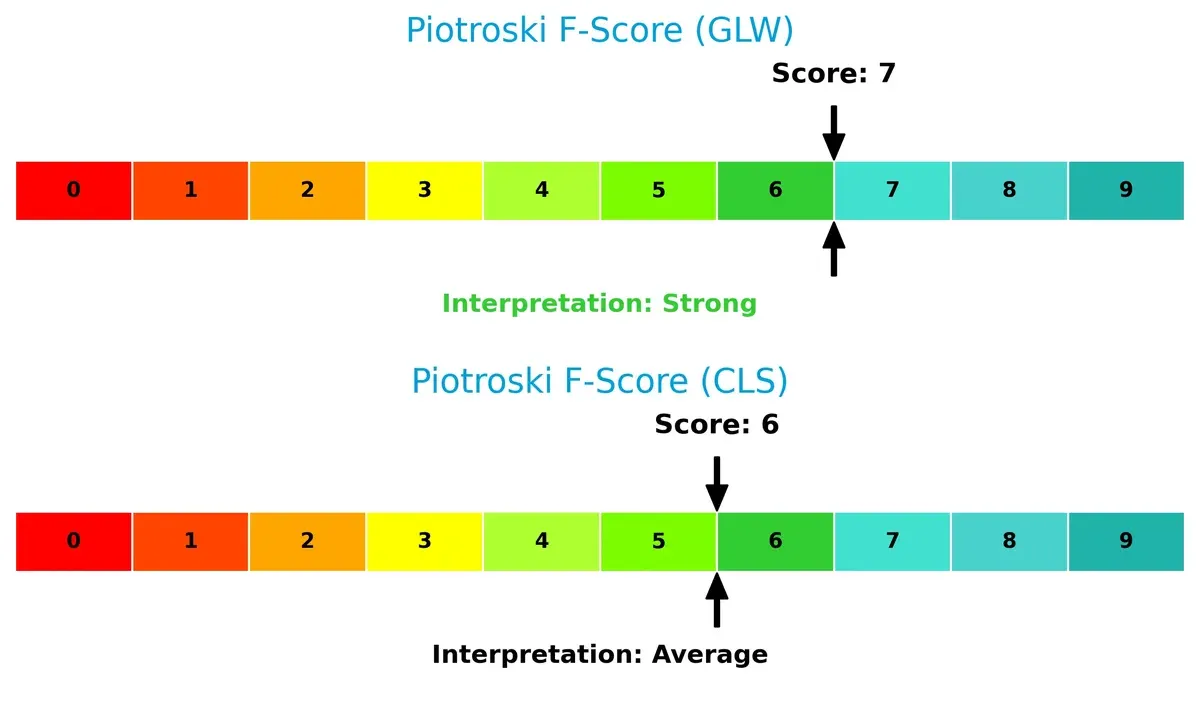
Financial Health: Quality of Operations
Corning’s Piotroski F-Score of 7 indicates strong financial health, outperforming Celestica’s average score of 6. Corning shows fewer red flags internally, suggesting more robust operational quality:
How are the two companies positioned?
This section dissects the operational DNA of Corning and Celestica by comparing their revenue distribution by segment and internal dynamics. The goal is to confront their economic moats and identify the most resilient, sustainable competitive advantage today.
Revenue Segmentation: The Strategic Mix
This visual comparison dissects how both firms diversify their income streams and where their primary sector bets lie:
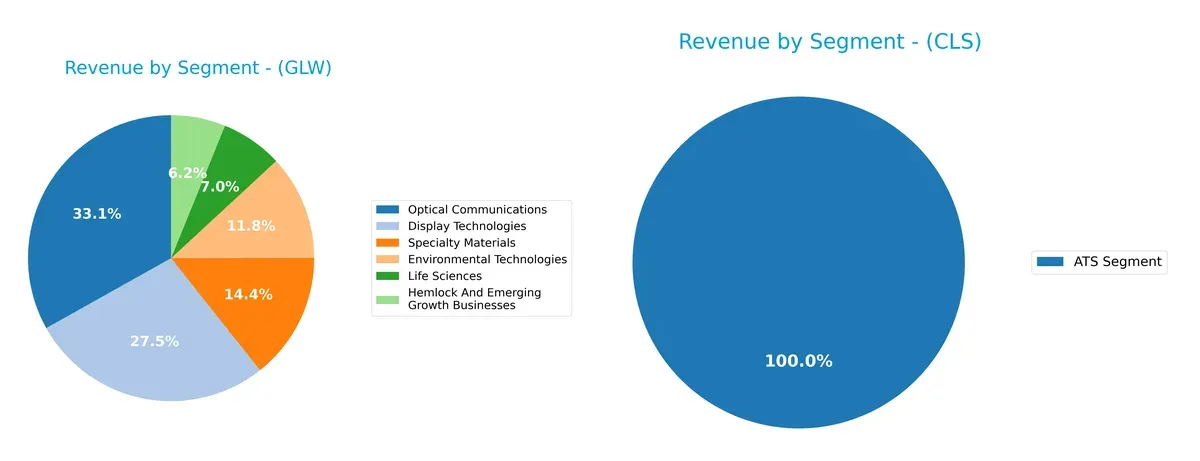
Corning Incorporated reveals a broadly diversified portfolio spanning Optical Communications at $4.66B and Display Technologies at $3.87B, with Specialty Materials and Environmental Technologies adding strength. Celestica Inc. pivots entirely on its ATS Segment, generating $3.16B alone. Corning’s mix reduces concentration risk and signals ecosystem dominance, while Celestica’s reliance on one segment exposes it to higher volatility and market shifts.
Strengths and Weaknesses Comparison
This table compares the Strengths and Weaknesses of Corning Incorporated and Celestica Inc.:
Corning Incorporated Strengths
- Diversified revenue across multiple segments
- Favorable net margin of 10.21%
- Strong liquidity with current ratio 1.59
- Favorable debt to assets at 27.23%
- Global presence with significant Asia Pacific and North America sales
- Neutral ROIC close to WACC
Celestica Inc. Strengths
- High ROE of 22.57%, indicating efficient equity use
- Favorable debt to equity ratio at 0.42
- Strong asset turnover at 1.61 and fixed asset turnover at 14.58
- Favorable interest coverage ratio of 19.69
- Slightly favorable global ratio opinion
- Concentrated revenue stream from ATS segment
Corning Incorporated Weaknesses
- High P/E ratio of 47.18 suggests overvaluation risk
- Unfavorable price to book at 6.38
- Neutral ROIC below WACC raises capital efficiency concerns
- Moderate debt level with D/E 0.71
- Neutral ROE at 13.52
- Quick ratio just above 1 could signal liquidity tightness
Celestica Inc. Weaknesses
- Low net margin at 4.44% reflects profitability challenges
- Unfavorable P/E of 25.47 and PB of 5.75
- Quick ratio below 1 at 0.91 indicates liquidity risk
- Zero dividend yield signals no income return
- Unavailable ROIC and WACC metrics limit capital allocation assessment
- Revenue concentration risks from a single segment
Corning’s diversified portfolio and solid liquidity underpin its balanced financial health. Celestica shows operational efficiency but faces profitability and liquidity challenges, compounded by limited segment diversification. Both companies exhibit slightly favorable overall ratios but differ markedly in capital structure and market valuation risks.
The Moat Duel: Analyzing Competitive Defensibility
A structural moat is the only thing protecting long-term profits from the erosion of competition. Here’s how Corning and Celestica stack up:
Corning Incorporated: Intangible Assets Powerhouse
Corning’s moat arises from its proprietary glass technologies and diversified industrial applications. This yields stable margins and a modestly growing ROIC despite value erosion. New optical innovations could deepen its moat in 2026.
Celestica Inc.: Operational Scale and Adaptability
Celestica’s strength lies in its flexible supply chain and manufacturing scale, contrasting with Corning’s tech focus. It delivers rapid revenue growth and expanding margins, with potential to disrupt via cloud and aerospace contracts.
Innovation Edge vs. Supply Chain Muscle
Corning’s moat is rooted in intangible assets but shows signs of value erosion. Celestica’s rapidly growing operational efficiency and market expansion suggest a wider moat trajectory. I see Celestica better positioned to defend and grow market share in the evolving tech landscape.
Which stock offers better returns?
Over the past year, Corning Incorporated and Celestica Inc. showed significant price movements, with Corning accelerating upward while Celestica faced recent declines after strong gains.
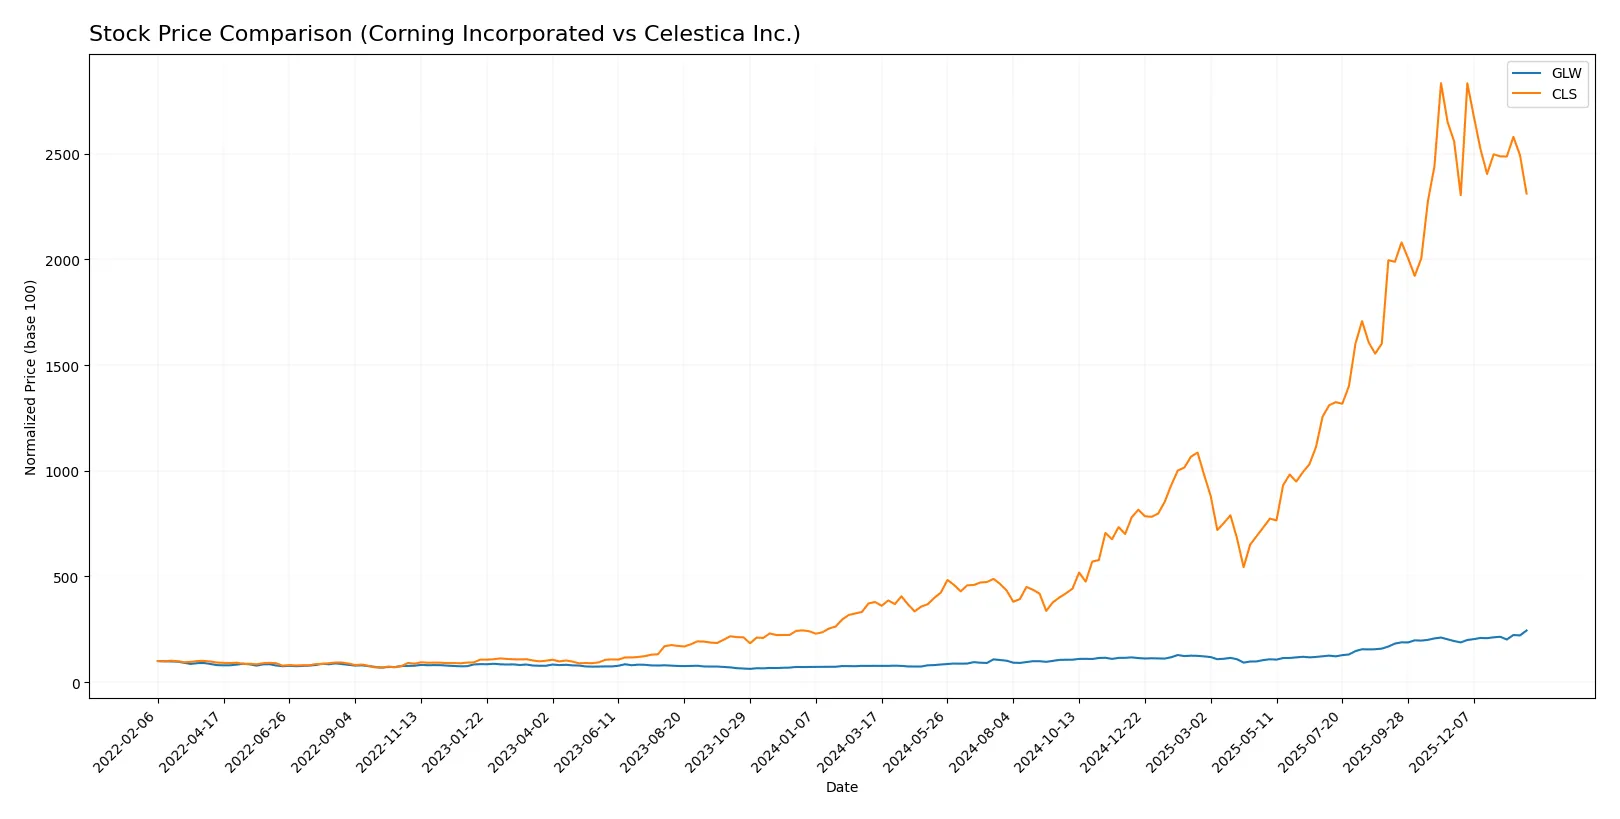
Trend Comparison
Corning Incorporated (GLW) posted a bullish 216% price gain over 12 months, showing acceleration and a steady recent 25.8% rise with moderate volatility (std dev 18.43).
Celestica Inc. (CLS) delivered a 510% overall bullish trend but experienced deceleration and a recent 9.6% decline, with high volatility (std dev 92.63) and a negative recent slope.
Corning’s trend demonstrates sustained momentum, whereas Celestica’s recent downturn reduces its near-term performance edge despite higher long-term gains.
Target Prices
Analyst consensus projects meaningful upside for both Corning Incorporated and Celestica Inc.
| Company | Target Low | Target High | Consensus |
|---|---|---|---|
| Corning Incorporated | 100 | 130 | 116.63 |
| Celestica Inc. | 300 | 440 | 365.6 |
Corning’s consensus target of 116.63 suggests a 13% premium over the current 103.25 price. Celestica’s 365.6 target implies a robust 30% upside from today’s 280.99 level.

Don’t Let Luck Decide Your Entry Point
Optimize your entry points with our advanced ProRealTime indicators. You’ll get efficient buy signals with precise price targets for maximum performance. Start outperforming now!
How do institutions grade them?
Corning Incorporated Grades
The following table summarizes recent institutional grades for Corning Incorporated:
| Grading Company | Action | New Grade | Date |
|---|---|---|---|
| Morgan Stanley | Maintain | Equal Weight | 2026-01-29 |
| Mizuho | Maintain | Outperform | 2026-01-29 |
| Citigroup | Maintain | Buy | 2026-01-29 |
| Susquehanna | Maintain | Positive | 2026-01-29 |
| JP Morgan | Maintain | Overweight | 2026-01-28 |
| Citigroup | Maintain | Buy | 2026-01-12 |
| Morgan Stanley | Maintain | Equal Weight | 2025-12-17 |
| UBS | Maintain | Buy | 2025-11-21 |
| Citigroup | Maintain | Buy | 2025-10-29 |
| JP Morgan | Maintain | Overweight | 2025-10-29 |
Celestica Inc. Grades
The following table summarizes recent institutional grades for Celestica Inc.:
| Grading Company | Action | New Grade | Date |
|---|---|---|---|
| Citigroup | Maintain | Buy | 2026-01-30 |
| Barclays | Maintain | Overweight | 2026-01-30 |
| Goldman Sachs | Maintain | Buy | 2025-12-01 |
| Barclays | Maintain | Overweight | 2025-11-14 |
| Citigroup | Upgrade | Buy | 2025-11-10 |
| Goldman Sachs | Maintain | Buy | 2025-10-29 |
| CIBC | Maintain | Outperform | 2025-10-29 |
| Stifel | Maintain | Buy | 2025-10-29 |
| Barclays | Maintain | Overweight | 2025-10-29 |
| JP Morgan | Maintain | Overweight | 2025-10-29 |
Which company has the best grades?
Celestica Inc. holds predominantly “Buy,” “Overweight,” and “Outperform” ratings across several firms. Corning shows a mix from “Equal Weight” to “Buy” and “Outperform.” Celestica’s stronger consensus may attract more bullish investor sentiment, while Corning’s grades suggest moderate confidence.
Risks specific to each company
The following categories identify the critical pressure points and systemic threats facing both firms in the 2026 market environment:
1. Market & Competition
Corning Incorporated
- Established leader in display technologies with diversified segments facing mature markets and tech shifts.
Celestica Inc.
- Operating in highly competitive hardware and supply chain services, exposed to rapid tech evolution and client concentration risks.
2. Capital Structure & Debt
Corning Incorporated
- Moderate leverage (D/E 0.71) with favorable interest coverage (7.11x), manageable debt load.
Celestica Inc.
- Lower leverage (D/E 0.42) and strong interest coverage (19.69x) indicate more conservative capital structure.
3. Stock Volatility
Corning Incorporated
- Beta 1.125 suggests moderate volatility relative to market; price range near all-time highs.
Celestica Inc.
- Higher beta at 1.463 reflects elevated volatility; recent 6.3% price drop signals increased investor uncertainty.
4. Regulatory & Legal
Corning Incorporated
- Exposure to environmental regulations due to emissions control products; global compliance complexity.
Celestica Inc.
- Broad manufacturing footprint entails diverse regulatory environments; risks in export controls and trade compliance.
5. Supply Chain & Operations
Corning Incorporated
- Complex global supply chain for specialty materials; sensitive to raw material cost fluctuations and capacity constraints.
Celestica Inc.
- Supply chain services core to business; vulnerable to component shortages and geopolitical disruptions in Asia and North America.
6. ESG & Climate Transition
Corning Incorporated
- Active in environmental tech providing emissions control solutions; ESG initiatives integral to brand and compliance.
Celestica Inc.
- ESG efforts evolving; pressure to improve footprint in energy use and supply chain sustainability amid investor scrutiny.
7. Geopolitical Exposure
Corning Incorporated
- US-based with international operations; faces risks from US-China tensions impacting supply chains and sales.
Celestica Inc.
- Canadian headquarters with significant Asia and Europe exposure; geopolitical tensions pose operational and market access risks.
Which company shows a better risk-adjusted profile?
Corning’s primary risk lies in its capital structure and valuation stretched by high P/E and P/B ratios. Celestica faces greater earnings volatility and competitive pressure but benefits from a stronger balance sheet and superior asset turnover. Despite Celestica’s higher stock volatility, its conservative leverage and operational efficiency offer a better risk-adjusted profile. Corning’s elevated valuation multiples and moderate leverage raise red flags amid 2026 market uncertainties.
Final Verdict: Which stock to choose?
Corning Incorporated’s superpower lies in its resilient operational efficiency and consistent cash generation. Its rising profitability amid value destruction signals a turnaround in capital allocation. A point of vigilance remains its stretched valuation and debt profile. This stock fits an aggressive growth portfolio willing to navigate cyclicality.
Celestica Inc. boasts a strategic moat through superior asset turnover and robust return on equity, reflecting operational agility. It offers a safer financial footing with lower leverage and stronger interest coverage than Corning. Celestica suits a GARP portfolio seeking disciplined growth with a moderate risk appetite.
If you prioritize turnaround potential and long-term cash flow improvement, Corning outshines due to accelerating profitability and market momentum. However, if you seek operational stability and efficient capital use, Celestica offers better stability with a cleaner balance sheet and superior asset efficiency. Each stock presents distinct scenarios aligned with different investor profiles.
Disclaimer: Investment carries a risk of loss of initial capital. The past performance is not a reliable indicator of future results. Be sure to understand risks before making an investment decision.
Go Further
I encourage you to read the complete analyses of Corning Incorporated and Celestica Inc. to enhance your investment decisions: