Home > Comparison > Technology > CLS vs COHR
The strategic rivalry between Celestica Inc. and Coherent, Inc. shapes the competitive landscape of the Technology sector. Celestica operates as a capital-intensive hardware platform and supply chain solutions provider, while Coherent focuses on high-precision laser systems for industrial and scientific markets. This analysis pits Celestica’s diversified manufacturing model against Coherent’s specialized technology edge to identify which offers the superior risk-adjusted return for a balanced portfolio.
Table of contents
Companies Overview
Celestica and Coherent, Inc. stand as pivotal players in the hardware and equipment sector, each commanding significant market presence.
Celestica Inc.: Supply Chain and Hardware Solutions Leader
Celestica excels as a hardware platform and supply chain solutions provider across North America, Europe, and Asia. Its revenue hinges on comprehensive manufacturing and supply chain services, including design, engineering, and logistics. In 2026, Celestica’s strategy centers on integrating advanced technology with connectivity and cloud solutions to serve aerospace, defense, and hyperscalers.
Coherent, Inc.: Laser Technology Innovator
Coherent dominates in laser and laser-based system solutions for industrial, commercial, and scientific applications. Its income derives from OEM laser sources and industrial laser systems, emphasizing precision optics and measurement tools. The company’s 2026 focus revolves around expanding laser technologies for microelectronics and materials processing while leveraging direct sales globally.
Strategic Collision: Similarities & Divergences
Both companies operate in the hardware, equipment, and parts industry but diverge sharply in business philosophy. Celestica emphasizes broad supply chain integration, while Coherent pursues niche laser technology innovation. Their competitive battleground lies in serving advanced manufacturing sectors. Celestica offers a diversified platform approach; Coherent presents a specialized, innovation-driven profile, shaping distinct investment considerations.
Income Statement Comparison
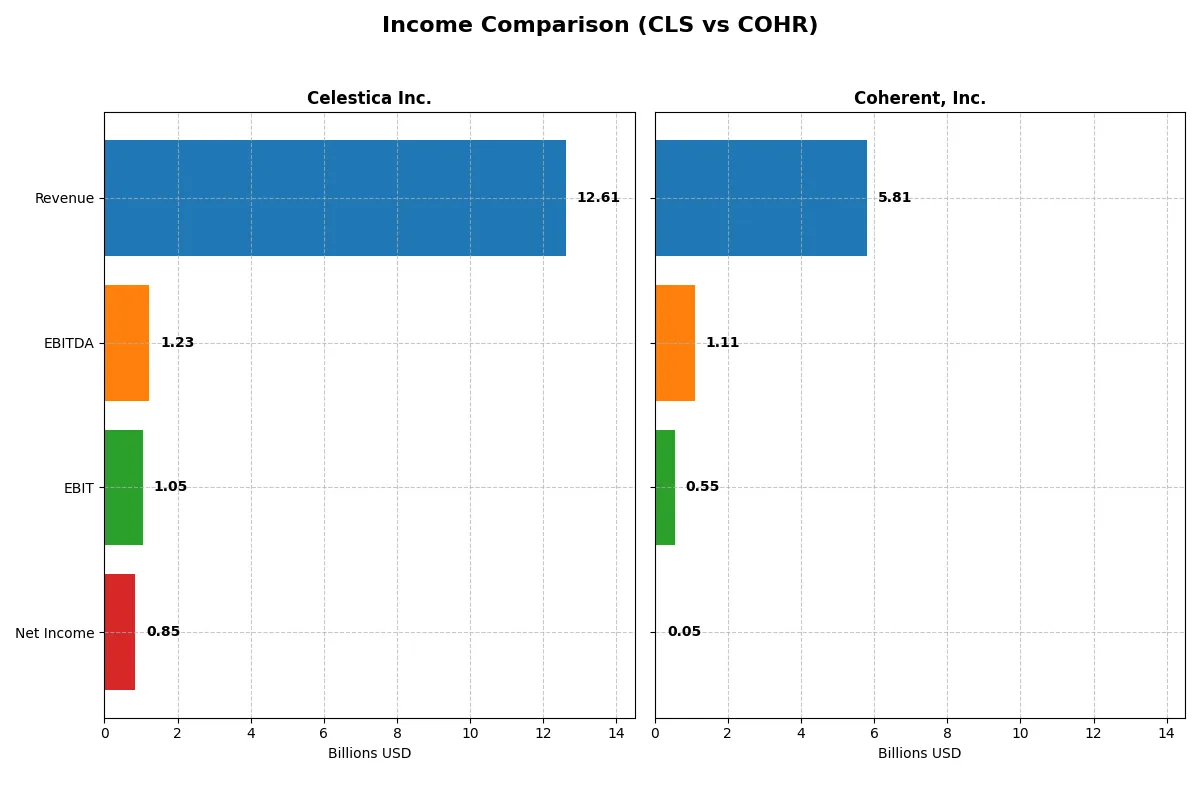
This data dissects the core profitability and scalability of both corporate engines to reveal who dominates the bottom line:
| Metric | Celestica Inc. (CLS) | Coherent, Inc. (COHR) |
|---|---|---|
| Revenue | 12.6B | 5.8B |
| Cost of Revenue | 11.1B | 3.8B |
| Operating Expenses | 385M | 1.51B |
| Gross Profit | 1.47B | 2.06B |
| EBITDA | 1.23B | 1.11B |
| EBIT | 1.05B | 552M |
| Interest Expense | 54M | 243M |
| Net Income | 847M | -81M |
| EPS | 7.22 | -0.52 |
| Fiscal Year | 2025 | 2025 |
Income Statement Analysis: The Bottom-Line Duel
The following income statement comparison reveals which company runs a more efficient and profitable business engine in 2025.
Celestica Inc. Analysis
Celestica’s revenue surged 31% in 2025 to $12.6B, with net income nearly doubling to $847M. Gross margin holds steady at 11.7%, while net margin improved to a healthy 6.7%. The company’s EBIT jumped 80%, signaling growing operational efficiency and strong momentum in profitability.
Coherent, Inc. Analysis
Coherent recorded $5.8B revenue in 2025, up 23%, with gross margin at an impressive 35.4%. However, net income remains weak at $49M, reflecting a razor-thin 0.85% net margin. Despite a 348% EBIT growth, heavy interest and other expenses continue to erode bottom-line results.
Margin Strength vs. Scale Efficiency
Celestica outpaces Coherent in net income growth and margin expansion, delivering scalable profits from a larger revenue base. Coherent impresses with gross margin but suffers from poor net profitability and higher financial costs. For investors, Celestica’s consistent bottom-line improvement offers a more attractive risk-adjusted profile.
Financial Ratios Comparison
These vital ratios act as a diagnostic tool to expose the underlying fiscal health, valuation premiums, and capital efficiency of the companies compared below:
| Ratios | Celestica Inc. (CLS) | Coherent, Inc. (COHR) |
|---|---|---|
| ROE | 22.57% | 0.61% |
| ROIC | 16.10% | 1.31% |
| P/E | 25.47 | 279.75 |
| P/B | 5.75 | 1.70 |
| Current Ratio | 1.49 | 2.19 |
| Quick Ratio | 0.91 | 1.39 |
| D/E | 0.42 | 0.48 |
| Debt-to-Assets | 13.30% | 26.11% |
| Interest Coverage | 11.50 | 2.26 |
| Asset Turnover | 1.61 | 0.39 |
| Fixed Asset Turnover | 14.58 | 3.09 |
| Payout ratio | 0% | 23.17% |
| Dividend yield | 0% | 0.08% |
| Fiscal Year | 2024 | 2025 |
Efficiency & Valuation Duel: The Vital Signs
Financial ratios act as the company’s DNA, unveiling hidden risks and operational strengths that shape investment decisions deeply.
Celestica Inc.
Celestica posts a strong 22.57% ROE, signaling efficient capital use despite a modest 4.44% net margin. Its P/E of 25.47 suggests the stock trades at a premium relative to fundamentals. The company does not pay dividends, opting to reinvest earnings into R&D and growth initiatives, reinforcing its focus on long-term value creation.
Coherent, Inc.
Coherent’s profitability struggles with a 0.61% ROE and a slim 0.85% net margin, reflecting operational challenges. Valuation appears stretched, with a P/E ratio near 280, far above typical sector norms. It maintains a small dividend yield of 0.08%, but profitability constraints raise questions about sustainable shareholder returns and growth reinvestment effectiveness.
Premium Valuation vs. Operational Safety
Celestica balances solid profitability with a moderately high valuation, offering controlled risk through reinvestment. Coherent’s sky-high valuation and weak returns elevate risk significantly. Investors favoring operational efficiency lean toward Celestica, while those chasing speculative growth face greater uncertainty with Coherent.
Which one offers the Superior Shareholder Reward?
I observe Celestica Inc. (CLS) does not pay dividends but generates solid free cash flow (2.57/share) with modest capex (1.45/share), enabling share buybacks to fuel shareholder returns sustainably. Coherent, Inc. (COHR) pays a small dividend yield (~0.08%) with a payout ratio near 23%, but its free cash flow (1.25/share) barely covers capex (2.85/share), pressuring buybacks. COHR’s high P/E (280x) and volatile margins raise valuation and profitability risks. I favor CLS’s aggressive buyback strategy and stronger free cash flow coverage, offering a more attractive total return profile in 2026.
Comparative Score Analysis: The Strategic Profile
The radar chart reveals the fundamental DNA and strategic trade-offs of Celestica Inc. and Coherent, Inc.:
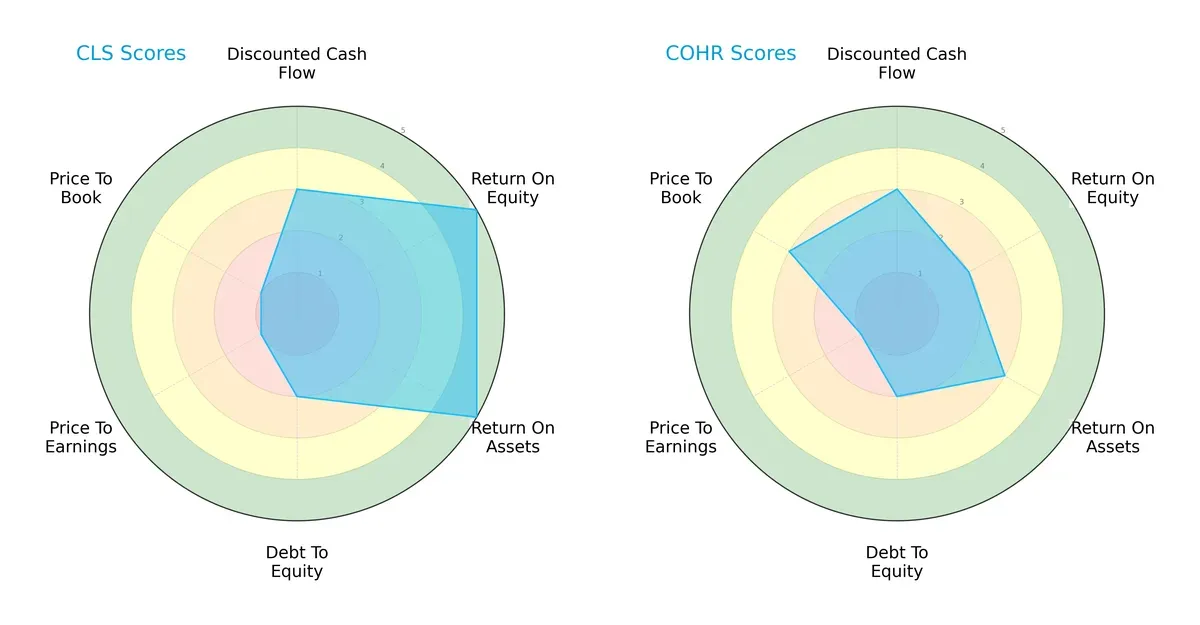
Celestica excels in profitability metrics, boasting very favorable ROE and ROA scores (5 each), signaling efficient asset and equity utilization. Coherent shows moderate profitability but outperforms Celestica in Price-to-Book valuation (3 vs. 1), suggesting a more reasonable market price relative to book value. Both firms share moderate Debt/Equity risk, but Celestica’s valuation scores lag significantly. Overall, Celestica presents a more balanced operating strength, while Coherent leverages valuation advantages.
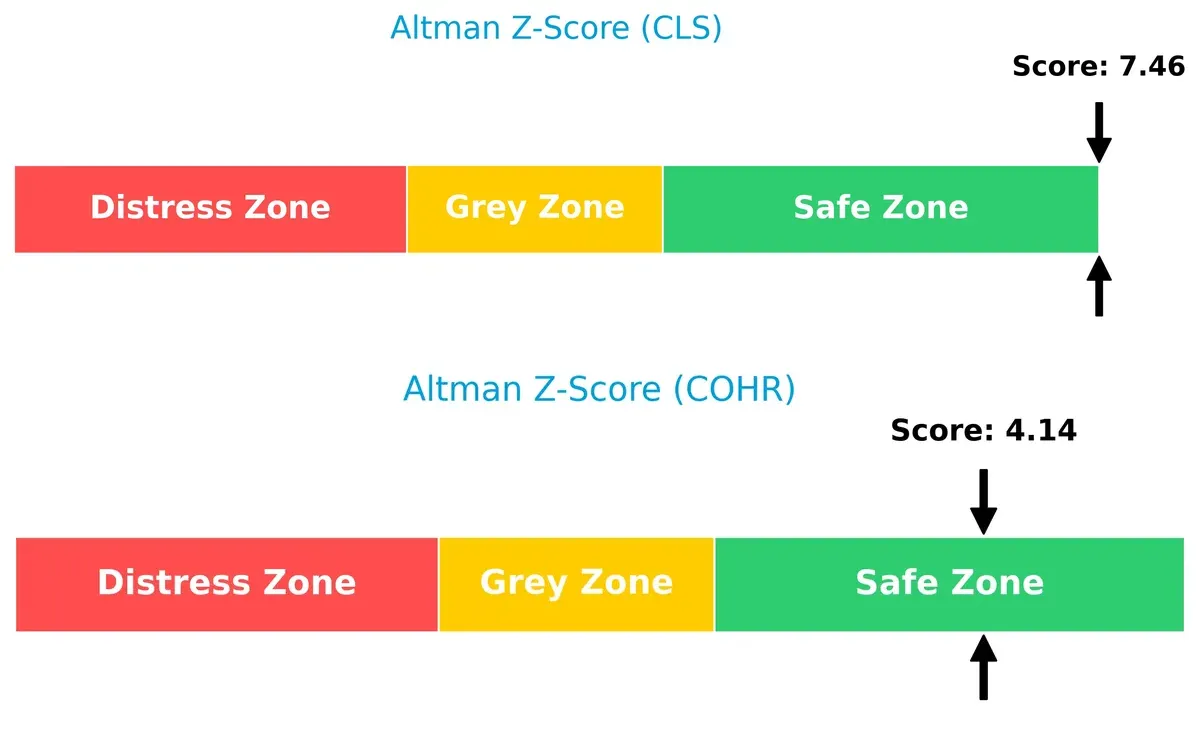
Bankruptcy Risk: Solvency Showdown
Celestica’s Altman Z-Score of 7.46 far exceeds Coherent’s 4.14, both safely above the distress threshold, signaling robust financial stability and minimal bankruptcy risk in this cycle:
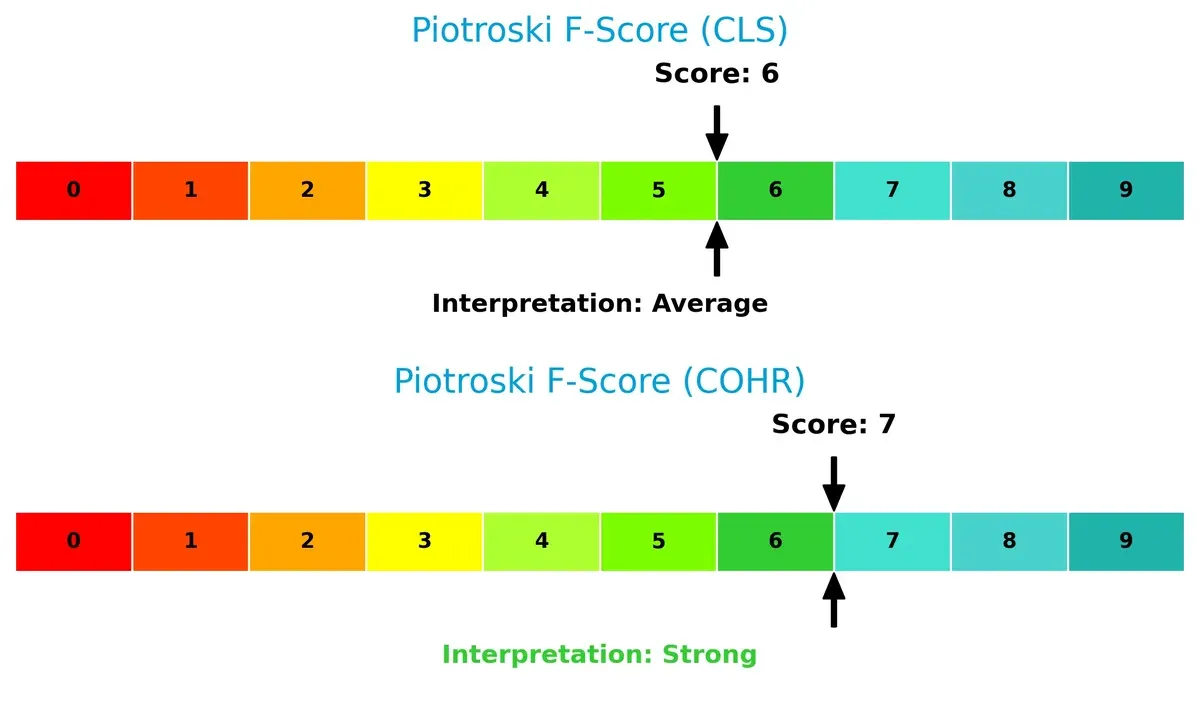
Financial Health: Quality of Operations
Coherent’s Piotroski F-Score of 7 outperforms Celestica’s 6, indicating stronger internal financial health and fewer red flags in profitability, leverage, and liquidity metrics:
How are the two companies positioned?
This section dissects the operational DNA of Celestica and Coherent by comparing their revenue distribution and internal dynamics. The goal is to confront their economic moats and identify which model offers the most resilient competitive advantage today.
Revenue Segmentation: The Strategic Mix
This comparison dissects how Celestica Inc. and Coherent, Inc. diversify their income streams and reveals where their primary sector bets lie:
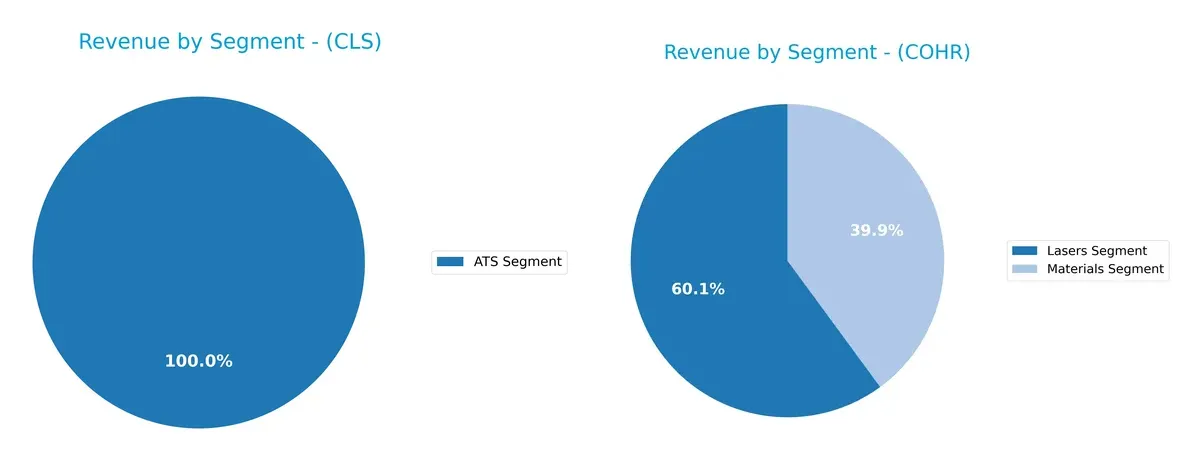
Celestica leans heavily on a single ATS Segment generating $3.16B, anchoring its revenue in one core business. Coherent shows a more diversified mix, with $1.43B from Lasers and $954M from Materials in 2025. This split reduces concentration risk and signals strategic breadth. Celestica’s focus suggests infrastructure dominance, while Coherent pivots on complementary segments for ecosystem lock-in.
Strengths and Weaknesses Comparison
This table compares the Strengths and Weaknesses of Celestica Inc. and Coherent, Inc.:
Celestica Inc. Strengths
- Favorable ROE at 22.57%
- Low debt to assets at 13.3%
- Strong asset turnover (1.61) and fixed asset turnover (14.58)
- High interest coverage (19.69)
- Neutral liquidity ratios
Coherent, Inc. Strengths
- Favorable current ratio (2.19) and quick ratio (1.39)
- Moderate debt to assets (26.11%)
- Favorable fixed asset turnover (3.09)
- Diversified revenue across Lasers and Materials segments
- Global presence including China, Europe, Japan, and North America
Celestica Inc. Weaknesses
- Unfavorable net margin (4.44%)
- Unfavorable P/E (25.47) and P/B (5.75) ratios
- No dividend yield
- Unavailable ROIC and WACC data
- Neutral liquidity quick ratio below 1
Coherent, Inc. Weaknesses
- Poor profitability with net margin at 0.85%, ROE 0.61%, and ROIC 1.31%
- High P/E ratio (279.75)
- Interest coverage low at 2.27
- Asset turnover weak at 0.39
- Dividend yield near zero
Celestica shows stronger profitability and capital efficiency despite limited margin and valuation concerns. Coherent benefits from solid liquidity and geographic diversification but struggles with profitability and asset utilization. These contrasts highlight different strategic challenges and financial health profiles.
The Moat Duel: Analyzing Competitive Defensibility
A structural moat is the only true safeguard protecting a company’s long-term profits from relentless competitive erosion:
Celestica Inc.: Supply Chain Efficiency & Diversification Moat
Celestica’s core advantage lies in its supply chain expertise and diversified manufacturing base. Its growing ROIC trend signals improving capital efficiency. Expansion into advanced technology markets in 2026 could deepen its competitive edge.
Coherent, Inc.: Specialized Laser Technology Moat
Coherent’s moat stems from proprietary laser technologies and precision optics, contrasting with Celestica’s supply chain focus. However, its declining ROIC and value destruction warn of weakening competitive positioning. New industrial applications in 2026 offer growth but come with execution risks.
Supply Chain Mastery vs. Technology Specialization: Who Holds the Stronger Moat?
Celestica’s expanding ROIC and broad market reach create a wider, more durable moat. Coherent’s specialized tech faces margin pressures and shrinking returns. I view Celestica as better equipped to defend and grow its market share in 2026.
Which stock offers better returns?
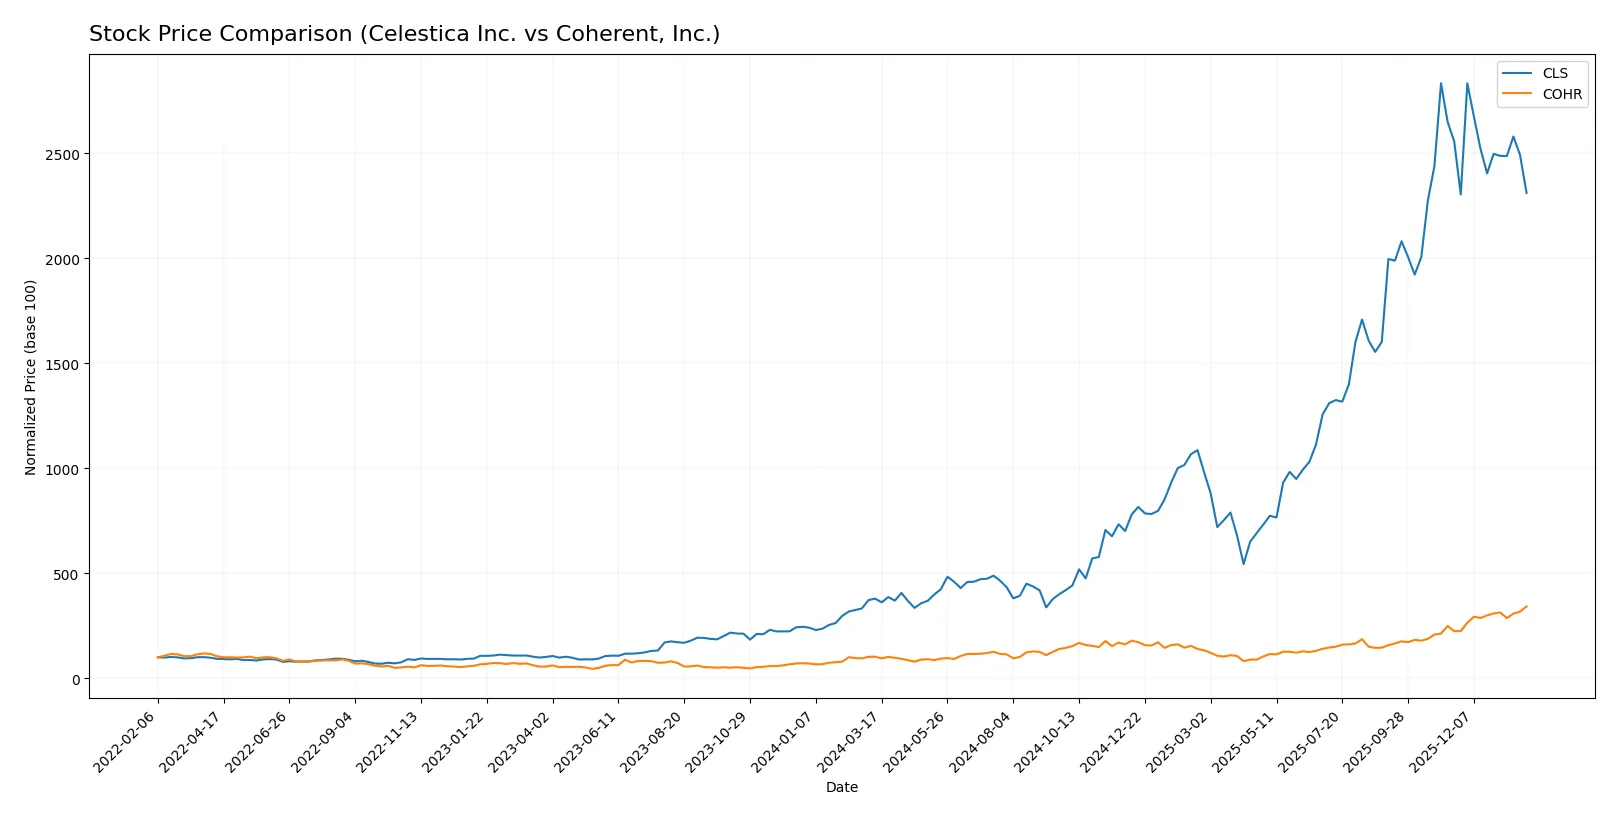
Both Celestica Inc. and Coherent, Inc. exhibited strong price movements over the past 12 months, with distinct phases of acceleration and recent trading divergences.
Trend Comparison
Celestica Inc. posted a 509.52% price increase over the past year, signaling a bullish trend despite recent deceleration and a 9.61% decline in the last 2.5 months.
Coherent, Inc. gained 232.26% over 12 months, showing bullish acceleration and a robust 52.29% price rise in the recent period, reflecting strong momentum.
Celestica leads in total annual returns, but Coherent’s recent performance shows stronger upward momentum and buyer dominance in trading volume.
Target Prices
Analysts present a clear bullish consensus for Celestica Inc. and Coherent, Inc., reflecting positive growth expectations.
| Company | Target Low | Target High | Consensus |
|---|---|---|---|
| Celestica Inc. | 300 | 440 | 365.6 |
| Coherent, Inc. | 190 | 235 | 210 |
Celestica’s consensus target at 365.6 exceeds its current price of 281, indicating upside potential. Coherent’s target consensus of 210 aligns closely with its present price of 212, suggesting a stable outlook.

Don’t Let Luck Decide Your Entry Point
Optimize your entry points with our advanced ProRealTime indicators. You’ll get efficient buy signals with precise price targets for maximum performance. Start outperforming now!
How do institutions grade them?
Celestica Inc. Grades
The following table summarizes recent grades assigned to Celestica Inc. by major financial institutions:
| Grading Company | Action | New Grade | Date |
|---|---|---|---|
| Citigroup | Maintain | Buy | 2026-01-30 |
| Barclays | Maintain | Overweight | 2026-01-30 |
| Goldman Sachs | Maintain | Buy | 2025-12-01 |
| Barclays | Maintain | Overweight | 2025-11-14 |
| Citigroup | Upgrade | Buy | 2025-11-10 |
| Goldman Sachs | Maintain | Buy | 2025-10-29 |
| CIBC | Maintain | Outperform | 2025-10-29 |
| Stifel | Maintain | Buy | 2025-10-29 |
| Barclays | Maintain | Overweight | 2025-10-29 |
| JP Morgan | Maintain | Overweight | 2025-10-29 |
Coherent, Inc. Grades
Below are recent institutional grades for Coherent, Inc. from recognized financial firms:
| Grading Company | Action | New Grade | Date |
|---|---|---|---|
| Morgan Stanley | Maintain | Equal Weight | 2026-01-30 |
| Citigroup | Maintain | Buy | 2026-01-26 |
| Susquehanna | Maintain | Positive | 2026-01-22 |
| Stifel | Maintain | Buy | 2026-01-22 |
| Barclays | Maintain | Overweight | 2026-01-15 |
| Morgan Stanley | Maintain | Equal Weight | 2025-12-17 |
| JP Morgan | Maintain | Overweight | 2025-12-05 |
| Barclays | Maintain | Overweight | 2025-11-07 |
| Needham | Maintain | Buy | 2025-11-06 |
| Morgan Stanley | Maintain | Equal Weight | 2025-11-06 |
Which company has the best grades?
Celestica Inc. has consistently received stronger grades such as Buy, Overweight, and Outperform from top banks. Coherent, Inc. shows more mixed ratings with Equal Weight and Buy. Investors might view Celestica’s higher grades as a signal of greater institutional confidence.
Risks specific to each company
The following categories identify critical pressure points and systemic threats facing both firms in the 2026 market environment:
1. Market & Competition
Celestica Inc.
- Faces intense competition in hardware and supply chain sectors globally.
Coherent, Inc.
- Operates in a niche laser technology field but contends with rapid innovation cycles.
2. Capital Structure & Debt
Celestica Inc.
- Maintains a conservative debt-to-equity ratio at 0.42, signaling manageable leverage.
Coherent, Inc.
- Slightly higher debt-to-equity ratio at 0.48, with moderate interest coverage at 2.27x.
3. Stock Volatility
Celestica Inc.
- Beta of 1.46 indicates moderate volatility relative to the market.
Coherent, Inc.
- Higher beta of 1.83 suggests elevated stock price swings and sensitivity to market shifts.
4. Regulatory & Legal
Celestica Inc.
- Subject to international trade regulations impacting supply chain and manufacturing.
Coherent, Inc.
- Faces stringent compliance in laser safety and export controls, especially post-acquisition.
5. Supply Chain & Operations
Celestica Inc.
- Complex global supply chains expose it to geopolitical and logistical risks.
Coherent, Inc.
- Specialized components sourcing may cause operational delays and cost pressures.
6. ESG & Climate Transition
Celestica Inc.
- Increasing pressure to enhance sustainable manufacturing and energy efficiency.
Coherent, Inc.
- Needs to address environmental impact of laser manufacturing processes and materials.
7. Geopolitical Exposure
Celestica Inc.
- Operations span North America, Europe, and Asia, increasing risk from trade tensions.
Coherent, Inc.
- Primarily US-based but international sales expose it to geopolitical uncertainties.
Which company shows a better risk-adjusted profile?
Celestica’s strongest risk lies in its global supply chain vulnerabilities amid geopolitical tensions. Coherent faces significant market and innovation risks due to its high stock volatility and narrower product focus. Celestica’s moderate leverage and safer Altman Z-score underscore a more balanced risk profile. Notably, Coherent’s elevated beta and weak ROIC alarm me, highlighting its higher risk exposure despite strong Piotroski scores. Overall, Celestica offers a better risk-adjusted investment stance given current data.
Final Verdict: Which stock to choose?
Celestica Inc. (CLS) boasts a superpower in accelerating profitability and capital efficiency, evidenced by its robust and growing ROIC trend. Its point of vigilance lies in valuation multiples, which appear stretched relative to peers. CLS fits best in aggressive growth portfolios willing to tolerate some premium for momentum.
Coherent, Inc. (COHR) offers a strategic moat through its strong R&D investment and intangible asset base, supporting innovation leadership. It presents a safer liquidity profile and moderate leverage compared to CLS. COHR suits investors seeking GARP (Growth at a Reasonable Price) with a focus on stability amid technological evolution.
If you prioritize rapid value creation and capital efficiency, CLS is the compelling choice due to its expanding profitability and operational momentum. However, if you seek steadier cash flow and innovation-driven resilience with less valuation risk, COHR offers better stability despite current profitability challenges. Both require cautious monitoring of financial health and market dynamics.
Disclaimer: Investment carries a risk of loss of initial capital. The past performance is not a reliable indicator of future results. Be sure to understand risks before making an investment decision.
Go Further
I encourage you to read the complete analyses of Celestica Inc. and Coherent, Inc. to enhance your investment decisions: