Home > Comparison > Technology > CLS vs CGNX
The strategic rivalry between Celestica Inc. and Cognex Corporation shapes the hardware and equipment sector’s evolution. Celestica operates as a capital-intensive manufacturer and supply chain integrator, while Cognex excels as a high-margin innovator in machine vision technology. This analysis contrasts their operational models and capital allocation strategies to identify which company offers superior risk-adjusted returns. Investors will gain clarity on the optimal choice for a diversified technology portfolio.
Table of contents
Companies Overview
Celestica Inc. and Cognex Corporation stand as pivotal players in the hardware and equipment sector, each shaping distinct facets of technology infrastructure.
Celestica Inc.: Global Supply Chain and Manufacturing Leader
Celestica Inc. dominates as a hardware platform and supply chain solutions provider across North America, Europe, and Asia. It generates revenue through comprehensive product manufacturing and supply chain services, including engineering, assembly, testing, and logistics. In 2026, its strategic focus centers on expanding Advanced Technology and Cloud Solutions to serve aerospace, defense, and hyperscale cloud clients, reinforcing its broad industrial footprint.
Cognex Corporation: Innovator in Machine Vision Technology
Cognex Corporation leads in machine vision products that automate manufacturing and distribution globally. Its revenue engine revolves around patented software and vision systems that inspect, identify, and measure items in industries like automotive and pharmaceuticals. The company’s 2026 strategy emphasizes enhancing deep learning vision software and expanding its DataMan barcode readers to meet evolving automation demands.
Strategic Collision: Similarities & Divergences
Both companies operate in hardware but diverge sharply; Celestica pursues a broad manufacturing and supply chain model, while Cognex specializes in focused automation technologies. Their primary battleground lies in industrial automation—Celestica supports hardware assembly, and Cognex delivers precision vision systems. Investors face contrasting profiles: Celestica with extensive scale and diversification, and Cognex with niche innovation and software-driven growth.
Income Statement Comparison
This data dissects the core profitability and scalability of both corporate engines to reveal who dominates the bottom line:
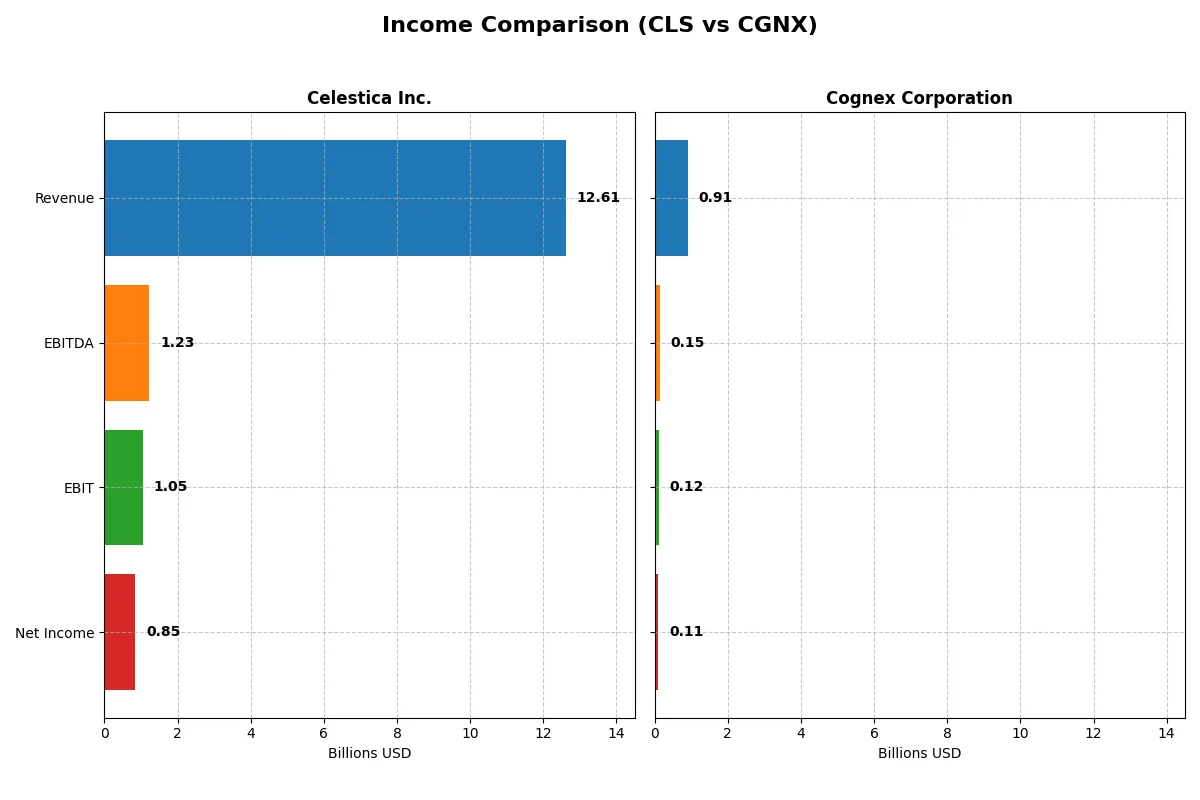
| Metric | Celestica Inc. (CLS) | Cognex Corporation (CGNX) |
|---|---|---|
| Revenue | 12.6B | 915M |
| Cost of Revenue | 11.1B | 289M |
| Operating Expenses | 385M | 511M |
| Gross Profit | 1.47B | 626M |
| EBITDA | 1.23B | 148M |
| EBIT | 1.05B | 115M |
| Interest Expense | 54M | 0 |
| Net Income | 847M | 106M |
| EPS | 7.22 | 0.62 |
| Fiscal Year | 2025 | 2024 |
Income Statement Analysis: The Bottom-Line Duel
This income statement comparison exposes which company operates with superior efficiency and delivers stronger profitability momentum.
Celestica Inc. Analysis
Celestica’s revenue surged from 5.6B in 2021 to 12.6B in 2025, more than doubling over five years. Net income expanded impressively from 104M to 847M, reflecting robust bottom-line growth. Margins remain steady, with a gross margin near 11.7% and a net margin improving to 6.7%, signaling solid cost control and operational leverage. The 2025 fiscal year showed exceptional momentum, with net income nearly doubling year-over-year and EBIT growing by over 80%.
Cognex Corporation Analysis
Cognex reported more modest revenue growth, rising from 811M in 2020 to 915M in 2024. Net income, however, declined from 279M in 2021 to 106M in 2024, evidencing margin pressure and profitability challenges. The firm maintains strong gross margins at 68.4% and net margins at 11.6%, but its EBIT margin slipped to 12.6% in 2024. Recent years showed mixed momentum, with a slight revenue rise but declines in net income, EPS, and EBIT, indicating operational headwinds.
Revenue Growth vs. Margin Strength
Celestica clearly outpaces Cognex in revenue and net income growth, exhibiting dynamic expansion and margin improvement. Cognex boasts higher absolute margins but struggles with declining profitability and EPS over recent years. For investors, Celestica’s aggressive growth profile offers compelling upside, while Cognex’s margin resilience appeals to those prioritizing stable profitability in slower growth environments.
Financial Ratios Comparison
These vital ratios act as a diagnostic tool to expose the underlying fiscal health, valuation premiums, and capital efficiency of the companies compared below:
| Ratios | Celestica Inc. (CLS) | Cognex Corporation (CGNX) |
|---|---|---|
| ROE | 22.57% | 6.99% |
| ROIC | 16.10% | 5.07% |
| P/E | 25.47 | 57.90 |
| P/B | 5.75 | 4.05 |
| Current Ratio | 1.49 | 3.62 |
| Quick Ratio | 0.91 | 2.69 |
| D/E (Debt-to-Equity) | 0.42 | 0.05 |
| Debt-to-Assets | 13.30% | 3.52% |
| Interest Coverage | 11.50 | 0 |
| Asset Turnover | 1.61 | 0.46 |
| Fixed Asset Turnover | 14.58 | 5.52 |
| Payout ratio | 0 | 49.29% |
| Dividend yield | 0% | 0.85% |
| Fiscal Year | 2024 | 2024 |
Efficiency & Valuation Duel: The Vital Signs
Financial ratios act as the company’s DNA, unveiling hidden risks and operational excellence crucial for informed investment decisions.
Celestica Inc.
Celestica posts a robust 22.57% ROE but struggles with a slim 4.44% net margin, signaling tight profitability. The stock trades at a stretched P/E of 25.47 and a high P/B of 5.75, suggesting expensive valuation. It pays no dividend, focusing instead on reinvesting in growth and R&D.
Cognex Corporation
Cognex delivers a healthy 11.61% net margin but a modest 7.0% ROE, reflecting moderate profitability. The stock shows an expensive P/E of 57.9 and a P/B of 4.05, indicating valuation stretch. It offers a small 0.85% dividend yield, balancing shareholder returns with significant R&D investment.
Premium Valuation vs. Operational Safety
Celestica demonstrates stronger equity returns but weaker margins and no dividend, while Cognex offers better margins with a modest yield yet carries a higher valuation risk. Investors seeking growth with operational efficiency may lean toward Celestica; those prioritizing margin stability and income might prefer Cognex.
Which one offers the Superior Shareholder Reward?
I find Cognex Corporation (CGNX) delivers superior shareholder reward compared to Celestica Inc. (CLS) in 2026. CGNX combines a modest 0.85% dividend yield with a sustainable 49% payout ratio, backed by strong free cash flow coverage (~90%). Its share buyback intensity is less transparent but likely complements dividends for total return. CLS pays no dividends and lacks buybacks, instead reinvesting heavily in operations with lower margins and free cash flow yield. CGNX’s disciplined capital allocation and shareholder distributions align better with long-term value creation. I conclude CGNX offers a more attractive total return profile for investors today.
Comparative Score Analysis: The Strategic Profile
The radar chart reveals the fundamental DNA and trade-offs of Celestica Inc. and Cognex Corporation, highlighting their strategic strengths and vulnerabilities:
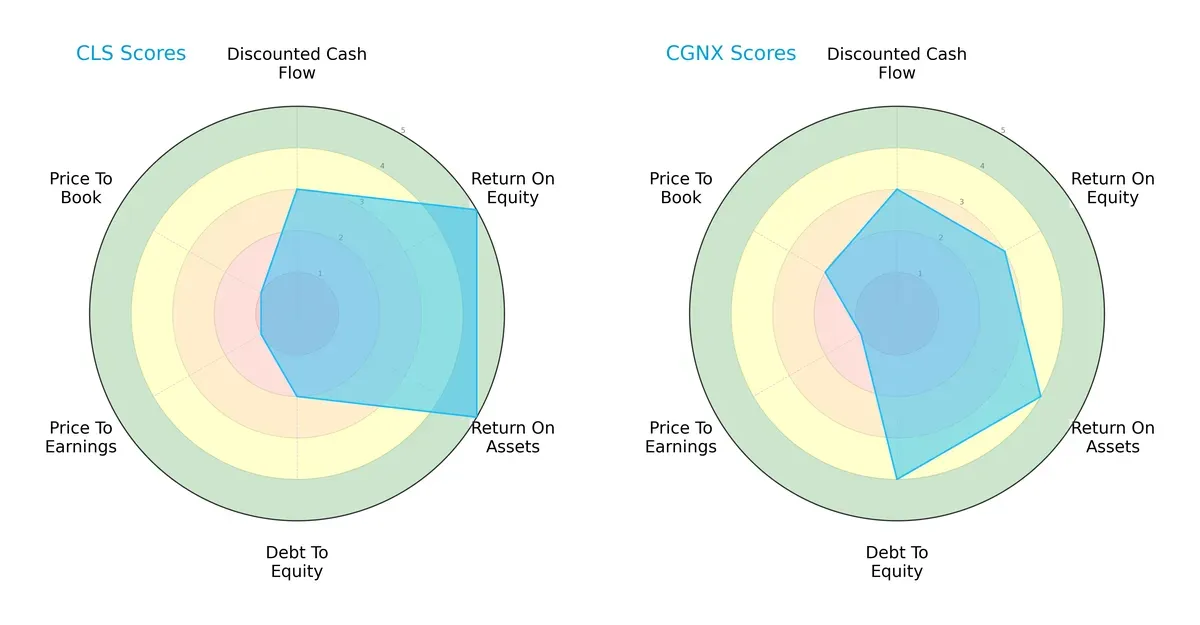
Celestica excels in return on equity (5) and assets (5), showing operational efficiency, but carries higher debt risk (2) and poor valuation scores (P/E 1, P/B 1). Cognex presents a more balanced profile with moderate ROE (3), strong debt management (4), and better valuation on book value (2). Celestica relies on operational prowess, while Cognex balances risk and valuation more effectively.
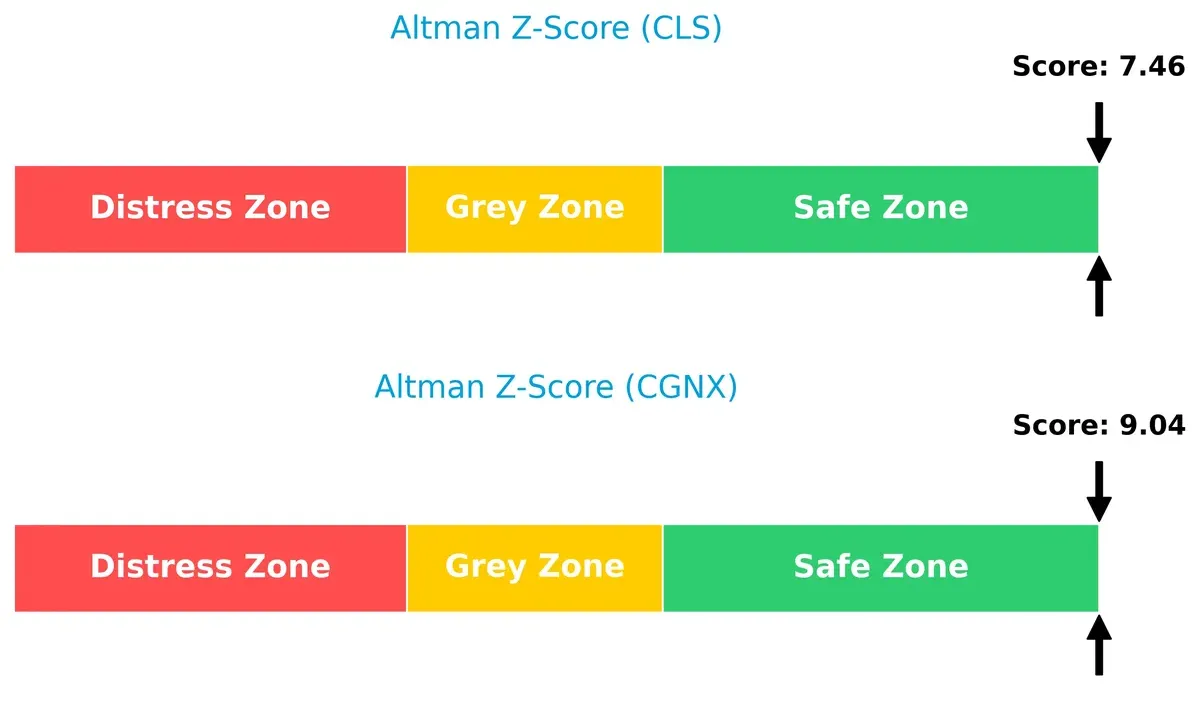
Bankruptcy Risk: Solvency Showdown
Celestica’s Altman Z-Score of 7.46 vs. Cognex’s 9.04 confirms both firms are in the safe zone but Cognex shows a stronger buffer for long-term survival in volatile cycles:
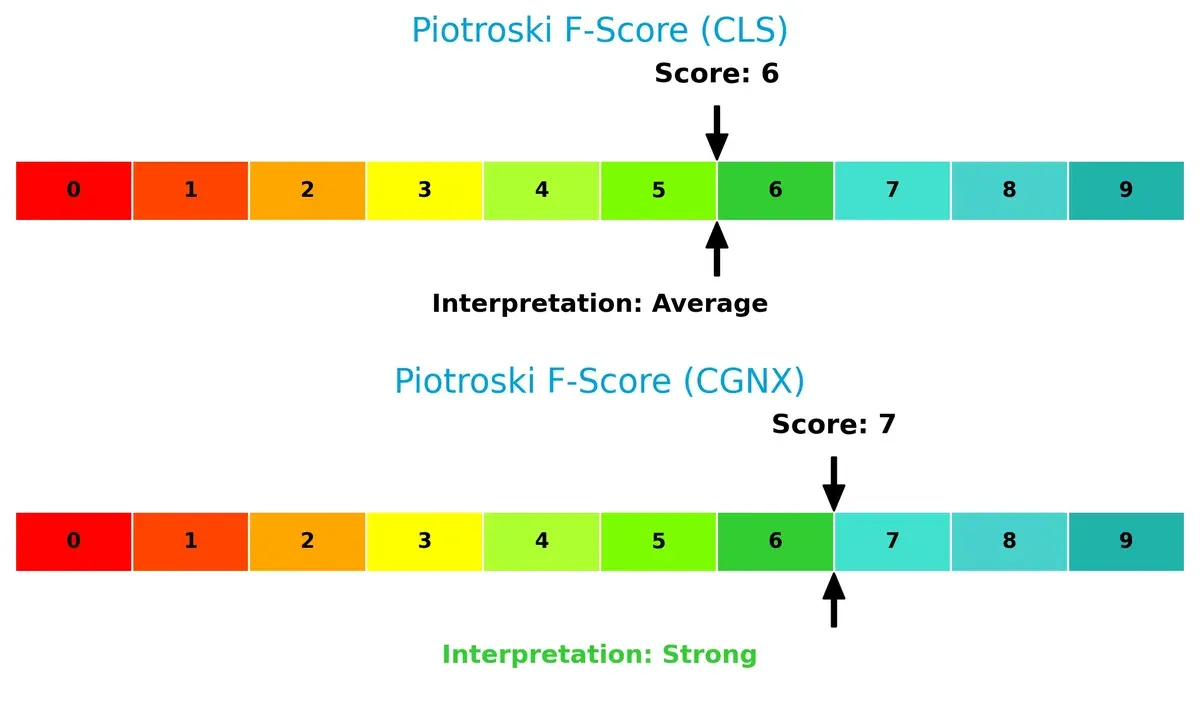
Financial Health: Quality of Operations
Cognex’s Piotroski score of 7 surpasses Celestica’s 6, indicating stronger financial health and fewer red flags in internal metrics. Both are above average, but Cognex edges ahead in operational quality:
How are the two companies positioned?
This section dissects the operational DNA of CLS and CGNX by comparing their revenue distribution and internal dynamics—strengths and weaknesses. The goal is to confront their economic moats to reveal which business model delivers the most resilient competitive edge today.
Revenue Segmentation: The Strategic Mix
This visual comparison dissects how Celestica Inc. and Cognex Corporation diversify income streams and where their primary sector bets lie:
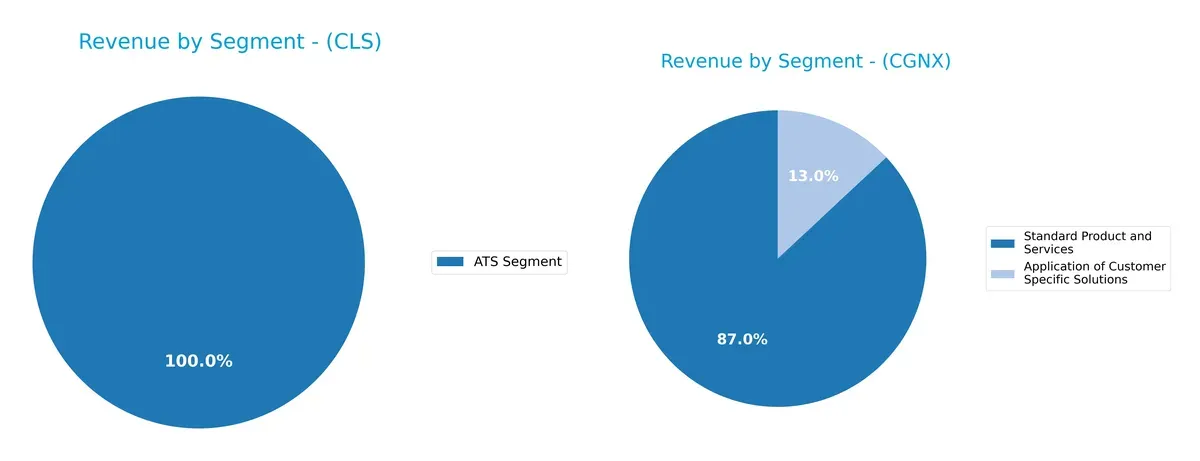
Celestica anchors its revenue with a massive $3.16B ATS Segment, showing concentrated exposure. Cognex presents a more balanced mix, with $795M from Standard Products and $119M from Customer Specific Solutions. Cognex’s diversification reduces concentration risk and supports niche innovation, while Celestica’s reliance on one segment signals infrastructure dominance but also heightens vulnerability to sector shifts.
Strengths and Weaknesses Comparison
This table compares the Strengths and Weaknesses of Celestica Inc. and Cognex Corporation:
Celestica Inc. Strengths
- Strong ROE at 22.57%
- Favorable debt-to-equity of 0.42
- High asset turnover at 1.61
- Robust fixed asset turnover of 14.58
Cognex Corporation Strengths
- High net margin at 11.61%
- Excellent quick ratio at 2.69
- Very low debt-to-assets at 3.52%
- Infinite interest coverage ratio
- Solid fixed asset turnover at 5.52
Celestica Inc. Weaknesses
- Low net margin at 4.44%
- Unfavorable P/E of 25.47 and P/B of 5.75
- No dividend yield
- Neutral current and quick ratios
- Missing ROIC and WACC data
Cognex Corporation Weaknesses
- Low ROE at 7.0%
- High P/E of 57.9 and P/B of 4.05
- Unfavorable current ratio at 3.62
- Unfavorable asset turnover at 0.46
- No dividend yield despite positive margin
Overall, Celestica shows stronger profitability on equity and asset efficiency but lacks dividend returns. Cognex delivers higher operational margins and liquidity but struggles with return on equity and valuation multiples. Each company’s financial profile suggests distinct strategic priorities and risk exposures.
The Moat Duel: Analyzing Competitive Defensibility
A structural moat is the only true defense against competitors eroding long-term profits. Let’s dissect the moats of Celestica Inc. and Cognex Corporation:
Celestica Inc.: Operational Excellence and Supply Chain Integration
Celestica’s primary moat stems from cost advantage and supply chain mastery. High revenue growth and expanding net margins reflect efficient capital use. In 2026, scaling advanced tech solutions could deepen this edge.
Cognex Corporation: Intellectual Property and Specialized Vision Systems
Cognex relies on intangible assets—patented machine vision technology—that differentiate it from Celestica’s cost-driven model. However, declining ROIC and net income warn of weakening moat durability. Opportunities lie in deep learning vision software expansion.
Cost Leadership vs. Intellectual Property Innovation
Celestica’s growing ROIC and strong margin expansion give it a wider, more durable moat than Cognex, which is currently value-destructive. Celestica stands better equipped to defend market share amid intensifying technology competition.
Which stock offers better returns?
The past year saw Celestica Inc. post a strong overall price surge despite recent downward pressure, while Cognex Corporation experienced a steady but negative trend with signs of recent recovery.
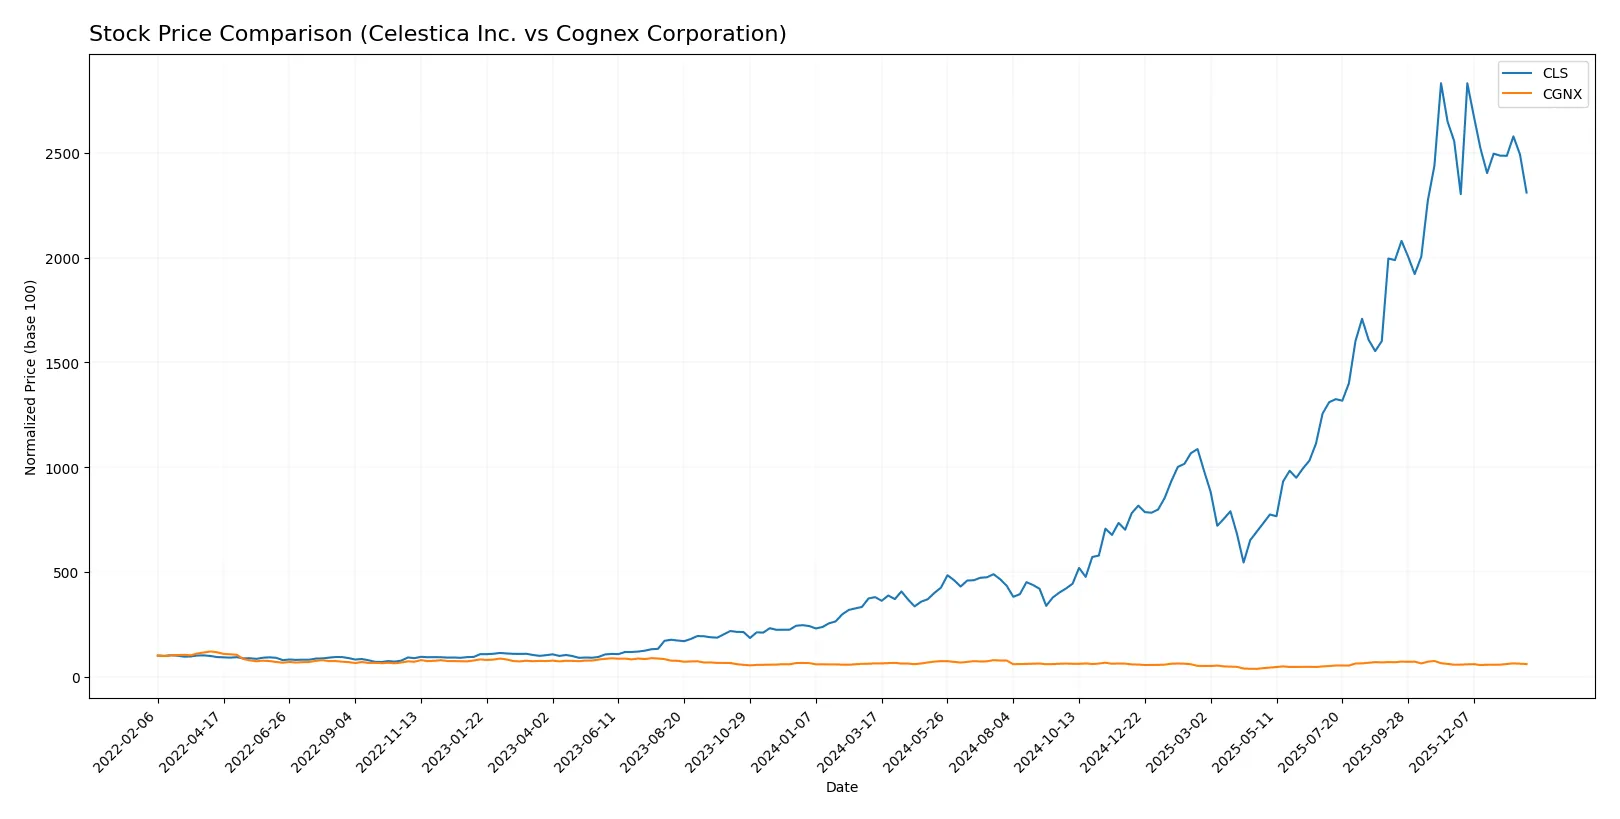
Trend Comparison
Celestica Inc. gained 509.52% over the past 12 months, confirming a bullish trend with decelerating momentum. It hit a high of 344.48 and a low of 40.73, showing significant volatility with a 92.63 standard deviation.
Cognex Corporation declined 5.37% over the year, marking a bearish trend with accelerating negative momentum. Its price ranged from 23.77 to 50.98, with low volatility at a 5.92 standard deviation.
Celestica clearly outperformed Cognex, delivering the highest market return despite recent minor declines, while Cognex showed modest recovery but remains overall negative.
Target Prices
Analysts present a mixed but generally optimistic target consensus for Celestica Inc. and Cognex Corporation.
| Company | Target Low | Target High | Consensus |
|---|---|---|---|
| Celestica Inc. | 300 | 440 | 365.6 |
| Cognex Corporation | 38 | 58 | 48.14 |
Celestica’s target consensus sits roughly 30% above its current price of 281, signaling upside potential. Cognex’s consensus target also exceeds its 38.74 share price, suggesting moderate growth expectations.

Don’t Let Luck Decide Your Entry Point
Optimize your entry points with our advanced ProRealTime indicators. You’ll get efficient buy signals with precise price targets for maximum performance. Start outperforming now!
How do institutions grade them?
Celestica Inc. Grades
The following table summarizes recent institutional grades for Celestica Inc.:
| Grading Company | Action | New Grade | Date |
|---|---|---|---|
| Citigroup | Maintain | Buy | 2026-01-30 |
| Barclays | Maintain | Overweight | 2026-01-30 |
| Goldman Sachs | Maintain | Buy | 2025-12-01 |
| Barclays | Maintain | Overweight | 2025-11-14 |
| Citigroup | Upgrade | Buy | 2025-11-10 |
| Goldman Sachs | Maintain | Buy | 2025-10-29 |
| CIBC | Maintain | Outperform | 2025-10-29 |
| Stifel | Maintain | Buy | 2025-10-29 |
| Barclays | Maintain | Overweight | 2025-10-29 |
| JP Morgan | Maintain | Overweight | 2025-10-29 |
Cognex Corporation Grades
The following table summarizes recent institutional grades for Cognex Corporation:
| Grading Company | Action | New Grade | Date |
|---|---|---|---|
| Barclays | Maintain | Overweight | 2026-01-12 |
| Truist Securities | Maintain | Hold | 2025-12-18 |
| Goldman Sachs | Upgrade | Buy | 2025-12-16 |
| JP Morgan | Downgrade | Underweight | 2025-12-03 |
| DA Davidson | Maintain | Neutral | 2025-11-03 |
| Barclays | Maintain | Overweight | 2025-10-31 |
| Baird | Maintain | Neutral | 2025-10-31 |
| Needham | Maintain | Buy | 2025-10-31 |
| Truist Securities | Maintain | Hold | 2025-10-08 |
| Goldman Sachs | Maintain | Sell | 2025-09-16 |
Which company has the best grades?
Celestica holds consistently strong grades, mostly Buy and Overweight, with no sell ratings. Cognex shows mixed ratings, including Buy and Overweight but also Hold, Neutral, and a Sell. Celestica’s steadier grades imply greater institutional confidence, which may affect investor sentiment positively.
Risks specific to each company
The following categories identify the critical pressure points and systemic threats facing both firms in the 2026 market environment:
1. Market & Competition
Celestica Inc.
- Faces intense competition in hardware manufacturing with pressure on net margins and valuation multiples.
Cognex Corporation
- Operates in a niche machine vision market but battles high P/E and P/B ratios signaling growth expectations risk.
2. Capital Structure & Debt
Celestica Inc.
- Maintains moderate leverage with favorable debt-to-equity and interest coverage ratios, supporting financial stability.
Cognex Corporation
- Very low debt levels and strong interest coverage reduce financial risk, but high current ratio may imply inefficient capital use.
3. Stock Volatility
Celestica Inc.
- Beta at 1.46 indicates above-market volatility, with a wide price range suggesting market sensitivity.
Cognex Corporation
- Slightly higher beta of 1.52 reflects elevated volatility typical for technology stocks in growth segments.
4. Regulatory & Legal
Celestica Inc.
- Exposed to cross-border regulatory complexities given multinational supply chain and technology product range.
Cognex Corporation
- Faces regulatory scrutiny around AI and automation products, with potential IP litigation risks in a competitive tech field.
5. Supply Chain & Operations
Celestica Inc.
- Relies on complex global supply chains vulnerable to disruption; asset turnover is robust, indicating operational efficiency.
Cognex Corporation
- Smaller scale but benefits from specialized manufacturing; lower asset turnover suggests operational constraints.
6. ESG & Climate Transition
Celestica Inc.
- Increasing pressure to decarbonize manufacturing; energy and aerospace sectors highlight transition risks.
Cognex Corporation
- Growing demand for sustainable automation solutions, but must address product lifecycle environmental impacts.
7. Geopolitical Exposure
Celestica Inc.
- High exposure to North America, Europe, and Asia entails geopolitical risks including trade tensions and tariffs.
Cognex Corporation
- Primarily U.S.-based but global sales subject to geopolitical shifts impacting supply chains and customer demand.
Which company shows a better risk-adjusted profile?
Celestica’s principal risk lies in market competition and margin compression amid volatile tech hardware cycles. Cognex faces valuation and operational efficiency challenges, but its balance sheet and Altman Z-score reflect stronger financial resilience. Cognex’s higher Piotroski score and safer liquidity position suggest a better risk-adjusted profile, despite growth valuation risks. Recent data highlight Celestica’s wider price volatility and margin pressure, underscoring caution in cyclical downturns.
Final Verdict: Which stock to choose?
Celestica Inc. (CLS) shines as a cash-generating machine with a strong upward trajectory in return on invested capital. Its improving profitability and efficient asset use reveal a company scaling value creation. The key point of vigilance lies in its modest liquidity and valuation metrics. CLS suits investors seeking aggressive growth backed by operational momentum.
Cognex Corporation (CGNX) boasts a strategic moat anchored in its dominant position in machine vision, supported by recurring revenue. It offers better liquidity and a safer balance sheet than CLS, appealing to those prioritizing financial stability. However, its declining profitability and high valuation suggest caution. CGNX fits well in a GARP portfolio balancing growth with risk control.
If you prioritize aggressive growth and capital efficiency, CLS is the compelling choice due to its rising ROIC and strong earnings expansion. However, if you seek more stability and a durable competitive moat, CGNX offers better financial safety despite its value challenges. Each company appeals to distinct investor profiles, demanding careful alignment with your risk tolerance and strategy.
Disclaimer: Investment carries a risk of loss of initial capital. The past performance is not a reliable indicator of future results. Be sure to understand risks before making an investment decision.
Go Further
I encourage you to read the complete analyses of Celestica Inc. and Cognex Corporation to enhance your investment decisions: