Home > Comparison > Technology > WIT vs CDW
The strategic rivalry between Wipro Limited and CDW Corporation shapes the evolving landscape of the global technology sector. Wipro operates as a capital-intensive IT services conglomerate with a broad consulting and product portfolio, while CDW focuses on high-margin IT solutions and hardware distribution primarily across North America. This analysis pits Wipro’s diversified model against CDW’s integrated service approach to identify which offers superior risk-adjusted returns for a diversified portfolio.
Table of contents
Companies Overview
Wipro Limited and CDW Corporation stand as key players reshaping global IT services and solutions markets.
Wipro Limited: Global IT & Consulting Powerhouse
Wipro Limited commands a diverse IT services portfolio spanning digital strategy, cloud, and infrastructure. Its core revenue derives from IT services, IT products, and Indian government enterprise contracts. In 2026, Wipro sharpens its focus on integrated digital transformation and expanding cloud capabilities across multiple industries.
CDW Corporation: North American IT Solutions Specialist
CDW Corporation excels as a leading IT solutions provider in the US, UK, and Canada. Its revenue engine combines hardware, software, and integrated IT services with emphasis on hybrid and cloud environments. The company’s 2026 strategy prioritizes delivering tailored IT solutions for corporate, public, and small business sectors, emphasizing security and digital workspace innovation.
Strategic Collision: Similarities & Divergences
Both companies emphasize technology services but diverge sharply in approach: Wipro leverages a broad global footprint and government contracts, while CDW focuses on North American enterprise IT solutions. They compete primarily in cloud, security, and digital workspace markets. Wipro offers scale and diversity, whereas CDW’s strength lies in specialized, high-touch customer engagement. Their distinct investment profiles reflect contrasting risk and growth dynamics.
Income Statement Comparison
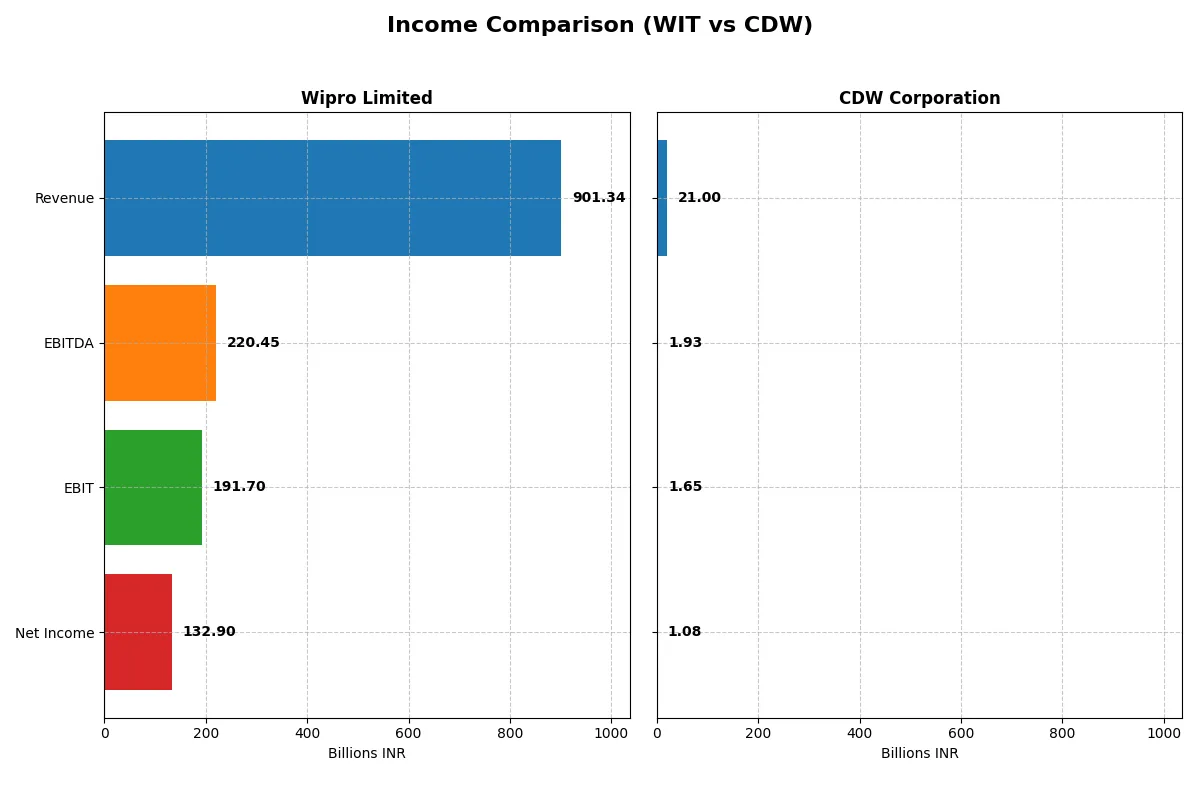
This data dissects the core profitability and scalability of both corporate engines to reveal who dominates the bottom line:
| Metric | Wipro Limited (WIT) | CDW Corporation (CDW) |
|---|---|---|
| Revenue | 901.3B INR | 21.0B USD |
| Cost of Revenue | 625.1B INR | 16.4B USD |
| Operating Expenses | 122.7B INR | 2.95B USD |
| Gross Profit | 276.3B INR | 4.60B USD |
| EBITDA | 220.5B INR | 1.93B USD |
| EBIT | 191.7B INR | 1.65B USD |
| Interest Expense | 14.9B INR | 0.21B USD |
| Net Income | 132.9B INR | 1.08B USD |
| EPS | 12.56 INR | 8.06 USD |
| Fiscal Year | 2025 | 2024 |
Income Statement Analysis: The Bottom-Line Duel
Comparing these income statements reveals which company runs a more efficient and profitable corporate engine through recent market cycles.
Wipro Limited Analysis
Wipro’s revenue hovered near 900B INR in 2025, showing a slight decline but sustained high gross profits around 276B INR. Its gross margin stayed favorable at 30.65%, and net income rose 20% year-over-year to 133B INR. The company improved operating efficiency, with EBIT margin expanding to 21.3%, signaling strong momentum despite flat top-line growth.
CDW Corporation Analysis
CDW’s revenue slipped 1.8% to $21B in 2024, dragging gross profit down to $4.6B but maintaining a solid 21.9% gross margin. Net income fell slightly to $1.08B, reducing net margin to 5.1%. EBIT margin remained modest at 7.9%, reflecting cost pressures. Overall, CDW experienced a minor contraction in profitability and efficiency over the last year.
Margin Strength vs. Revenue Momentum
Wipro clearly outpaces CDW in margin expansion and net income growth despite flat revenue. Wipro’s superior gross and EBIT margins underscore a more robust cost structure. CDW shows resilience in revenue growth over the longer term but struggles with margin compression recently. For investors, Wipro’s profile offers stronger profitability and efficiency, appealing more to those prioritizing margin power.
Financial Ratios Comparison
These vital ratios act as a diagnostic tool to expose the underlying fiscal health, valuation premiums, and capital efficiency of the companies compared below:
| Ratios | Wipro Limited (WIT) | CDW Corporation (CDW) |
|---|---|---|
| ROE | 16.0% | 45.8% |
| ROIC | 10.5% | 13.1% |
| P/E | 20.6 | 21.6 |
| P/B | 3.30 | 9.90 |
| Current Ratio | 2.72 | 1.35 |
| Quick Ratio | 2.71 | 1.24 |
| D/E | 0.23 | 2.55 |
| Debt-to-Assets | 15.0% | 40.8% |
| Interest Coverage | 10.3 | 7.7 |
| Asset Turnover | 0.70 | 1.43 |
| Fixed Asset Turnover | 8.48 | 67.3 |
| Payout ratio | 47.2% | 30.8% |
| Dividend yield | 2.29% | 1.43% |
| Fiscal Year | 2025 | 2024 |
Efficiency & Valuation Duel: The Vital Signs
Financial ratios serve as a company’s DNA, exposing hidden risks and revealing operational strengths that shape investment decisions.
Wipro Limited
Wipro shows solid profitability with a 16.04% ROE and a favorable net margin of 14.74%. Its P/E of 20.6 sits at a neutral valuation, while a high P/B of 3.3 raises concerns. The company balances efficiency and shareholder returns with a 2.29% dividend yield, reflecting steady cash flow and prudent capital allocation.
CDW Corporation
CDW posts a remarkable 45.81% ROE but a modest net margin of 5.13%, suggesting high leverage and margin pressure. Its P/E of 21.61 aligns with market norms, but a stretched P/B at 9.9 signals premium pricing. The dividend yield is moderate at 1.43%, with reinvestment likely focused on sustaining growth amid elevated debt levels.
Premium Valuation vs. Operational Safety
Wipro offers a very favorable ratio profile with balanced profitability and strong liquidity, while CDW’s metrics reflect higher operational risk due to leverage and valuation stretch. Investors seeking stability may prefer Wipro’s prudent capital structure; those chasing growth might tolerate CDW’s elevated risk for potential returns.
Which one offers the Superior Shareholder Reward?
I compare Wipro Limited (WIT) and CDW Corporation (CDW) on dividends, payout ratios, and buybacks to determine the superior shareholder reward. WIT yields 2.29% with a payout ratio near 47%, signaling strong free cash flow coverage and a balanced distribution. CDW offers a 1.43% yield and a 31% payout ratio but carries heavier debt, limiting buyback flexibility. WIT’s consistent buybacks and robust cash ratios support sustainable returns. CDW’s high leverage and modest free cash flow coverage constrain total return potential. I conclude Wipro delivers a more attractive and sustainable total shareholder return profile in 2026.
Comparative Score Analysis: The Strategic Profile
The radar chart reveals the fundamental DNA and trade-offs of Wipro Limited and CDW Corporation, highlighting their core financial strengths and weaknesses:
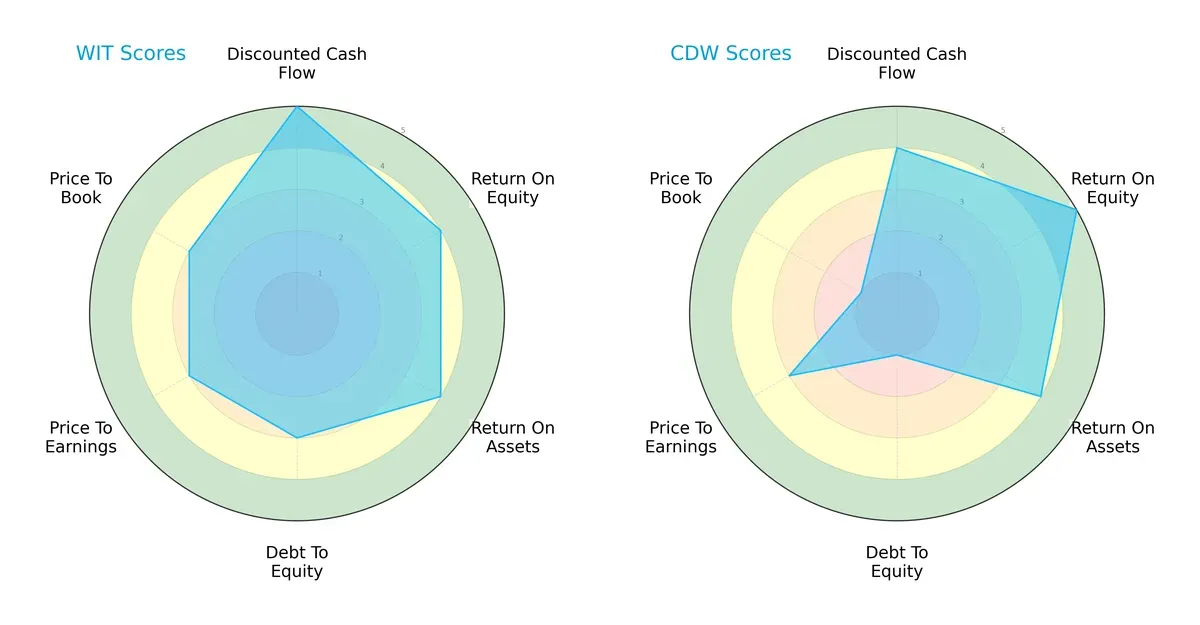
Wipro shows a balanced profile with strong DCF (5) and solid ROE (4) and ROA (4) scores, indicating efficient capital allocation and asset use. CDW excels in ROE (5) but suffers from weak debt-to-equity (1) and price-to-book (1) metrics, signaling higher financial risk and possible valuation concerns. Wipro’s moderate leverage and valuation scores suggest a more stable investment stance, while CDW relies heavily on operational efficiency but accepts greater financial risk.
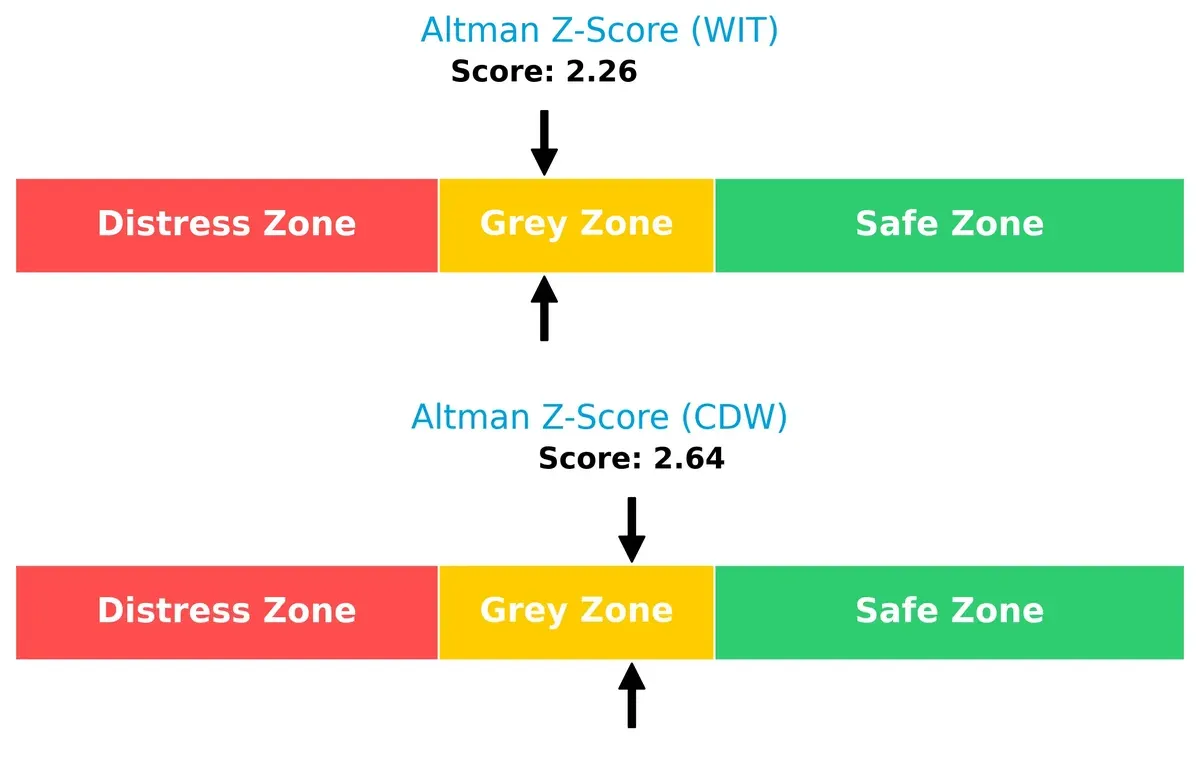
Bankruptcy Risk: Solvency Showdown
The Altman Z-Score comparison places both firms in the grey zone, but CDW’s higher score (2.64) versus Wipro’s (2.26) implies slightly better solvency and lower bankruptcy risk in this cycle:
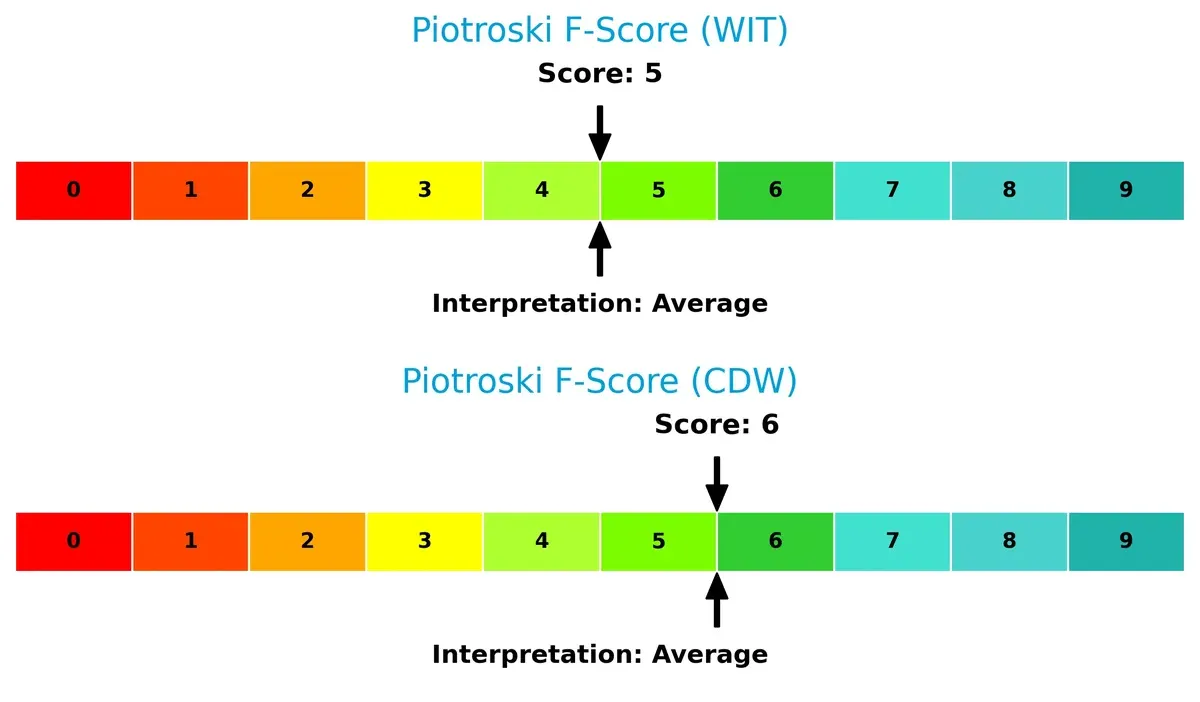
Financial Health: Quality of Operations
Wipro’s Piotroski F-Score of 5 versus CDW’s 6 indicates both firms maintain average financial health, but CDW shows marginally stronger internal metrics, with no glaring red flags:
How are the two companies positioned?
This section dissects the operational DNA of Wipro and CDW by comparing their revenue distribution and internal strengths and weaknesses. The objective is to confront their economic moats to identify which business model offers the most resilient and sustainable competitive advantage today.
Revenue Segmentation: The Strategic Mix
This visual comparison dissects how Wipro Limited and CDW Corporation diversify their income streams and where their primary sector bets lie:
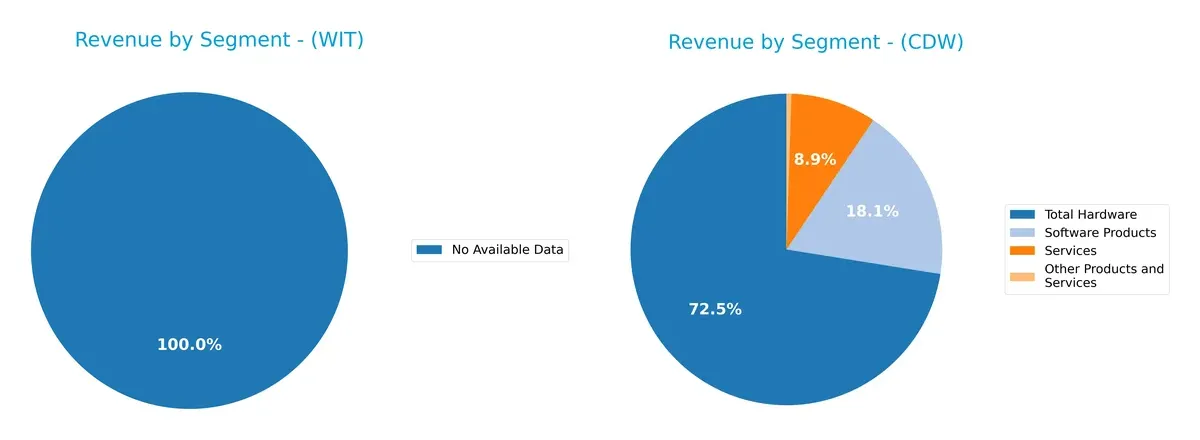
Wipro Limited lacks available segmentation data, limiting direct comparison. CDW Corporation relies heavily on its Total Hardware segment, which dwarfs Software Products ($15.2B vs. $3.8B in 2024). Services and Other Products play smaller roles. CDW’s concentration in hardware signals infrastructure dominance but raises concentration risk. Without Wipro’s mix, CDW’s strategy appears anchored in ecosystem lock-in through hardware sales.
Strengths and Weaknesses Comparison
This table compares the strengths and weaknesses of Wipro Limited and CDW Corporation:
Wipro Limited Strengths
- Strong profitability with 14.74% net margin
- Favorable ROE at 16.04%
- Low debt-to-equity ratio at 0.23
- High current and quick ratios indicate liquidity
- Favorable fixed asset turnover at 8.48
- Dividend yield of 2.29%
CDW Corporation Strengths
- Very high ROE at 45.81%
- Strong ROIC at 13.13% above WACC
- Favorable interest coverage at 7.69
- High asset turnover at 1.43
- Diversified revenue across hardware, software, and services
- Significant US market presence with $18.5B revenue
Wipro Limited Weaknesses
- Unfavorable price-to-book ratio at 3.3
- Neutral P/E ratio at 20.6
- Moderate asset turnover at 0.7
- Limited disclosed product and geographic diversification data
CDW Corporation Weaknesses
- High debt-to-equity ratio at 2.55 indicates leverage risk
- Unfavorable price-to-book ratio at 9.9
- Neutral current ratio at 1.35 may constrain liquidity
- Lower net margin at 5.13% despite high ROE
- Lower dividend yield at 1.43%
Both companies show financial strengths but differ in leverage and profitability profiles. Wipro’s superior liquidity and conservative debt contrast with CDW’s high ROE and diversified revenues. CDW’s leverage and margin weakness highlight risks to monitor.
The Moat Duel: Analyzing Competitive Defensibility
A structural moat is the only reliable shield protecting long-term profits from relentless competitive erosion:
Wipro Limited: Cost Advantage Through Scale and Diversification
Wipro’s moat stems from its vast scale and diversified IT services portfolio. This drives steady 21% EBIT margins and 15% net margins. Declining ROIC signals pressure, but new digital offerings in emerging markets could deepen its cost edge by 2026.
CDW Corporation: Integrated Solutions with Customer Lock-in
CDW leverages integrated IT solutions and strong client relationships, creating switching costs distinct from Wipro’s scale. Despite lower EBIT margins near 8%, CDW sustains value with a 5.8% ROIC premium over WACC. Expansion into hybrid cloud services may widen its moat.
Scale Efficiency vs. Client Integration: The Competitive Moat Face-off
Both firms create value with ROIC exceeding WACC, yet Wipro’s scale advantage faces erosion while CDW’s client lock-in offers a stickier moat. I see CDW better positioned to defend market share amid evolving technology demands.
Which stock offers better returns?
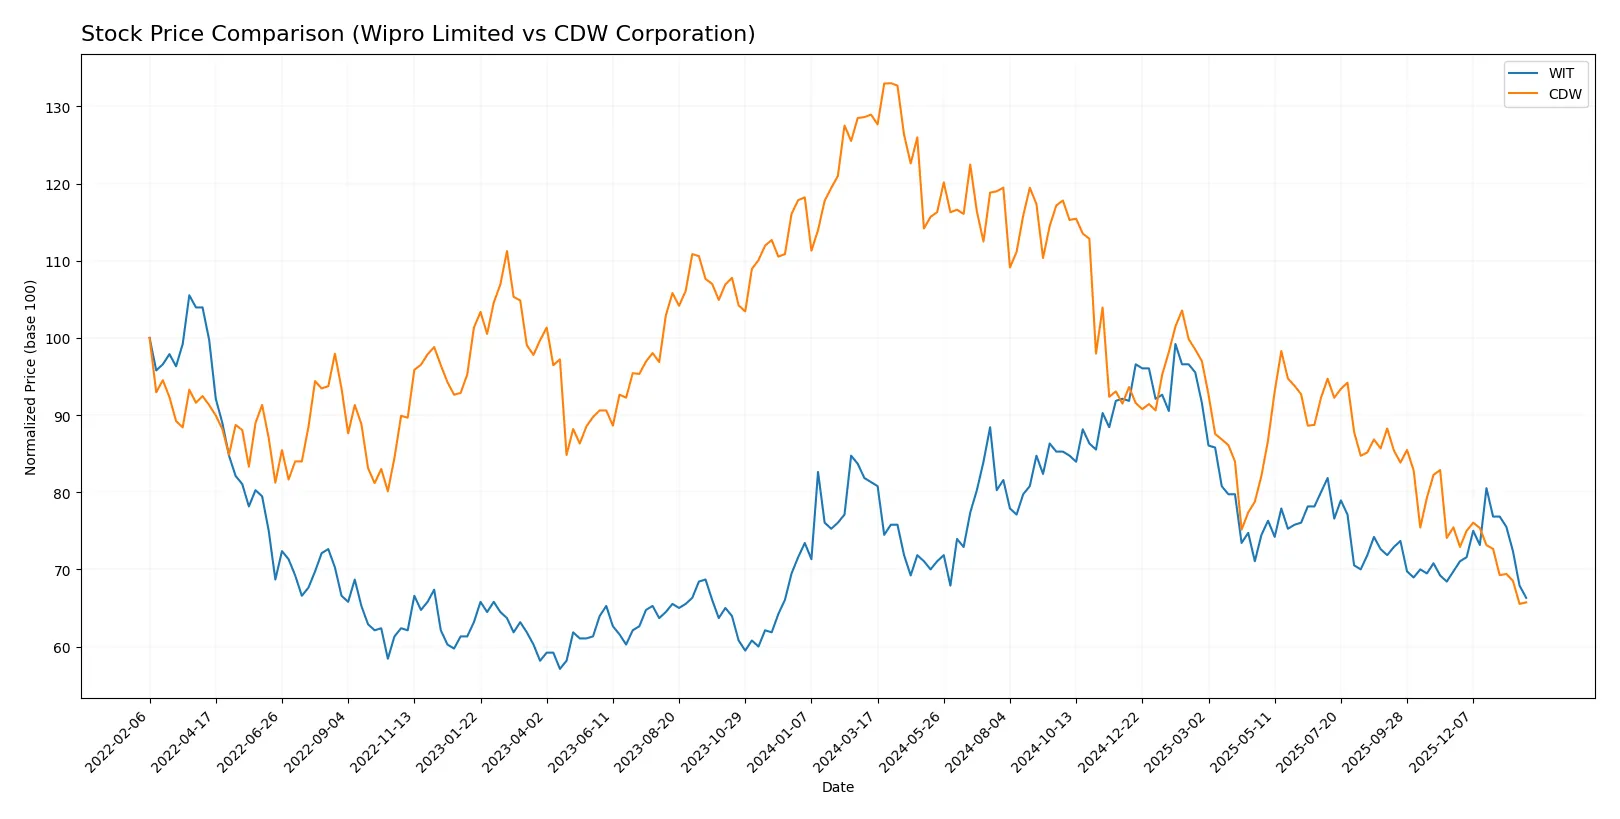
Over the past 12 months, Wipro Limited and CDW Corporation both experienced significant price declines, with Wipro showing a milder bearish trend compared to CDW’s steep drop.
Trend Comparison
Wipro Limited’s stock declined 18.45% over the past year, indicating a bearish trend with decelerating losses and moderate volatility (0.31 std deviation). The price ranged between 2.52 and 3.77.
CDW Corporation’s stock fell 49.03%, confirming a strong bearish trend marked by deceleration and very high volatility (34.02 std deviation). Its price fluctuated between 126.0 and 255.78.
Comparing trends, Wipro Limited outperformed CDW Corporation in market performance, showing a smaller decline and lower volatility over the last year.
Target Prices
Analysts show a strong upside consensus for Wipro Limited and CDW Corporation.
| Company | Target Low | Target High | Consensus |
|---|---|---|---|
| Wipro Limited | 7.0 | 7.7 | 7.35 |
| CDW Corporation | 141 | 190 | 168.8 |
Wipro’s consensus target exceeds its current 2.52 price by nearly threefold, signaling high growth expectations. CDW’s consensus target also surpasses its 126.39 price, implying moderate appreciation potential.

Don’t Let Luck Decide Your Entry Point
Optimize your entry points with our advanced ProRealTime indicators. You’ll get efficient buy signals with precise price targets for maximum performance. Start outperforming now!
How do institutions grade them?
Here are the recent institutional grades for Wipro Limited and CDW Corporation:
Wipro Limited Grades
The following table summarizes recent grades issued by recognized financial institutions for Wipro Limited.
| Grading Company | Action | New Grade | Date |
|---|---|---|---|
| UBS | Upgrade | Neutral | 2025-01-02 |
| Wedbush | Maintain | Underperform | 2024-01-16 |
| JP Morgan | Maintain | Underweight | 2023-05-24 |
| Bernstein | Downgrade | Underperform | 2023-03-22 |
| Bernstein | Downgrade | Underperform | 2023-03-21 |
| Goldman Sachs | Upgrade | Buy | 2022-09-13 |
| Goldman Sachs | Upgrade | Buy | 2022-09-12 |
| Morgan Stanley | Downgrade | Underweight | 2022-07-14 |
| Morgan Stanley | Downgrade | Underweight | 2022-07-13 |
| Macquarie | Upgrade | Outperform | 2022-06-02 |
CDW Corporation Grades
Below are recent grades from established financial firms for CDW Corporation.
| Grading Company | Action | New Grade | Date |
|---|---|---|---|
| Morgan Stanley | Downgrade | Equal Weight | 2026-01-20 |
| Citigroup | Maintain | Neutral | 2026-01-20 |
| Morgan Stanley | Maintain | Overweight | 2025-12-17 |
| Raymond James | Upgrade | Strong Buy | 2025-11-25 |
| UBS | Maintain | Buy | 2025-11-05 |
| Barclays | Maintain | Equal Weight | 2025-11-05 |
| Evercore ISI Group | Maintain | Outperform | 2025-10-20 |
| UBS | Maintain | Buy | 2025-08-07 |
| Barclays | Maintain | Equal Weight | 2025-08-07 |
| JP Morgan | Maintain | Neutral | 2025-07-17 |
Which company has the best grades?
CDW Corporation generally receives higher and more consistent grades, including multiple Buy, Outperform, and Strong Buy ratings. Wipro Limited exhibits a mixed pattern, with several Underperform and Underweight grades despite some Buy upgrades. Investors may view CDW’s stronger grades as a signal of greater institutional confidence.
Risks specific to each company
The following categories identify critical pressure points and systemic threats facing Wipro Limited and CDW Corporation in the 2026 market environment:
1. Market & Competition
Wipro Limited
- Operates globally with diverse IT services, facing intense competition in digital and cloud segments.
CDW Corporation
- Strong US, UK, Canada presence, competing in hardware/software distribution and IT solutions markets.
2. Capital Structure & Debt
Wipro Limited
- Low debt-to-equity (0.23) indicates conservative leverage and financial stability.
CDW Corporation
- High debt-to-equity (2.55) signals significant leverage, raising financial risk.
3. Stock Volatility
Wipro Limited
- Beta of 0.555 suggests lower volatility and defensive stock behavior.
CDW Corporation
- Beta of 1.073 reflects moderate volatility, more sensitive to market swings.
4. Regulatory & Legal
Wipro Limited
- Exposure to Indian government regulations and compliance in IT services to public sector.
CDW Corporation
- Subject to US, UK, and Canadian regulatory frameworks, including data privacy and trade laws.
5. Supply Chain & Operations
Wipro Limited
- Complex global delivery model risks disruptions, but diversified IT services mitigate single points of failure.
CDW Corporation
- Supply chain dependent on third-party distributors and manufacturers, vulnerable to hardware shortages.
6. ESG & Climate Transition
Wipro Limited
- Focuses on sustainable IT services and energy-efficient operations, aligning with global ESG trends.
CDW Corporation
- Increasing pressure to improve carbon footprint and sustainable sourcing in hardware distribution.
7. Geopolitical Exposure
Wipro Limited
- Significant India-centric operations exposed to regional geopolitical tensions and policy shifts.
CDW Corporation
- Primarily North American operations, impacted by US-China trade relations and transatlantic policies.
Which company shows a better risk-adjusted profile?
Wipro’s most impactful risk is its geopolitical exposure in India, a complex and evolving environment. CDW’s largest concern is its high debt load, which strains financial flexibility. Overall, Wipro shows a better risk-adjusted profile with lower leverage and reduced stock volatility. CDW’s elevated debt-to-equity ratio and moderate volatility increase its financial and market risks, despite strong operational metrics. Wipro’s favorable liquidity ratios and conservative capital structure justify my cautious preference amid 2026 uncertainties.
Final Verdict: Which stock to choose?
Wipro Limited’s superpower lies in its disciplined capital allocation and solid balance sheet, delivering consistent value creation despite a slight decline in profitability. Its robust liquidity and moderate leverage make it a dependable choice. This stock suits portfolios targeting steady, long-term growth with moderate risk tolerance.
CDW Corporation commands a strategic moat through its strong return on equity and operational efficiency, supported by a resilient recurring revenue model. However, higher leverage and a more volatile cash flow profile introduce caution. It fits best within portfolios seeking growth at a reasonable price but with a tolerance for balance sheet risk.
If you prioritize financial stability and conservative growth, Wipro outshines due to its healthier leverage and liquidity profile. However, if you seek higher returns anchored by operational excellence and can accept elevated financial risk, CDW offers better growth potential. Both present analytical scenarios tailored to different investor risk appetites and strategic aims.
Disclaimer: Investment carries a risk of loss of initial capital. The past performance is not a reliable indicator of future results. Be sure to understand risks before making an investment decision.
Go Further
I encourage you to read the complete analyses of Wipro Limited and CDW Corporation to enhance your investment decisions: