In the dynamic world of information technology services, CDW Corporation and Jack Henry & Associates, Inc. stand out as influential players with distinct yet overlapping market focuses. CDW excels in delivering comprehensive IT solutions across various sectors, while Jack Henry specializes in technology and payment processing for financial institutions. This article will explore their strategies and performance to help you identify which company offers the most compelling investment opportunity in 2026.

Table of contents
Companies Overview
I will begin the comparison between CDW Corporation and Jack Henry & Associates, Inc. by providing an overview of these two companies and their main differences.
CDW Corporation Overview
CDW Corporation delivers information technology solutions across the US, UK, and Canada, serving a diverse clientele including government, education, healthcare, and businesses of all sizes. Founded in 1984 and headquartered in Vernon Hills, Illinois, CDW offers a broad portfolio of hardware, software, and integrated IT services, including on-premise, hybrid, and cloud solutions. The company operates through Corporate, Small Business, and Public segments, emphasizing digital workspace and security capabilities.
Jack Henry & Associates, Inc. Overview
Jack Henry & Associates, Inc. is a US-based technology provider specializing in financial services solutions and payment processing, primarily for banks and credit unions. Established in 1976 and headquartered in Monett, Missouri, it operates four segments: Core, Payments, Complementary, and Corporate and Other. The company offers core data processing, digital banking, risk management, and electronic payment products under multiple brand names tailored to community banks, credit unions, and other financial institutions.
Key similarities and differences
Both CDW and Jack Henry operate in the Information Technology Services sector, focusing on providing technology solutions to specialized markets. CDW targets a broad array of industries with a wide hardware and software portfolio, while Jack Henry concentrates on financial services with specialized core processing and payment technologies. CDW’s business spans multiple regions and sectors, whereas Jack Henry’s operations are focused mainly on the US financial sector with distinct product brands.
Income Statement Comparison
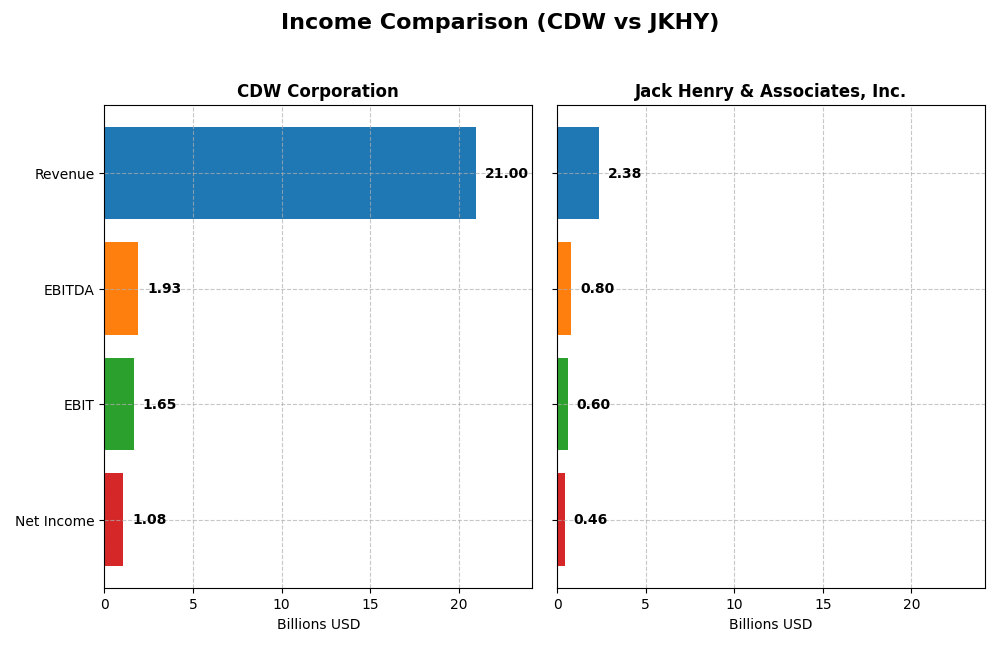
This table compares the most recent fiscal year income statement metrics for CDW Corporation and Jack Henry & Associates, Inc., highlighting key financial figures for informed analysis.
| Metric | CDW Corporation | Jack Henry & Associates, Inc. |
|---|---|---|
| Market Cap | 17.2B | 14.0B |
| Revenue | 21.0B | 2.38B |
| EBITDA | 1.93B | 801M |
| EBIT | 1.65B | 596M |
| Net Income | 1.08B | 456M |
| EPS | 8.06 | 6.24 |
| Fiscal Year | 2024 | 2025 |
Income Statement Interpretations
CDW Corporation
CDW’s revenue showed a 13.7% growth over 2020-2024 but declined by 1.77% in 2024, with net income growing 36.7% overall yet decreasing slightly in the latest year. Gross margin remained favorable at 21.92%, though EBIT margin was stable at 7.86%. The 2024 performance saw a slight dip in growth and margins, reflecting some short-term headwinds.
Jack Henry & Associates, Inc.
Jack Henry’s revenue increased 35.1% from 2021 to 2025 with a 7.2% rise in the latest year, alongside a 46.3% net income growth overall. It boasts strong margins, including a 42.71% gross margin and 25.11% EBIT margin. In 2025, growth accelerated, and margins improved, signaling robust operational efficiency and profitability trends.
Which one has the stronger fundamentals?
Jack Henry demonstrates stronger fundamentals with higher and improving margins, consistent revenue, and net income growth, all rated favorable. CDW shows solid overall growth but faces recent declines and more mixed margin stability. Jack Henry’s nearly unanimous positive income statement evaluations contrast with CDW’s blend of positive and negative indicators.
Financial Ratios Comparison
The table below compares key financial ratios for CDW Corporation and Jack Henry & Associates, Inc. using the most recent fiscal year data available to provide a snapshot of their performance and financial health.
| Ratios | CDW Corporation (2024) | Jack Henry & Associates, Inc. (2025) |
|---|---|---|
| ROE | 45.8% | 21.4% |
| ROIC | 13.1% | 17.6% |
| P/E | 21.6 | 28.9 |
| P/B | 9.90 | 6.18 |
| Current Ratio | 1.35 | 1.27 |
| Quick Ratio | 1.24 | 1.27 |
| D/E (Debt-to-Equity) | 2.55 | 0.00 (no debt) |
| Debt-to-Assets | 40.8% | 0.0% |
| Interest Coverage | 7.70 | 54.5 |
| Asset Turnover | 1.43 | 0.78 |
| Fixed Asset Turnover | 67.3 | 10.7 |
| Payout ratio | 30.8% | 36.1% |
| Dividend yield | 1.43% | 1.25% |
Interpretation of the Ratios
CDW Corporation
CDW shows a slightly favorable overall ratio profile with strengths in return on equity (45.81%) and return on invested capital (13.13%), alongside a solid interest coverage of 7.69. However, its high price-to-book ratio (9.9) and debt-to-equity of 2.55 raise caution. The dividend yield stands at 1.43%, reflecting moderate shareholder returns with no apparent risk of unsustainable payouts.
Jack Henry & Associates, Inc.
Jack Henry presents a favorable ratio mix, notably with a strong net margin (19.19%) and interest coverage (57.14), and zero debt-to-equity, indicating low financial leverage. The price-to-earnings and price-to-book ratios are less attractive. Its dividend yield is 1.25%, supported by consistent profitability and cash flow, suggesting stable shareholder returns without excessive distribution risks.
Which one has the best ratios?
Jack Henry demonstrates more favorable ratios overall, especially in profitability, leverage, and coverage metrics, compared to CDW’s slightly favorable standing. While CDW has a higher return on equity, Jack Henry’s lower debt levels and stronger margins contribute to a more balanced and financially stable profile in this comparison.
Strategic Positioning
This section compares the strategic positioning of CDW and JKHY, including their market position, key segments, and exposure to technological disruption:
CDW Corporation
- Leading IT services provider in the US, UK, Canada with moderate competitive pressure.
- Diverse segments: Corporate, Small Business, Public; hardware, software, and services drive revenue.
- Moderate exposure through integration of on-premise, hybrid, and cloud IT solutions.
Jack Henry & Associates, Inc.
- Focuses on US financial services technology with less beta volatility.
- Segments include Core, Payments, Complementary; focused on banking and credit unions.
- Exposure centered on financial tech innovation and payment processing services.
CDW vs JKHY Positioning
CDW pursues a diversified approach across multiple IT segments and geographies, leveraging hardware and software sales. JKHY concentrates on financial technology solutions, specializing in banking systems and payments. CDW’s breadth offers wider market coverage, while JKHY’s focus targets niche financial markets.
Which has the best competitive advantage?
JKHY exhibits a very favorable moat with growing ROIC, signaling durable competitive advantage and increasing profitability. CDW’s moat is slightly favorable, creating value but with declining profitability, indicating less stability in competitive advantage.
Stock Comparison
The past year has exhibited contrasting stock price dynamics between CDW Corporation and Jack Henry & Associates, Inc., with CDW showing a significant bearish trend and Jack Henry demonstrating accelerating bullish momentum.

Trend Analysis
CDW Corporation’s stock declined sharply by 46.52% over the past 12 months, reflecting a bearish trend with decelerating losses. The price fluctuated widely, reaching a high of 255.78 and a low of 132.16, accompanied by high volatility (std deviation 33.89). Recent months continued this negative trajectory, with a 17.07% drop.
Jack Henry & Associates, Inc. showed a 9.46% gain over the same period, signaling a bullish trend with accelerating upward momentum. Its stock traded between 146.26 and 192.6, with moderate volatility (std deviation 9.15). The recent 2.5-month period saw a sharp 29.31% increase, confirming strong buyer dominance.
Comparing both, Jack Henry & Associates, Inc. outperformed CDW Corporation, delivering positive returns while CDW experienced substantial losses, making Jack Henry the higher market performer over the past year.
Target Prices
Analysts present a positive consensus on target prices for CDW Corporation and Jack Henry & Associates, Inc.
| Company | Target High | Target Low | Consensus |
|---|---|---|---|
| CDW Corporation | 190 | 148 | 175 |
| Jack Henry & Associates, Inc. | 220 | 161 | 196 |
The consensus targets for both companies exceed their current stock prices, indicating analysts expect upside potential. CDW’s consensus is significantly above its $132 current price, and Jack Henry’s target near $196 compares favorably to its $193 price.
Analyst Opinions Comparison
This section compares analysts’ ratings and grades for CDW Corporation and Jack Henry & Associates, Inc.:
Rating Comparison
CDW Rating
- Rating: B, assessed as very favorable by analysts.
- Discounted Cash Flow Score: 4, indicating a favorable valuation based on future cash flows.
- ROE Score: 5, a very favorable measure of profit generation from shareholders’ equity.
- ROA Score: 4, favorable use of assets to generate earnings.
- Debt To Equity Score: 1, very unfavorable, indicating high financial risk due to leverage.
- Overall Score: 3, moderate overall financial standing.
JKHY Rating
- Rating: A-, also considered very favorable.
- Discounted Cash Flow Score: 4, similarly favorable for valuation.
- ROE Score: 4, favorable but slightly lower efficiency in equity profit generation.
- ROA Score: 5, very favorable and more effective asset utilization than CDW.
- Debt To Equity Score: 4, favorable, showing better financial stability with lower debt reliance.
- Overall Score: 4, favorable overall assessment by analysts.
Which one is the best rated?
Jack Henry & Associates, Inc. holds a stronger overall rating with an A- and a favorable overall score of 4, compared to CDW’s B rating and moderate overall score of 3. JKHY also shows better financial stability and asset efficiency.
Scores Comparison
Here is a comparison of the Altman Z-Score and Piotroski Score for both companies:
CDW Scores
- Altman Z-Score: 2.68, indicating a grey zone risk.
- Piotroski Score: 6, classified as average financial strength.
JKHY Scores
- Altman Z-Score: 12.58, indicating a safe zone status.
- Piotroski Score: 8, classified as very strong financial strength.
Which company has the best scores?
Based on the provided data, JKHY shows a significantly stronger financial position with a high Altman Z-Score in the safe zone and a very strong Piotroski Score, compared to CDW’s moderate grey zone and average Piotroski Score.
Grades Comparison
Here is the grades comparison for CDW Corporation and Jack Henry & Associates, Inc.:
CDW Corporation Grades
The following table summarizes the latest grades from established grading companies for CDW Corporation:
| Grading Company | Action | New Grade | Date |
|---|---|---|---|
| Morgan Stanley | Maintain | Overweight | 2025-12-17 |
| Raymond James | Upgrade | Strong Buy | 2025-11-25 |
| Barclays | Maintain | Equal Weight | 2025-11-05 |
| UBS | Maintain | Buy | 2025-11-05 |
| Evercore ISI Group | Maintain | Outperform | 2025-10-20 |
| UBS | Maintain | Buy | 2025-08-07 |
| Barclays | Maintain | Equal Weight | 2025-08-07 |
| JP Morgan | Maintain | Neutral | 2025-07-17 |
| Citigroup | Maintain | Neutral | 2025-07-11 |
| Barclays | Maintain | Equal Weight | 2025-05-08 |
Overall, CDW Corporation’s grades indicate a predominantly positive outlook, with several buy and outperform ratings and only a few neutral or equal weight assessments.
Jack Henry & Associates, Inc. Grades
The following table presents the latest grades from recognized grading companies for Jack Henry & Associates, Inc.:
| Grading Company | Action | New Grade | Date |
|---|---|---|---|
| Wolfe Research | Upgrade | Outperform | 2026-01-08 |
| UBS | Maintain | Neutral | 2026-01-08 |
| RBC Capital | Upgrade | Outperform | 2025-12-16 |
| Baird | Maintain | Neutral | 2025-12-15 |
| Keefe, Bruyette & Woods | Upgrade | Outperform | 2025-12-08 |
| Goldman Sachs | Maintain | Neutral | 2025-11-07 |
| Wells Fargo | Maintain | Equal Weight | 2025-11-06 |
| Compass Point | Upgrade | Buy | 2025-11-06 |
| DA Davidson | Maintain | Buy | 2025-10-29 |
| Goldman Sachs | Maintain | Neutral | 2025-10-13 |
Jack Henry & Associates shows a generally constructive grading trend, with multiple upgrades to outperform and buy ratings, balanced by a number of neutral and equal weight evaluations.
Which company has the best grades?
Both companies carry a consensus “Buy” rating, but CDW Corporation has more strong buy and outperform ratings compared to Jack Henry & Associates, which has a larger proportion of neutral grades. This suggests slightly stronger analyst confidence in CDW, potentially influencing investor perceptions of relative growth and risk profiles.
Strengths and Weaknesses
The table below compares key strengths and weaknesses of CDW Corporation and Jack Henry & Associates, Inc. based on their diversification, profitability, innovation, global presence, and market share.
| Criterion | CDW Corporation | Jack Henry & Associates, Inc. |
|---|---|---|
| Diversification | High revenue from hardware (15.2B) and software (3.8B), plus services (1.9B); broad IT product mix. | Balanced revenue across Payments (873M), Core Segment (739M), and Complementary (675M); focused on financial tech. |
| Profitability | Slightly favorable with ROIC 13.1%, ROE 45.8%, but declining ROIC trend; net margin moderate at 5.13%. | Very favorable with ROIC 17.6%, ROE 21.4%, growing ROIC trend; net margin strong at 19.2%. |
| Innovation | Moderate innovation indicated by steady software revenue, but facing profitability pressure. | High innovation with durable competitive advantage and expanding payment technologies. |
| Global presence | Primarily North America with strong hardware distribution network. | Primarily U.S.-focused financial technology provider, less global reach but niche market dominance. |
| Market Share | Large share in IT hardware and services distribution. | Strong foothold in financial services software, especially payments and core banking systems. |
Key takeaways: CDW offers strong diversification and a large market share in IT hardware but faces profitability challenges. Jack Henry demonstrates superior profitability, innovation, and a durable competitive moat in financial technology, though with a narrower market focus. Investors should weigh CDW’s scale against JKHY’s growth and margin strength.
Risk Analysis
Below is a comparative table highlighting key risk factors for CDW Corporation and Jack Henry & Associates, Inc. based on the most recent financial and operational data.
| Metric | CDW Corporation | Jack Henry & Associates, Inc. |
|---|---|---|
| Market Risk | Moderate beta 1.07; sensitive to IT sector shifts | Lower beta 0.73; more stable demand in financial tech |
| Debt level | High debt-to-equity ratio 2.55 (unfavorable) | No debt; strong balance sheet (favorable) |
| Regulatory Risk | Moderate; operates in US, UK, Canada with data compliance demands | Moderate; US-focused, heavy financial regulation exposure |
| Operational Risk | Complexity in multi-segment IT solutions; 15.1K employees | Focused on financial IT services; 7.2K employees; operationally leaner |
| Environmental Risk | Moderate; typical for IT hardware/software providers | Moderate; primarily software-driven, less hardware impact |
| Geopolitical Risk | Exposure to UK and Canada markets; potential trade and data policy risks | Primarily US operations; less geopolitical exposure |
In synthesis, CDW faces higher financial risk due to its significant leverage and broader geographic exposure, while Jack Henry benefits from a debt-free balance sheet and a more focused market niche. Market risk is more pronounced for CDW given its higher beta and diversified segments, whereas Jack Henry’s stable financial sector clientele reduces volatility. Regulatory and operational risks remain relevant for both, but CDW’s complexity and international presence add to its vulnerability. Investors should weigh CDW’s growth potential against its leverage and geopolitical risks, while Jack Henry offers a safer profile with strong financial health metrics.
Which Stock to Choose?
CDW Corporation shows a favorable overall income statement with strong profitability metrics, including a 45.8% ROE and 13.1% ROIC, despite a recent income decline. Its debt level is moderately high with a net debt to EBITDA ratio of 2.85, and the rating is very favorable overall but with some concerns on debt and valuation.
Jack Henry & Associates, Inc. exhibits robust income growth and profitability, with a 19.2% net margin and a favorable ROIC of 17.6%. The company maintains zero net debt and a very strong financial rating, supported by a safe Altman Z-Score and a very strong Piotroski score, reflecting solid financial health and efficient capital use.
Investors seeking growth with improving profitability might find Jack Henry’s very favorable rating and durable moat appealing, while those valuing a slightly favorable moat and high ROE could see CDW as a stable option, albeit with more leverage and a recent income decline to consider.
Disclaimer: Investment carries a risk of loss of initial capital. The past performance is not a reliable indicator of future results. Be sure to understand risks before making an investment decision.
Go Further
I encourage you to read the complete analyses of CDW Corporation and Jack Henry & Associates, Inc. to enhance your investment decisions: