In the fast-evolving technology services sector, CDW Corporation and Globant S.A. stand out as influential players driving innovation and digital transformation. Both companies deliver comprehensive IT solutions, yet they differ in market focus and service diversity. This comparison explores their strategies, performance, and growth potential to help you identify which stock might be the most compelling addition to your investment portfolio in 2026. Let’s dive into the details.

Table of contents
Companies Overview
I will begin the comparison between CDW Corporation and Globant S.A. by providing an overview of these two companies and their main differences.
CDW Corporation Overview
CDW Corporation delivers information technology solutions primarily in the US, UK, and Canada. It operates through three segments: Corporate, Small Business, and Public. The company offers a broad range of hardware, software, and integrated IT services, including cloud, security, and networking solutions. Founded in 1984 and headquartered in Vernon Hills, Illinois, CDW serves government, education, healthcare, and various business customers.
Globant S.A. Overview
Globant S.A. is a global technology services firm based in Luxembourg, specializing in a diverse array of digital and IT services. Its offerings include e-commerce, cloud transformation, AI-driven analytics, and agile delivery, targeting sectors like healthcare, media, and finance. Founded in 2003, Globant emphasizes innovation through platforms and digital reinvention to support business transformation worldwide.
Key similarities and differences
Both companies belong to the Information Technology Services industry and focus on delivering technology solutions globally. CDW emphasizes hardware and integrated IT services with a strong presence in North America, while Globant concentrates on digital transformation, software, and innovative platforms across multiple industries. CDW has a more traditional IT product-service mix, whereas Globant prioritizes cutting-edge digital and cloud services with a broader global footprint.
Income Statement Comparison
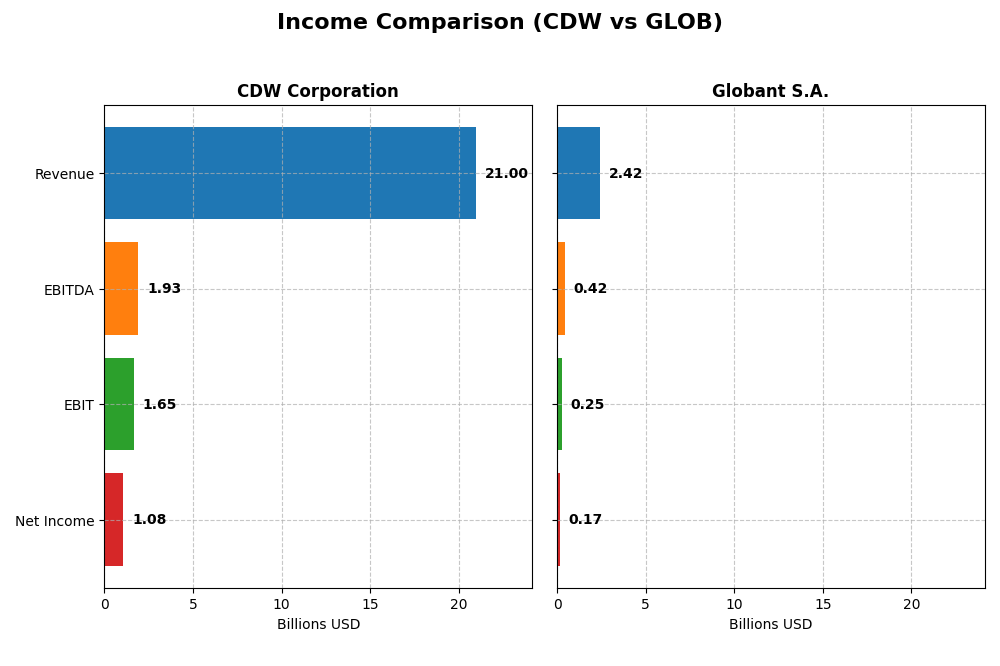
The table below presents a side-by-side comparison of key income statement metrics for CDW Corporation and Globant S.A. for the fiscal year 2024, enabling a clear financial overview of both companies.
| Metric | CDW Corporation | Globant S.A. |
|---|---|---|
| Market Cap | 17.2B USD | 3.0B USD |
| Revenue | 21.0B USD | 2.4B USD |
| EBITDA | 1.93B USD | 417M USD |
| EBIT | 1.65B USD | 254M USD |
| Net Income | 1.08B USD | 166M USD |
| EPS | 8.06 USD | 3.82 USD |
| Fiscal Year | 2024 | 2024 |
Income Statement Interpretations
CDW Corporation
CDW’s revenue and net income showed overall growth from 2020 to 2024, with revenue increasing 13.7% and net income rising 36.7%. Margins remained relatively stable, with a gross margin around 22% and a net margin near 5%. However, in 2024, revenue and profitability slightly declined, with net margin and EPS decreasing by about 0.65% and 1.6%, indicating a mild slowdown.
Globant S.A.
Globant experienced strong revenue and net income growth over the five-year period, with revenue up nearly 197% and net income more than tripling by 205.7%. Margins improved, highlighted by a gross margin of 35.7% and EBIT margin above 10%. The latest year showed robust revenue growth of 15.3%, though net margin contracted by 9.3%, suggesting some pressure on profitability despite higher top-line gains.
Which one has the stronger fundamentals?
Both companies present favorable income statement fundamentals, but Globant exhibits stronger revenue and net income growth alongside higher gross and EBIT margins. CDW benefits from stable profitability and a solid net margin, though recent declines suggest cautious monitoring. Globant’s higher growth rates and margin expansion indicate more dynamic fundamentals, albeit with some recent margin compression.
Financial Ratios Comparison
The table below presents the most recent key financial ratios for CDW Corporation and Globant S.A., offering a clear side-by-side view as of fiscal year 2024.
| Ratios | CDW Corporation (2024) | Globant S.A. (2024) |
|---|---|---|
| ROE | 45.8% | 8.4% |
| ROIC | 13.1% | 6.8% |
| P/E | 21.6 | 57.6 |
| P/B | 9.90 | 4.86 |
| Current Ratio | 1.35 | 1.54 |
| Quick Ratio | 1.24 | 1.54 |
| D/E | 2.55 | 0.21 |
| Debt-to-Assets | 40.8% | 13.0% |
| Interest Coverage | 7.70 | 7.87 |
| Asset Turnover | 1.43 | 0.76 |
| Fixed Asset Turnover | 67.3 | 8.70 |
| Payout Ratio | 30.8% | 0% |
| Dividend Yield | 1.43% | 0% |
Interpretation of the Ratios
CDW Corporation
CDW shows a mix of strong and neutral ratios, with a notably favorable return on equity (45.81%) and return on invested capital (13.13%), indicating efficient capital use. The price-to-book ratio is high and unfavorable at 9.9, suggesting potential overvaluation. The company maintains a neutral current ratio of 1.35 and a favorable quick ratio of 1.24. CDW pays dividends with a moderate yield of 1.43%, supported by steady payout coverage and balanced shareholder returns without excessive risk.
Globant S.A.
Globant presents a neutral net margin of 6.86% but struggles with an unfavorable return on equity of 8.44% and a relatively high price-to-earnings ratio of 57.64, indicating possible overvaluation concerns. Liquidity and solvency ratios are favorable, including a current ratio of 1.54 and low debt-to-equity of 0.21. The firm does not pay dividends, likely reinvesting earnings to support growth and innovation, consistent with its technology services profile and shareholder value focus.
Which one has the best ratios?
Both companies have a slightly favorable overall ratio profile, but CDW exhibits stronger profitability and capital efficiency metrics, alongside a dividend policy appealing to income-focused investors. Globant’s favorable liquidity and low leverage contrast with weaker profitability and valuation metrics, reflecting different risk and growth profiles. The choice depends on investor priorities between income and growth potential.
Strategic Positioning
This section compares the strategic positioning of CDW and Globant, including market position, key segments, and exposure to technological disruption:
CDW
- Leading IT solutions provider in North America facing moderate competitive pressure.
- Diverse segments: Corporate, Small Business, Public; drivers include hardware, software, and IT services.
- Moderate exposure through integrated IT solutions, including cloud and security services.
Globant
- Global technology services company with exposure to competitive pressures worldwide.
- Broad service offerings including e-commerce, cloud, data platforms, and advanced digital services.
- High exposure with services in AI, blockchain, cloud transformation, and digital innovation.
CDW vs Globant Positioning
CDW adopts a diversified approach across hardware, software, and services targeting various customer sizes and sectors. Globant focuses on a concentrated strategy in innovative digital and technology services. CDW benefits from broad market coverage, while Globant emphasizes cutting-edge technological trends.
Which has the best competitive advantage?
CDW shows a slightly favorable moat with value creation despite declining profitability. Globant has a slightly unfavorable moat, currently shedding value but improving profitability. CDW maintains a stronger competitive advantage based on current MOAT evaluation.
Stock Comparison
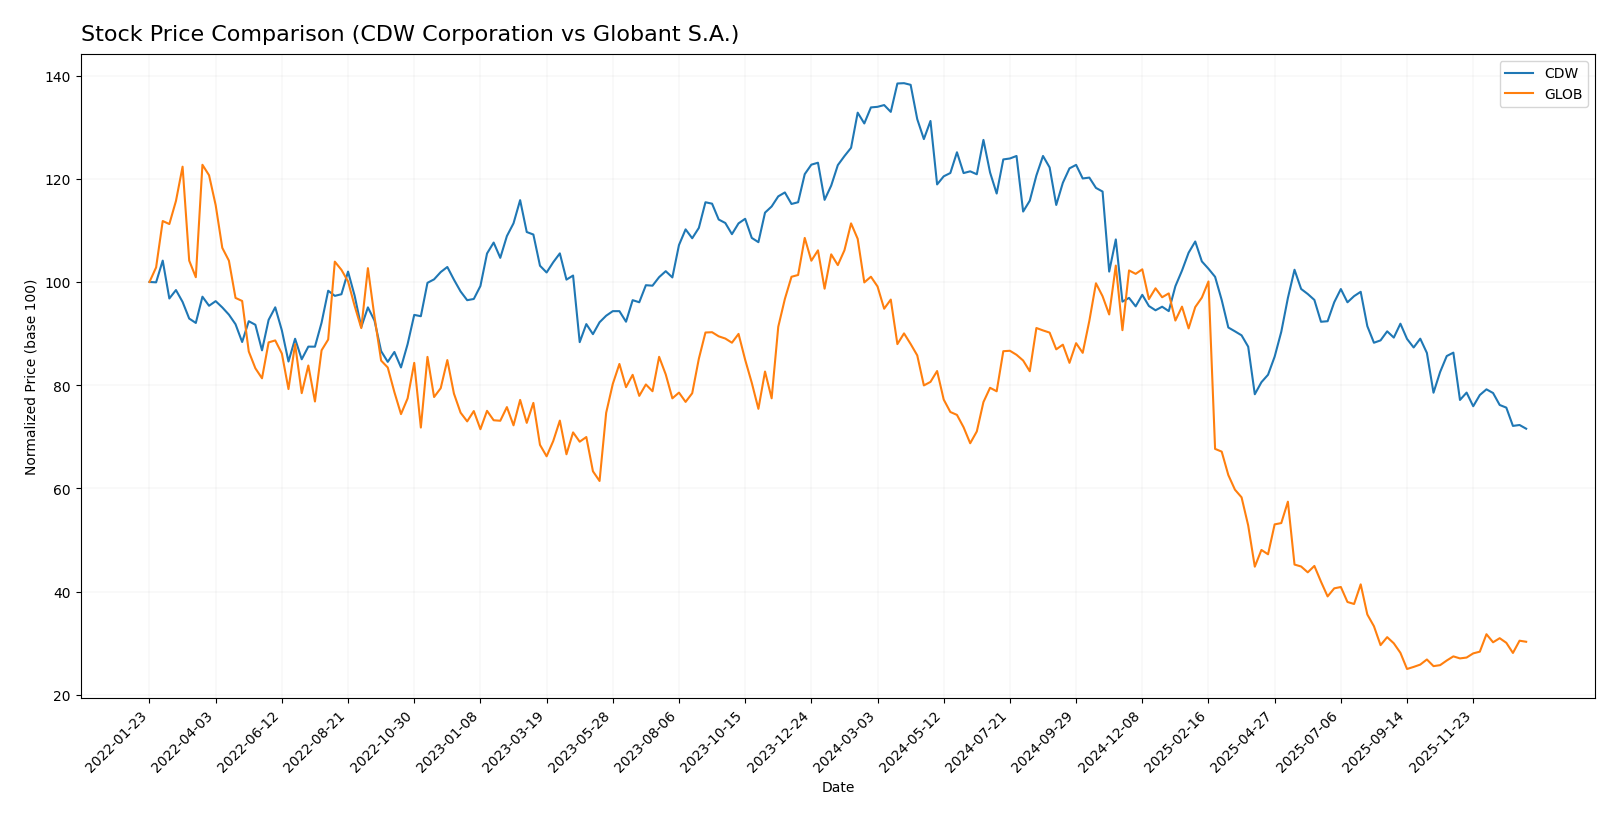
The stock price movements of CDW Corporation and Globant S.A. over the past year reveal significant declines, with contrasting recent trading dynamics and volatility levels shaping their market behavior.
Trend Analysis
CDW Corporation’s stock has experienced a bearish trend over the past 12 months, dropping 46.52% with decelerating losses and a high volatility of 33.89. The price ranged between 255.78 and 132.16.
Globant S.A. also shows a bearish trend with a sharper decline of 70.01% over the year, but with accelerating losses and even higher volatility at 61.44. It hit a high of 231.36 and a low of 56.11.
Comparing recent performance, Globant reversed to a 10.31% gain while CDW continued falling by 17.07%. Globant’s stock has delivered the highest recent market performance.
Target Prices
Here is the current target price consensus from verified analysts for the selected companies:
| Company | Target High | Target Low | Consensus |
|---|---|---|---|
| CDW Corporation | 190 | 148 | 175 |
| Globant S.A. | 80 | 68 | 72.5 |
Analysts expect CDW Corporation’s stock to appreciate considerably from its current price of $132.16, suggesting strong upside potential. Globant’s consensus target of $72.5 also indicates a moderate upside compared to its current price of $67.93.
Analyst Opinions Comparison
This section compares analysts’ ratings and grades for CDW Corporation and Globant S.A.:
Rating Comparison
CDW Rating
- Rating: B, considered Very Favorable by analysts.
- Discounted Cash Flow Score: 4, Favorable score indicating positive valuation.
- ROE Score: 5, Very Favorable, showing excellent profit generation efficiency.
- ROA Score: 4, Favorable, effective asset utilization.
- Debt To Equity Score: 1, Very Unfavorable, indicating high financial risk.
- Overall Score: 3, Moderate, a middling overall financial assessment.
GLOB Rating
- Rating: A-, also Very Favorable in analyst assessments.
- Discounted Cash Flow Score: 5, Very Favorable, suggesting strong valuation.
- ROE Score: 3, Moderate, indicating average efficiency generating equity profit.
- ROA Score: 3, Moderate, average effectiveness in asset use.
- Debt To Equity Score: 3, Moderate, showing balanced financial leverage.
- Overall Score: 4, Favorable, better overall financial standing.
Which one is the best rated?
Globant S.A. holds a higher overall score (4 vs. 3) and a superior discounted cash flow rating than CDW. However, CDW excels in return on equity and assets but shows weaker debt management. Overall, Globant is better rated based strictly on the provided metrics.
Scores Comparison
Here is a comparison of the Altman Z-Score and Piotroski Score for CDW and Globant:
CDW Scores
- Altman Z-Score: 2.68, in the grey zone, moderate bankruptcy risk.
- Piotroski Score: 6, average financial strength.
GLOB Scores
- Altman Z-Score: 3.05, in the safe zone, low bankruptcy risk.
- Piotroski Score: 5, average financial strength.
Which company has the best scores?
Based on the provided data, Globant has a higher Altman Z-Score indicating lower bankruptcy risk, but a slightly lower Piotroski Score. CDW has a better Piotroski Score but falls into the grey zone for Altman Z-Score.
Grades Comparison
Here is a comparison of recent grades assigned to CDW Corporation and Globant S.A. by leading financial institutions:
CDW Corporation Grades
This table shows the latest grades for CDW Corporation from reputable grading companies.
| Grading Company | Action | New Grade | Date |
|---|---|---|---|
| Morgan Stanley | Maintain | Overweight | 2025-12-17 |
| Raymond James | Upgrade | Strong Buy | 2025-11-25 |
| Barclays | Maintain | Equal Weight | 2025-11-05 |
| UBS | Maintain | Buy | 2025-11-05 |
| Evercore ISI Group | Maintain | Outperform | 2025-10-20 |
| UBS | Maintain | Buy | 2025-08-07 |
| Barclays | Maintain | Equal Weight | 2025-08-07 |
| JP Morgan | Maintain | Neutral | 2025-07-17 |
| Citigroup | Maintain | Neutral | 2025-07-11 |
| Barclays | Maintain | Equal Weight | 2025-05-08 |
Overall, CDW Corporation’s grades indicate a generally positive trend with multiple buy and outperform ratings, including an upgrade to Strong Buy.
Globant S.A. Grades
This table shows the latest grades for Globant S.A. from reputable grading companies.
| Grading Company | Action | New Grade | Date |
|---|---|---|---|
| Jefferies | Downgrade | Hold | 2025-11-20 |
| UBS | Maintain | Neutral | 2025-11-18 |
| JP Morgan | Maintain | Neutral | 2025-11-14 |
| Needham | Maintain | Buy | 2025-11-14 |
| Canaccord Genuity | Maintain | Hold | 2025-11-14 |
| Goldman Sachs | Maintain | Neutral | 2025-10-09 |
| UBS | Maintain | Neutral | 2025-08-20 |
| Goldman Sachs | Maintain | Neutral | 2025-08-18 |
| Needham | Maintain | Buy | 2025-08-15 |
| JP Morgan | Downgrade | Neutral | 2025-08-15 |
Grades for Globant S.A. show a mixed but more cautious sentiment, with several neutral and hold ratings and some downgrades.
Which company has the best grades?
CDW Corporation has received generally stronger and more optimistic grades compared to Globant S.A., which faces more neutral and downgraded ratings. This divergence may influence investor perceptions of relative risk and growth potential between the two companies.
Strengths and Weaknesses
Below is a comparative overview of key strengths and weaknesses of CDW Corporation and Globant S.A. based on their latest financial and strategic data.
| Criterion | CDW Corporation | Globant S.A. |
|---|---|---|
| Diversification | Strong product mix: hardware (15.2B), software (3.8B), and services (1.9B) | Focused on digital consulting and IT services, less diversified |
| Profitability | Favorable ROIC at 13.13%, ROE 45.81%, net margin neutral (5.13%) | Neutral ROIC (6.82%), low ROE (8.44%), net margin neutral (6.86%) |
| Innovation | Moderate innovation driven by software products segment | Growing ROIC trend indicates improving innovation and profitability |
| Global presence | Primarily US-based with strong corporate and public sector clients | Expanding global footprint through digital transformation services |
| Market Share | Large scale in hardware distribution and IT services | Smaller scale, niche market in digital consulting |
Key takeaways: CDW shows strong diversification and high profitability but faces a slight decline in ROIC, signaling caution. Globant is less diversified and currently sheds value overall but demonstrates improving profitability trends, suggesting potential growth if momentum continues.
Risk Analysis
Below is a comparative table highlighting key risks for CDW Corporation and Globant S.A. based on the most recent 2024 data:
| Metric | CDW Corporation | Globant S.A. |
|---|---|---|
| Market Risk | Beta 1.07, moderate market volatility exposure | Beta 1.20, slightly higher sensitivity to market swings |
| Debt level | High debt-to-equity 2.55 (unfavorable) | Low debt-to-equity 0.21 (favorable) |
| Regulatory Risk | US/UK/Canada regulatory environments, moderate | Global operations, including EU regulations, moderate risk |
| Operational Risk | IT solutions complexity, supply chain dependencies | Diverse digital services, reliance on innovation |
| Environmental Risk | Moderate, with growing focus on sustainability | Moderate, with emphasis on sustainable business solutions |
| Geopolitical Risk | US/UK/Canada presence, moderate | Exposure to Latin America and Europe, higher geopolitical variability |
CDW faces notable risks from its relatively high debt level, which could impact financial flexibility, though it benefits from favorable operational efficiency. Globant, while financially more stable with low debt, deals with higher geopolitical risk due to its broader global footprint and a higher beta, indicating greater market sensitivity. Investors should weigh debt-related financial risks at CDW against Globant’s exposure to geopolitical and market volatility.
Which Stock to Choose?
CDW Corporation shows a mixed income evolution with overall revenue and net income growth over 2020-2024, despite a slight decline in 2024. Financial ratios reveal strong profitability with a 45.8% ROE and 13.1% ROIC, but leverage is high (D/E 2.55), and the credit rating is very favorable (B).
Globant S.A. demonstrates robust income growth, especially over the long term, with a 196.7% revenue increase and a 205.7% net income rise. Its profitability is more moderate (8.4% ROE, 6.8% ROIC), supported by low debt (D/E 0.21) and a very favorable credit rating (A-).
Investors seeking growth might find Globant’s strong income expansion and improving profitability appealing, while those valuing higher returns on equity and invested capital may view CDW’s metrics as slightly favorable despite its higher debt. The contrasting ratings and financial profiles suggest a choice that could depend on tolerance for leverage and preference for growth versus profitability.
Disclaimer: Investment carries a risk of loss of initial capital. The past performance is not a reliable indicator of future results. Be sure to understand risks before making an investment decision.
Go Further
I encourage you to read the complete analyses of CDW Corporation and Globant S.A. to enhance your investment decisions: