Home > Comparison > Technology > IT vs CDW
The strategic rivalry between Gartner, Inc. and CDW Corporation shapes the evolving landscape of the Technology sector. Gartner excels as a research-driven advisory powerhouse, offering subscription-based insights and consulting services. In contrast, CDW focuses on integrated IT solutions, blending hardware, software, and managed services. This analysis will explore which operational model delivers superior risk-adjusted returns, guiding investors seeking resilient, diversified portfolio allocations within Information Technology Services.
Table of contents
Companies Overview
Gartner, Inc. and CDW Corporation stand as major players in the competitive Information Technology Services sector.
Gartner, Inc.: Global Research and Advisory Leader
Gartner dominates as a research and advisory powerhouse offering subscription-based insights, conferences, and consulting. Its core revenue stems from delivering actionable IT research and expert networks worldwide. In 2026, the company focuses strategically on expanding its consulting services to drive IT cost optimization and digital transformation for enterprise clients.
CDW Corporation: Integrated IT Solutions Provider
CDW leads as a comprehensive IT solutions provider, selling hardware, software, and integrated services across corporate and public sectors. Its revenue engine combines product sales with managed and professional services. CDW’s 2026 strategy emphasizes hybrid cloud capabilities and security solutions to meet evolving data center and digital workspace demands.
Strategic Collision: Similarities & Divergences
Both firms excel in Information Technology Services but diverge sharply. Gartner relies on a subscription-driven advisory model, while CDW leverages product distribution plus integrated services. They compete primarily in IT transformation and cost management for enterprises. Gartner offers a knowledge moat; CDW provides tangible IT infrastructure solutions, resulting in distinct investment profiles anchored in intellectual capital versus asset-driven scalability.
Income Statement Comparison
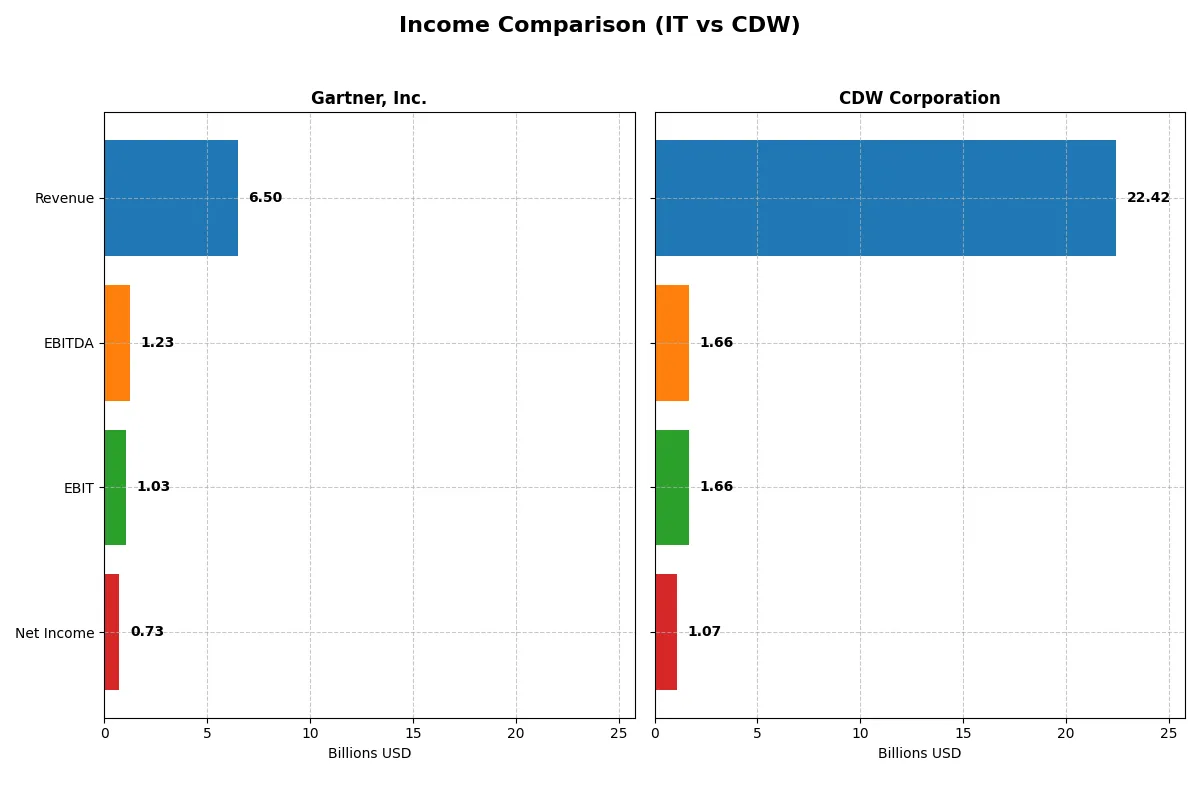
This data dissects the core profitability and scalability of both corporate engines to reveal who dominates the bottom line:
| Metric | Gartner, Inc. (IT) | CDW Corporation (CDW) |
|---|---|---|
| Revenue | 6.5B | 22.4B |
| Cost of Revenue | 2.1B | 17.6B |
| Operating Expenses | 3.4B | 3.2B |
| Gross Profit | 4.4B | 4.9B |
| EBITDA | 1.2B | 1.7B |
| EBIT | 1.0B | 1.7B |
| Interest Expense | 61M | 227M |
| Net Income | 729M | 1.1B |
| EPS | 9.68 | 8.13 |
| Fiscal Year | 2025 | 2025 |
Income Statement Analysis: The Bottom-Line Duel
This income statement comparison reveals which company operates with superior efficiency and profit generation in their market segments.
Gartner, Inc. Analysis
Gartner’s revenue climbed steadily from $4.7B in 2021 to nearly $6.5B in 2025, reflecting solid top-line growth despite net income declining 8% over five years. Its gross margin stays robust above 67%, but net margin dropped sharply to 11.2% in 2025. Earnings per share fell 40% last year, signaling margin pressure and operational challenges despite revenue momentum.
CDW Corporation Analysis
CDW’s revenue expanded modestly from $20.8B in 2021 to $22.4B in 2025, with net income rising 7.9% over that period. Gross margin holds at a lower but stable 21.7%, while net margin remains under 5%. CDW demonstrated a slight EBIT increase last year and EPS growth of 1.4%, showing consistent operational discipline amid moderate revenue gains.
Margin Strength vs. Growth Stability
Gartner commands far stronger gross margins and greater revenue growth but suffers from declining net income and compressed profitability. CDW delivers steadier net income growth with less margin but more consistent EPS improvement. For investors, Gartner’s profile suits those seeking growth with risk, while CDW appeals to those favoring stable earnings and disciplined margins.
Financial Ratios Comparison
These vital ratios act as a diagnostic tool to expose the underlying fiscal health, valuation premiums, and capital efficiency of the companies compared below:
| Ratios | Gartner, Inc. (IT) | CDW Corporation (CDW) |
|---|---|---|
| ROE | 92.24% (2024) | 40.93% (2025) |
| ROIC | 22.39% (2024) | 12.17% (2025) |
| P/E | 30.06 (2024) | 16.77 (2025) |
| P/B | 27.73 (2024) | 6.86 (2025) |
| Current Ratio | 1.06 (2024) | 1.18 (2025) |
| Quick Ratio | 1.06 (2024) | 1.10 (2025) |
| D/E | 2.13 (2024) | 2.42 (2025) |
| Debt-to-Assets | 34.0% (2024) | 39.3% (2025) |
| Interest Coverage | 8.82 (2024) | 7.28 (2025) |
| Asset Turnover | 0.73 (2024) | 1.40 (2025) |
| Fixed Asset Turnover | 12.53 (2024) | 72.76 (2025) |
| Payout Ratio | 0% (2024) | 31% (2025) |
| Dividend Yield | 0% (2024) | 1.84% (2025) |
| Fiscal Year | 2024 | 2025 |
Efficiency & Valuation Duel: The Vital Signs
Ratios act as a company’s DNA, revealing hidden risks and operational excellence crucial for investment decisions.
Gartner, Inc.
Gartner shows a favorable net margin at 11.22% but an unfavorable ROE and ROIC, signaling weak core profitability. Its P/E ratio of 24.91 suggests a neutral valuation, neither cheap nor expensive. Absence of dividends indicates reinvestment in R&D, supporting future growth but limiting immediate shareholder returns.
CDW Corporation
CDW delivers strong profitability with a 40.93% ROE and 12.17% ROIC, highlighting efficient capital use despite a modest 4.76% net margin. The P/E of 16.77 reflects a neutral valuation, while a 1.84% dividend yield offers steady income. CDW balances growth and shareholder returns with moderate leverage and solid asset turnover.
Profitability Strength vs. Growth Reinvestment
CDW offers a better balance of profitability and shareholder returns with favorable leverage and efficiency metrics. Gartner’s strategy leans more on growth reinvestment, fitting investors seeking future expansion over immediate income.
Which one offers the Superior Shareholder Reward?
I observe Gartner, Inc. (IT) opts for zero dividends but aggressively reinvests free cash flow into growth, showing a 93% free cash flow to operating cash flow ratio. CDW Corporation (CDW) pays a steady dividend yield near 1.8% with a payout ratio around 30%. CDW also executes moderate buybacks, enhancing total shareholder return. Gartner’s lack of dividends risks investor patience but signals capital allocation into long-term innovation. CDW’s model offers immediate income plus buybacks, though with lower growth margins. I conclude CDW provides a more balanced and sustainable shareholder reward in 2026, appealing to income and growth investors alike.
Comparative Score Analysis: The Strategic Profile
The radar chart reveals the fundamental DNA and trade-offs of Gartner, Inc. and CDW Corporation, highlighting their core financial strengths and weaknesses:
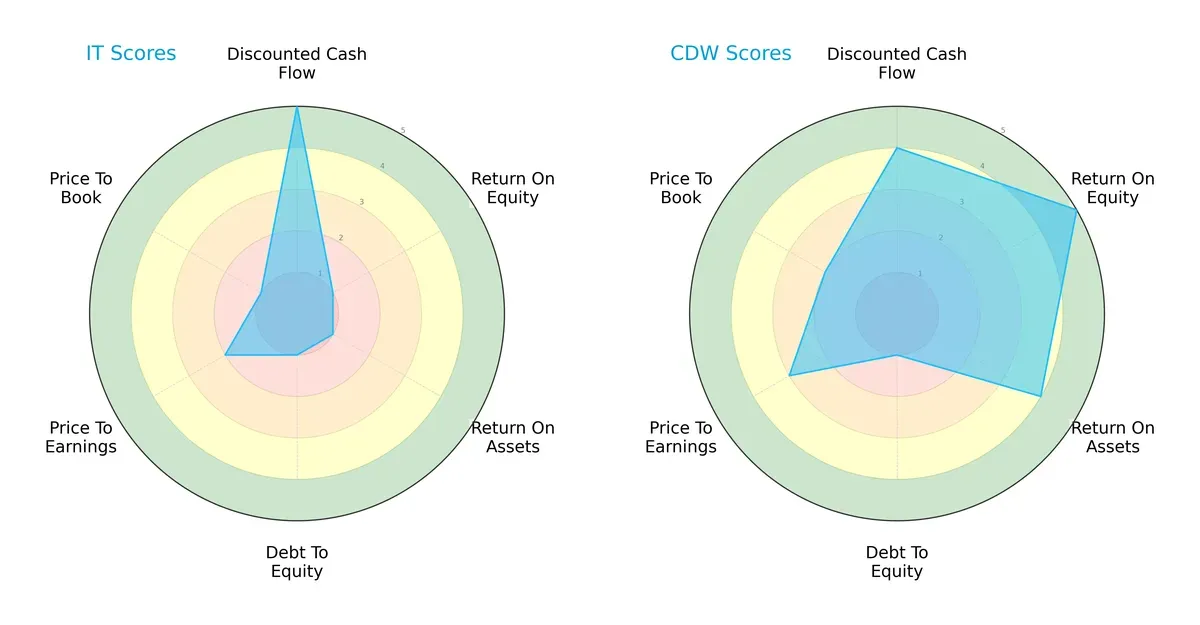
Gartner, Inc. excels in discounted cash flow (DCF) with a top score of 5 but struggles severely in profitability metrics like ROE and ROA (both 1). CDW Corporation offers a more balanced profile, leading in ROE (5) and ROA (4), with moderate DCF (4). Both share weak debt-to-equity scores (1), indicating financial leverage risks. CDW’s valuation metrics (PE 3, PB 2) also outperform Gartner’s (PE 2, PB 1), suggesting CDW holds a clearer value proposition.
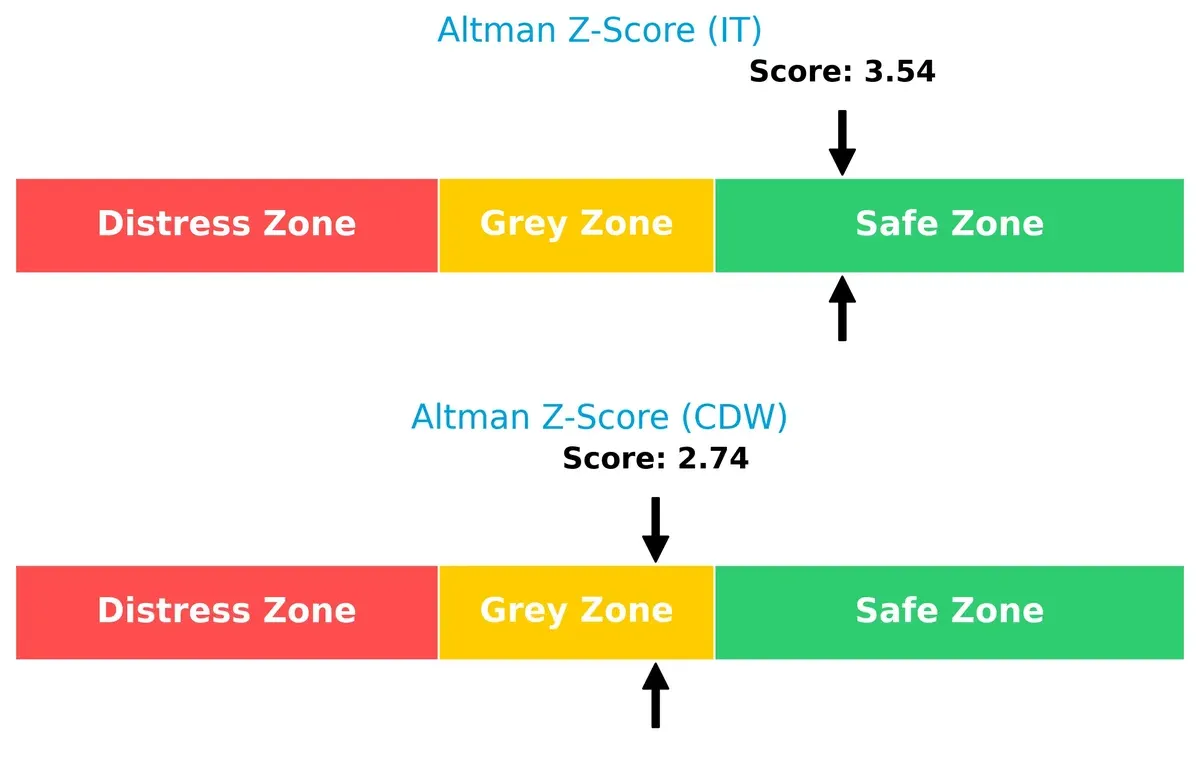
Bankruptcy Risk: Solvency Showdown
Gartner’s Altman Z-Score of 3.54 places it firmly in the safe zone, while CDW’s 2.74 signals moderate risk in the grey zone. This gap implies Gartner offers stronger long-term survival prospects in volatile markets:
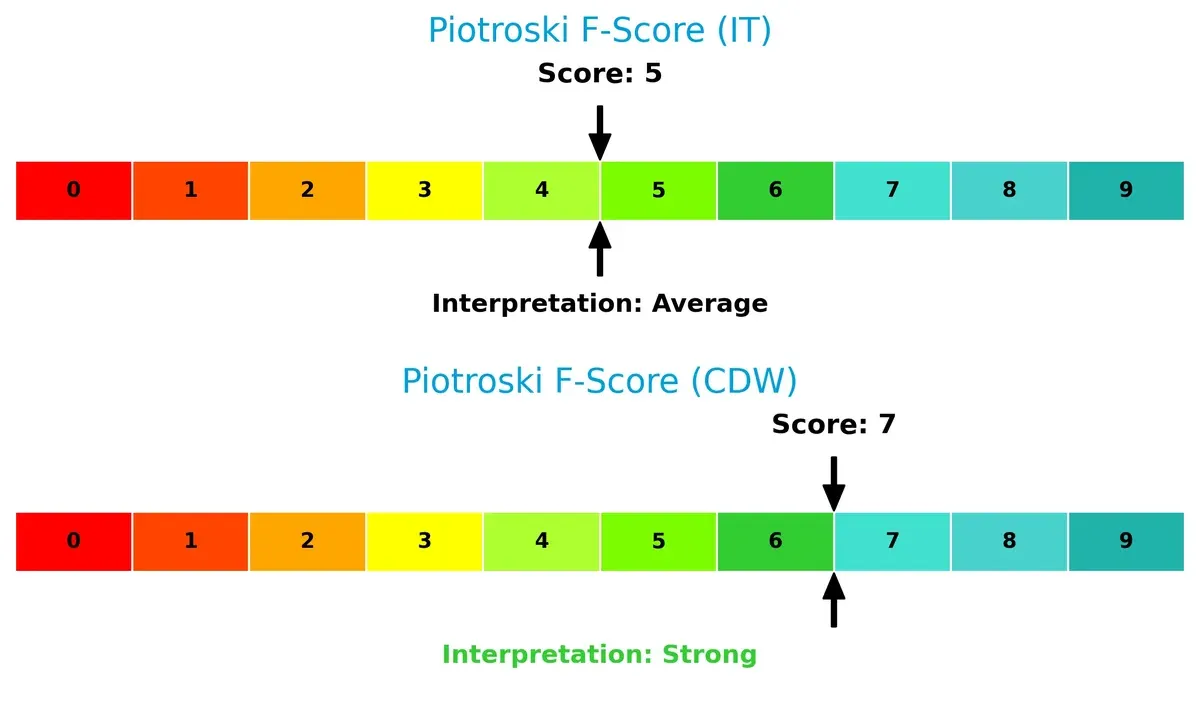
Financial Health: Quality of Operations
CDW’s Piotroski F-Score of 7 indicates robust financial health, outperforming Gartner’s average score of 5. Gartner’s middling score flags potential internal operational weaknesses relative to CDW:
How are the two companies positioned?
This section dissects Gartner and CDW’s operational DNA by comparing revenue distribution and internal strengths and weaknesses. The goal is to confront their economic moats to identify the more resilient competitive advantage in today’s market.
Revenue Segmentation: The Strategic Mix
The following visual comparison dissects how Gartner, Inc. and CDW Corporation diversify their income streams and where their primary sector bets lie:
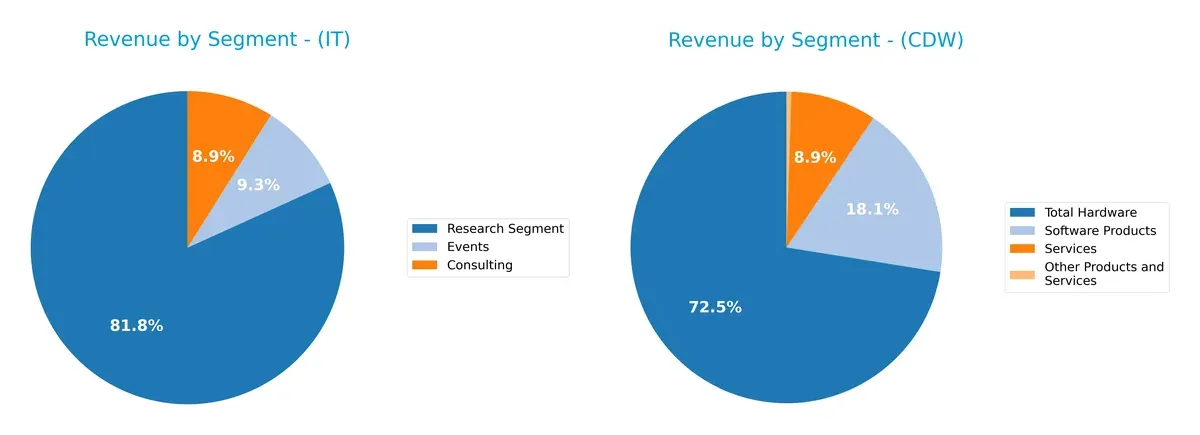
Gartner anchors its revenue on the Research Segment at $5.13B in 2024, with Consulting and Events trailing at $559M and $583M. CDW dominates with a heavy hardware focus, generating $15.2B, while Software Products and Services contribute $3.8B and $1.87B respectively. Gartner’s mix leans on high-margin intellectual property, signaling ecosystem lock-in. CDW’s reliance on hardware creates scale advantages but exposes it to concentration risk amid shifting tech trends.
Strengths and Weaknesses Comparison
This table compares the strengths and weaknesses of Gartner, Inc. and CDW Corporation:
Gartner Strengths
- Strong revenue in research segment with 5B USD in 2024
- Favorable net margin at 11.22%
- Low debt-to-assets ratio at 0%
- High interest coverage ratio at 16.98
- Diverse revenue streams across consulting, events, and research
- Solid international presence with 2.2B USD outside US
CDW Strengths
- Favorable ROE at 40.93% and ROIC at 12.17%
- Positive WACC at 7.25% supporting capital efficiency
- High asset turnover at 1.4 and fixed asset turnover at 72.76
- Strong hardware sales at 15.2B USD in 2024
- Healthy quick ratio at 1.1 and interest coverage at 7.28
- Large US market exposure with 18.5B USD revenue
Gartner Weaknesses
- Unfavorable ROE and ROIC both at 0%
- Unavailable WACC data limits capital cost analysis
- Poor liquidity ratios: current and quick ratios at 0
- Low asset turnover metrics
- No dividend yield
- Slightly unfavorable overall ratio profile with 50% unfavorable
CDW Weaknesses
- Unfavorable net margin at 4.76% indicating lower profitability
- High debt-to-equity ratio at 2.42 raises leverage concerns
- Unfavorable PB ratio at 6.86 suggests valuation premium
- Moderate current ratio at 1.18 is only neutral
- Dividend yield is neutral at 1.84%
- 21.43% of ratios unfavorable, limiting financial flexibility
Both companies show clear competitive advantages: Gartner excels in profitability and low leverage, while CDW leads in capital efficiency and scale. However, Gartner’s liquidity and return metrics raise caution, whereas CDW’s profitability margin and leverage suggest riskier financial structure. Each company’s strategy must address these financial imbalances to sustain long-term growth.
The Moat Duel: Analyzing Competitive Defensibility
A structural moat is the only barrier protecting long-term profits from relentless competitive erosion. Let’s dissect how these firms defend their turf:
Gartner, Inc.: Expertise-Driven Advisory Moat
Gartner’s moat stems from intangible assets—trusted research and expert networks. Its high gross margin (68%) reflects pricing power, but declining EBIT and net margins signal margin pressure. Expansion into digital transformation consulting may deepen its moat if managed efficiently.
CDW Corporation: Integrated Solutions Moat
CDW leverages cost advantage via scale and integrated IT solutions, resulting in stable gross margins (22%) and positive ROIC above WACC, indicating value creation. Its broad hardware-software portfolio supports moderate margin resilience, though EBIT growth is flat. Continued cloud and managed services expansion may reinforce its position.
Advisory Trust vs. Scale-Driven Integration
CDW holds the deeper moat with ROIC consistently exceeding WACC by nearly 5%, creating value despite a slight decline. Gartner’s intangible asset moat is robust but under margin pressure, weakening its economic defense. CDW is better equipped to defend market share through operational efficiency and diversified offerings.
Which stock offers better returns?
The past year saw both Gartner, Inc. and CDW Corporation stocks decline sharply, with notable volatility and decelerating downward momentum in their price movements.
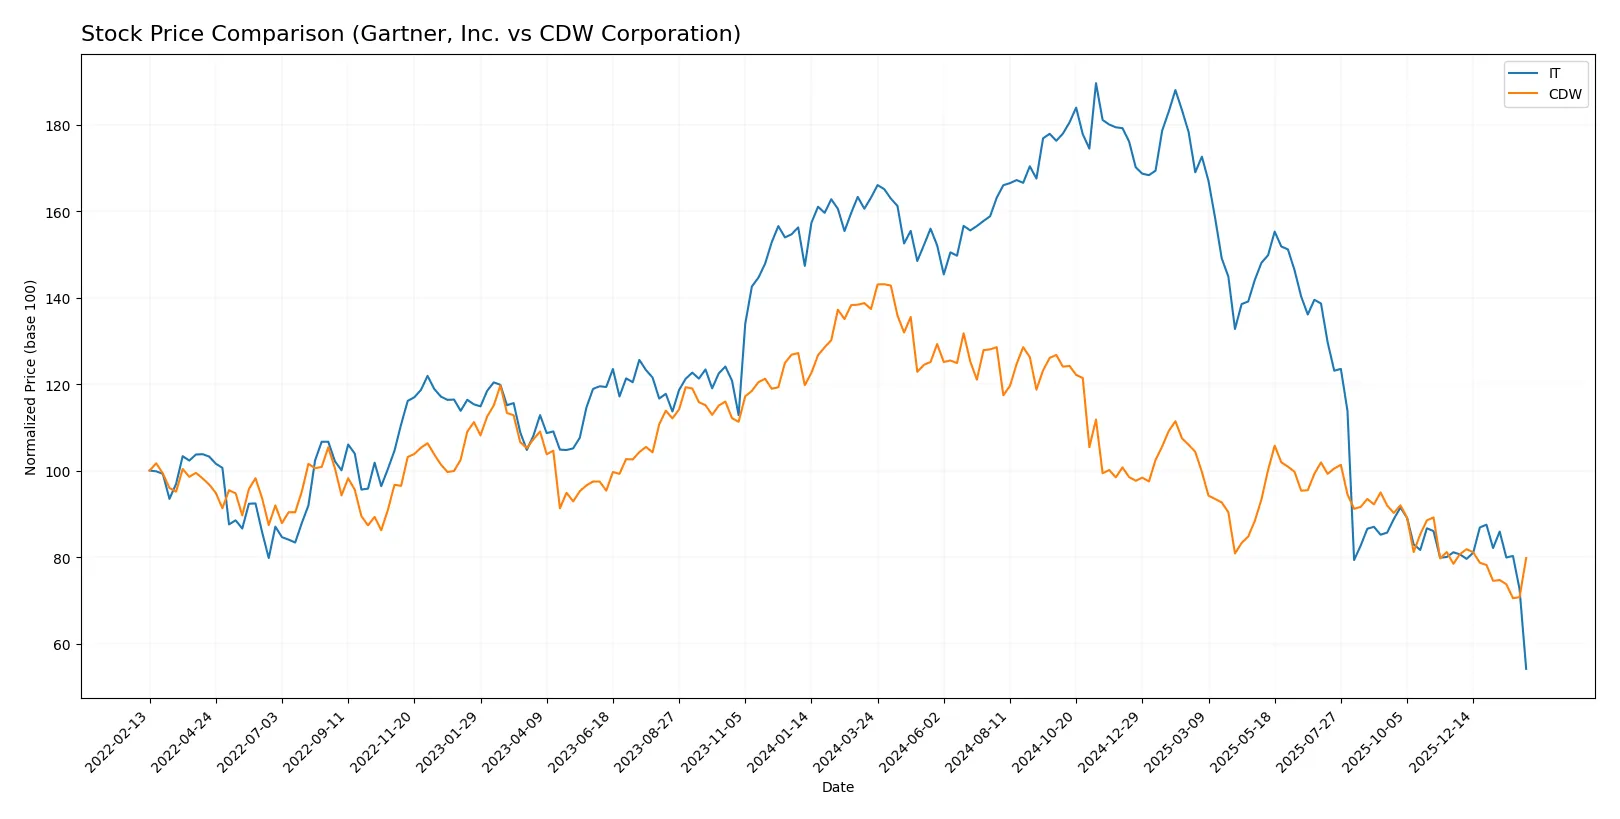
Trend Comparison
Gartner, Inc. stock dropped 66.81% over the past 12 months, marking a bearish trend with decelerating losses and extreme volatility, peaking at 547.4 and bottoming at 156.33.
CDW Corporation shares fell 41.91% in the same period, also showing a bearish trend with deceleration and lower volatility, reaching a high of 255.78 and a low of 126.
Comparing trends, CDW outperformed Gartner by a smaller decline magnitude, delivering relatively better market performance despite both stocks showing bearish trajectories.
Target Prices
Analyst consensus projects moderate upside potential for Gartner, Inc. and CDW Corporation.
| Company | Target Low | Target High | Consensus |
|---|---|---|---|
| Gartner, Inc. | 170 | 275 | 206.3 |
| CDW Corporation | 141 | 185 | 162.4 |
Gartner’s consensus target of 206.3 suggests roughly 32% upside from the current 156.33 price. CDW’s 162.4 target implies a 14% gain from 142.62. Analysts expect both stocks to outperform their recent trading prices.

Don’t Let Luck Decide Your Entry Point
Optimize your entry points with our advanced ProRealTime indicators. You’ll get efficient buy signals with precise price targets for maximum performance. Start outperforming now!
How do institutions grade them?
Here is a summary of recent institutional grades for Gartner, Inc. and CDW Corporation:
Gartner, Inc. Grades
The table below shows recent grades assigned by major financial institutions to Gartner, Inc.
| Grading Company | Action | New Grade | Date |
|---|---|---|---|
| Truist Securities | maintain | Buy | 2026-02-06 |
| Barclays | maintain | Equal Weight | 2026-02-05 |
| Morgan Stanley | maintain | Equal Weight | 2026-02-04 |
| Wells Fargo | maintain | Underweight | 2026-02-04 |
| UBS | maintain | Neutral | 2026-01-09 |
| Morgan Stanley | maintain | Equal Weight | 2025-12-17 |
| BMO Capital | maintain | Market Perform | 2025-11-06 |
| Wells Fargo | maintain | Underweight | 2025-11-05 |
| Barclays | maintain | Equal Weight | 2025-11-05 |
| Goldman Sachs | maintain | Buy | 2025-11-05 |
CDW Corporation Grades
The table below shows recent grades assigned by major financial institutions to CDW Corporation.
| Grading Company | Action | New Grade | Date |
|---|---|---|---|
| Citigroup | maintain | Neutral | 2026-02-05 |
| UBS | maintain | Buy | 2026-02-05 |
| Morgan Stanley | maintain | Equal Weight | 2026-02-05 |
| JP Morgan | maintain | Neutral | 2026-02-05 |
| Barclays | maintain | Equal Weight | 2026-02-05 |
| Morgan Stanley | downgrade | Equal Weight | 2026-01-20 |
| Citigroup | maintain | Neutral | 2026-01-20 |
| Morgan Stanley | maintain | Overweight | 2025-12-17 |
| Raymond James | upgrade | Strong Buy | 2025-11-25 |
| UBS | maintain | Buy | 2025-11-05 |
Which company has the best grades?
Gartner, Inc. receives a mix of Buy and Equal Weight ratings, with some Underweight opinions. CDW Corporation has Buy, Equal Weight, Neutral, and one Strong Buy grade. CDW’s Strong Buy and several Buy ratings suggest a slightly more positive institutional outlook, which may attract investors seeking growth potential.
Risks specific to each company
The following categories identify critical pressure points and systemic threats facing Gartner, Inc. and CDW Corporation in the 2026 market environment:
1. Market & Competition
Gartner, Inc.
- Faces intense competition in advisory and consulting with pressure on subscription pricing.
CDW Corporation
- Competes in a crowded IT solutions market with margin pressure from hardware/software resellers.
2. Capital Structure & Debt
Gartner, Inc.
- Exhibits a very conservative debt profile with favorable debt-to-equity and interest coverage ratios.
CDW Corporation
- Carries higher leverage with debt-to-equity of 2.42, increasing financial risk despite manageable interest coverage.
3. Stock Volatility
Gartner, Inc.
- Beta near 1.04 indicates volatility roughly in line with the market.
CDW Corporation
- Slightly higher beta at 1.05 suggests marginally elevated market sensitivity.
4. Regulatory & Legal
Gartner, Inc.
- Exposed to data privacy regulations impacting research and consulting services.
CDW Corporation
- Faces IT hardware/software compliance and government contract regulations, increasing legal complexity.
5. Supply Chain & Operations
Gartner, Inc.
- Less vulnerable to supply chain risks due to service-based model.
CDW Corporation
- Dependent on global hardware/software supply chains, vulnerable to disruptions and cost inflation.
6. ESG & Climate Transition
Gartner, Inc.
- ESG initiatives focus on sustainable advisory practices, but limited impact on core revenue.
CDW Corporation
- Faces pressures to improve ESG metrics due to hardware sourcing and energy-intensive operations.
7. Geopolitical Exposure
Gartner, Inc.
- Global operations expose it to geopolitical tensions affecting consulting and conference business.
CDW Corporation
- Operations concentrated in US, UK, Canada; exposed to trade and regulatory shifts in these regions.
Which company shows a better risk-adjusted profile?
The critical risk for Gartner, Inc. lies in its weak capital structure metrics and unfavorable return ratios, signaling operational inefficiencies despite low debt. CDW’s principal risk is its high leverage, which elevates financial vulnerability amid market uncertainties. CDW’s stronger profitability and asset utilization, combined with a safer Altman Z-Score in the grey zone, give it a comparatively better risk-adjusted profile. Notably, Gartner’s zero current and quick ratios raise liquidity red flags, underscoring its operational strain in 2026.
Final Verdict: Which stock to choose?
Gartner, Inc. (IT) impresses with its superpower in generating strong net margins and maintaining a solid discounted cash flow profile. However, its declining profitability metrics and signs of financial strain warrant caution. It suits investors seeking aggressive growth with a tolerance for volatility and turnaround potential.
CDW Corporation (CDW) commands a strategic moat with its efficient asset use and robust return on equity. It offers more financial stability than Gartner, despite carrying higher debt levels. CDW fits well in portfolios focused on growth at a reasonable price, appealing to investors who prioritize steady earnings and operational efficiency.
If you prioritize high-margin growth and can endure near-term earnings pressure, Gartner (IT) might be the compelling choice due to its cash flow strength and upside potential. However, if you seek better stability and consistent capital efficiency, CDW offers a slightly favorable moat and stronger return metrics, albeit with greater leverage risk.
Disclaimer: Investment carries a risk of loss of initial capital. The past performance is not a reliable indicator of future results. Be sure to understand risks before making an investment decision.
Go Further
I encourage you to read the complete analyses of Gartner, Inc. and CDW Corporation to enhance your investment decisions: