In the rapidly evolving Information Technology Services sector, CDW Corporation and EPAM Systems, Inc. stand out as key players with distinct approaches to innovation and market reach. CDW focuses on integrated IT solutions across hardware and software for diverse clients, while EPAM excels in digital platform engineering and advanced software development. This comparison will help investors understand which company offers the most compelling investment opportunity in 2026. Let’s dive in to uncover the best pick for your portfolio.

Table of contents
Companies Overview
I will begin the comparison between CDW Corporation and EPAM Systems, Inc. by providing an overview of these two companies and their main differences.
CDW Corporation Overview
CDW Corporation specializes in providing information technology solutions across the United States, the United Kingdom, and Canada. Founded in 1984 and headquartered in Vernon Hills, Illinois, CDW serves various sectors including government, education, healthcare, and businesses of all sizes. Its offerings span hardware, software, and integrated IT solutions, with additional services such as advisory, implementation, and managed services.
EPAM Systems, Inc. Overview
EPAM Systems, Inc., founded in 1993 and based in Newtown, Pennsylvania, delivers digital platform engineering and software development services globally. The company focuses on engineering, infrastructure management, and optimization solutions for industries like financial services, healthcare, and technology. EPAM also provides consulting and digital design services, including AI, robotics, and virtual reality applications to enhance customer business systems.
Key similarities and differences
Both CDW and EPAM operate in the Information Technology Services sector, serving diverse industries with technology-driven solutions. CDW emphasizes hardware and software products alongside integrated IT solutions, whereas EPAM centers on software engineering, digital platforms, and consulting services. CDW’s market presence is more regional, while EPAM has a global footprint with advanced digital and automation offerings, reflecting differing focuses within the broader IT services landscape.
Income Statement Comparison
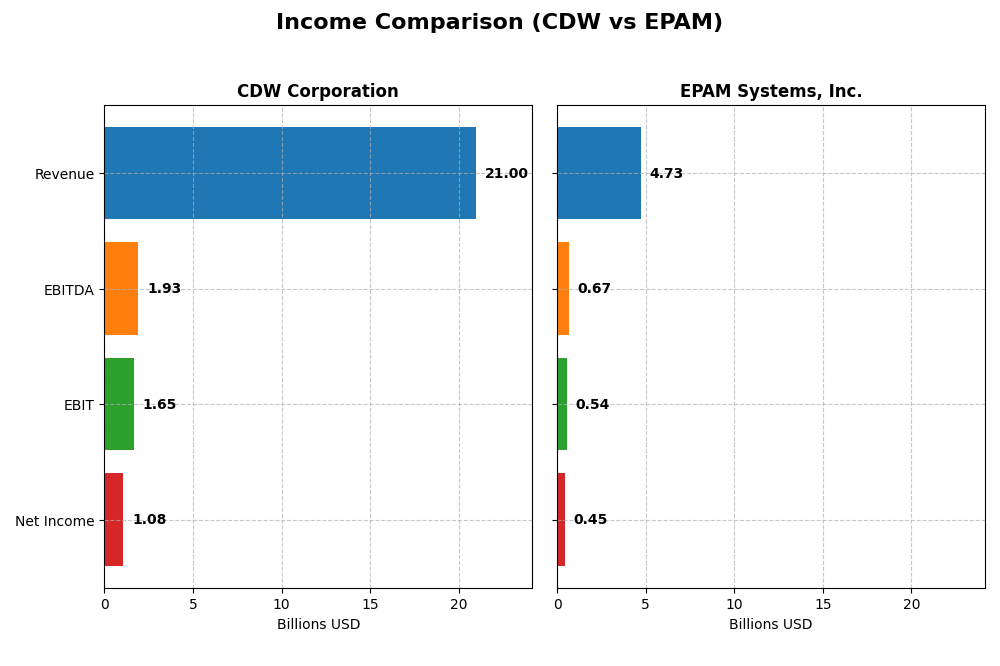
This table presents a side-by-side comparison of key income statement metrics for CDW Corporation and EPAM Systems, Inc. for the fiscal year 2024.
| Metric | CDW Corporation | EPAM Systems, Inc. |
|---|---|---|
| Market Cap | 17.2B | 12.2B |
| Revenue | 21.0B | 4.7B |
| EBITDA | 1.93B | 672M |
| EBIT | 1.65B | 545M |
| Net Income | 1.08B | 455M |
| EPS | 8.06 | 7.93 |
| Fiscal Year | 2024 | 2024 |
Income Statement Interpretations
CDW Corporation
CDW’s revenue showed a moderate overall growth of 13.7% from 2020 to 2024, while net income increased by 36.7%, reflecting efficient cost management. Gross margin remained stable near 22%, but the most recent year saw a slight revenue decline of 1.77% and a 0.65% drop in net margin, indicating some near-term pressure on profitability. Operating expenses decreased proportionally, maintaining margin stability.
EPAM Systems, Inc.
EPAM experienced robust revenue growth of 77.8% over the period, with net income rising 38.9%, supported by a strong gross margin of 30.7% and a favorable EBIT margin of 11.5%. The last fiscal year delivered a modest 0.8% revenue increase and an 8.1% net margin growth, reflecting improved operational efficiency. EPS growth of 11.1% in 2024 suggests solid earnings momentum despite net margin contraction over the longer term.
Which one has the stronger fundamentals?
EPAM displays stronger fundamentals with higher gross, EBIT, and net margins, alongside more substantial overall revenue growth. CDW shows robust net income growth and stable margins but faced a recent revenue and margin decline. EPAM’s superior margin expansion and EPS growth contrast with CDW’s slight short-term setbacks, highlighting differing momentum in profitability and efficiency trends.
Financial Ratios Comparison
Below is a comparison of key financial ratios for CDW Corporation and EPAM Systems, Inc. based on the most recent fiscal year data available for 2024.
| Ratios | CDW Corporation | EPAM Systems, Inc. |
|---|---|---|
| ROE | 45.81% | 12.52% |
| ROIC | 13.13% | 10.67% |
| P/E | 21.61 | 29.47 |
| P/B | 9.90 | 3.69 |
| Current Ratio | 1.35 | 2.96 |
| Quick Ratio | 1.24 | 2.96 |
| D/E (Debt-to-Equity) | 2.55 | 0.045 |
| Debt-to-Assets | 40.8% | 3.44% |
| Interest Coverage | 7.70 | 0 |
| Asset Turnover | 1.43 | 1.00 |
| Fixed Asset Turnover | 67.26 | 14.07 |
| Payout Ratio | 30.81% | 0% |
| Dividend Yield | 1.43% | 0% |
Interpretation of the Ratios
CDW Corporation
CDW shows a balanced financial profile with strong returns on equity (45.81%) and invested capital (13.13%), indicating effective use of capital. However, its price-to-book ratio (9.9) and debt-to-equity (2.55) reflect potential valuation and leverage concerns. The company pays dividends with a 1.43% yield, indicating moderate shareholder returns supported by cash flow, though cautious monitoring is advised.
EPAM Systems, Inc.
EPAM presents a mixed ratio picture, with favorable liquidity (current and quick ratios near 3) and low leverage (debt-to-equity 0.04), but less impressive returns on invested capital (10.67%) and a high weighted average cost of capital (11.76%). The company does not pay dividends, likely prioritizing reinvestment and growth, consistent with its high P/E (29.47) and ongoing expansion strategy.
Which one has the best ratios?
Both CDW and EPAM have slightly favorable overall ratios, but CDW’s higher profitability and capital efficiency contrast with EPAM’s stronger liquidity and lower debt levels. EPAM’s lack of dividends and elevated valuation metrics reflect a growth focus, while CDW offers more balanced returns and shareholder distributions, making the ratio comparison dependent on investor priorities.
Strategic Positioning
This section compares the strategic positioning of CDW and EPAM, including Market position, Key segments, and exposure to disruption:
CDW Corporation
- Leading IT solutions provider in US, UK, Canada with broad competition.
- Key segments: Corporate, Small Business, Public; driven by hardware, software, and services sales.
- Exposure through integrated IT solutions including cloud and security, adapting on-premise and hybrid models.
EPAM Systems, Inc.
- Digital platform engineering firm with global software development competition.
- Diverse industry focus: financial, retail, healthcare, software, media sectors.
- Focus on digital engineering, AI, robotics, virtual reality, and consulting services.
CDW vs EPAM Positioning
CDW’s approach centers on diversified IT hardware and software solutions across multiple customer types, offering stable product and service revenues. EPAM concentrates on digital engineering and software services with diverse industry verticals, emphasizing innovation in emerging technologies.
Which has the best competitive advantage?
CDW maintains a slightly favorable economic moat by creating value despite declining profitability, whereas EPAM shows a very unfavorable moat with value destruction and declining returns, indicating weaker competitive advantage.
Stock Comparison
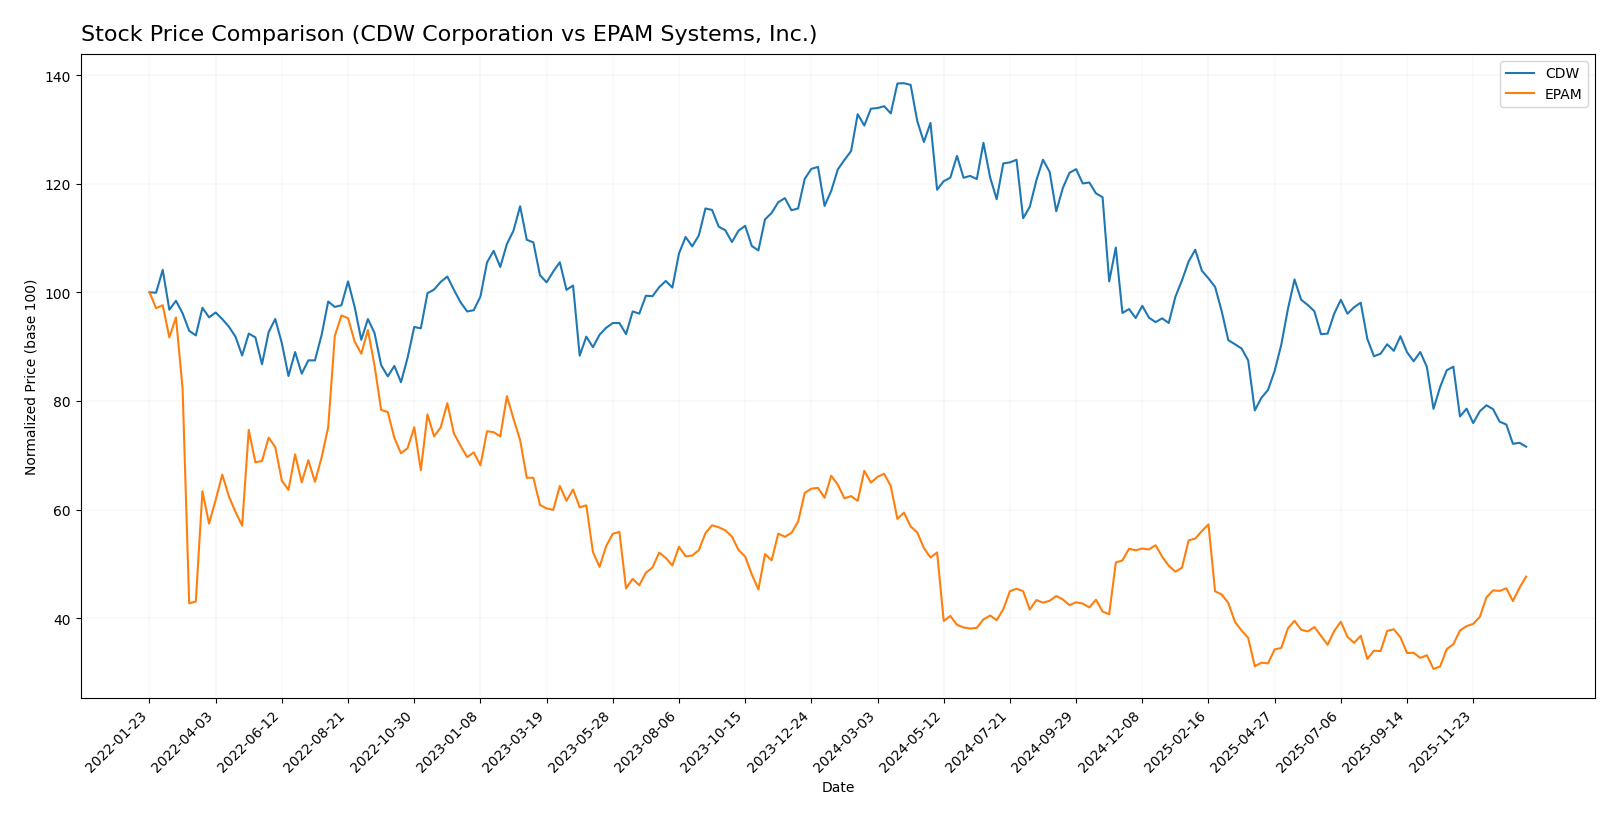
The stock price movements of CDW Corporation and EPAM Systems, Inc. over the past year reveal contrasting dynamics, with both exhibiting bearish trends overall but differing in recent momentum and volume behavior.
Trend Analysis
CDW Corporation’s stock showed a significant bearish trend over the past 12 months with a -46.52% price change, accompanied by deceleration and high volatility (std deviation 33.89). The price ranged from a high of 255.78 to a low of 132.16.
EPAM Systems, Inc. also experienced a bearish trend over the same period with a -26.64% price change but with accelerating decline and higher volatility (std deviation 38.96). The stock fluctuated between 309.4 and 142.38. Notably, EPAM displayed a strong recent reversal with a +35.38% gain over the last two and a half months.
Comparing the two, EPAM delivered the highest recent market performance with a positive trend since November 2025, while CDW continued on a downward trajectory, resulting in EPAM having the stronger overall momentum in the latest period.
Target Prices
Analysts present a positive target price consensus for both CDW Corporation and EPAM Systems, Inc.
| Company | Target High | Target Low | Consensus |
|---|---|---|---|
| CDW Corporation | 190 | 148 | 175 |
| EPAM Systems, Inc. | 247 | 175 | 214 |
The consensus targets for CDW at 175 and EPAM at 214 significantly exceed their current prices of 132.16 and 221.4 respectively, indicating generally optimistic analyst expectations.
Analyst Opinions Comparison
This section compares analysts’ ratings and grades for CDW Corporation and EPAM Systems, Inc.:
Rating Comparison
CDW Rating
- Rating: B, considered very favorable by analysts.
- Discounted Cash Flow Score: 4, indicating a favorable valuation based on future cash flows.
- ROE Score: 5, very favorable efficiency in generating profit from equity.
- ROA Score: 4, favorable asset utilization to generate earnings.
- Debt To Equity Score: 1, very unfavorable, indicating higher financial risk due to debt levels.
- Overall Score: 3, moderate overall financial standing.
EPAM Rating
- Rating: A-, also considered very favorable by analysts.
- Discounted Cash Flow Score: 4, similarly favorable valuation based on future cash flows.
- ROE Score: 3, moderate efficiency in generating profit from equity.
- ROA Score: 4, favorable asset utilization to generate earnings.
- Debt To Equity Score: 4, favorable, indicating lower financial risk due to manageable debt levels.
- Overall Score: 4, favorable overall financial standing.
Which one is the best rated?
Based strictly on the data, EPAM holds a higher overall score (4 vs. 3) and a better debt-to-equity score, indicating stronger financial stability. CDW excels in ROE but is penalized by its high debt risk. Overall, EPAM is better rated.
Scores Comparison
Here is a comparison of the Altman Z-Score and Piotroski Score for CDW Corporation and EPAM Systems, Inc.:
CDW Scores
- Altman Z-Score: 2.68, in the grey zone indicating moderate bankruptcy risk.
- Piotroski Score: 6, classified as average financial strength.
EPAM Scores
- Altman Z-Score: 8.83, in the safe zone showing low bankruptcy risk.
- Piotroski Score: 7, indicating strong financial strength.
Which company has the best scores?
EPAM has the best scores with a high Altman Z-Score in the safe zone and a strong Piotroski rating. CDW shows moderate bankruptcy risk and average financial strength based on the scores provided.
Grades Comparison
Here is the grades comparison for CDW Corporation and EPAM Systems, Inc.:
CDW Corporation Grades
This table summarizes recent grades issued by verified financial institutions for CDW Corporation.
| Grading Company | Action | New Grade | Date |
|---|---|---|---|
| Morgan Stanley | Maintain | Overweight | 2025-12-17 |
| Raymond James | Upgrade | Strong Buy | 2025-11-25 |
| Barclays | Maintain | Equal Weight | 2025-11-05 |
| UBS | Maintain | Buy | 2025-11-05 |
| Evercore ISI Group | Maintain | Outperform | 2025-10-20 |
| UBS | Maintain | Buy | 2025-08-07 |
| Barclays | Maintain | Equal Weight | 2025-08-07 |
| JP Morgan | Maintain | Neutral | 2025-07-17 |
| Citigroup | Maintain | Neutral | 2025-07-11 |
| Barclays | Maintain | Equal Weight | 2025-05-08 |
Overall, CDW Corporation’s grades show a stable to positive outlook with multiple “Buy,” “Outperform,” and “Strong Buy” ratings, reflecting confidence across several analysts.
EPAM Systems, Inc. Grades
The following table lists the latest verified grades assigned to EPAM Systems, Inc. by recognized grading institutions.
| Grading Company | Action | New Grade | Date |
|---|---|---|---|
| TD Cowen | Maintain | Buy | 2026-01-09 |
| Mizuho | Maintain | Outperform | 2025-11-11 |
| JP Morgan | Maintain | Overweight | 2025-11-07 |
| Morgan Stanley | Maintain | Equal Weight | 2025-09-09 |
| JP Morgan | Maintain | Overweight | 2025-08-20 |
| Barclays | Maintain | Overweight | 2025-05-12 |
| Guggenheim | Maintain | Buy | 2025-05-09 |
| Morgan Stanley | Maintain | Equal Weight | 2025-05-09 |
| Needham | Maintain | Buy | 2025-05-09 |
| Piper Sandler | Maintain | Neutral | 2025-05-09 |
EPAM Systems, Inc. holds predominantly “Buy” and “Overweight” ratings, with a consistent consensus indicating a favorable position among analysts.
Which company has the best grades?
Both CDW Corporation and EPAM Systems, Inc. share a “Buy” consensus from analysts. However, CDW benefits from a notable “Strong Buy” upgrade and several “Outperform” ratings, while EPAM shows broader “Overweight” and “Buy” ratings without a “Strong Buy.” Investors might infer that CDW has slightly stronger recent endorsements, potentially impacting confidence and portfolio decisions accordingly.
Strengths and Weaknesses
Below is a comparative overview of the key strengths and weaknesses of CDW Corporation and EPAM Systems, Inc. based on their recent financial and operational data.
| Criterion | CDW Corporation | EPAM Systems, Inc. |
|---|---|---|
| Diversification | Strong mix of hardware (15.2B), software (3.8B), and services (1.9B) revenues, reducing reliance on a single segment | Balanced revenue streams across multiple sectors, including Financial Services (1.0B), Consumer Goods (1.0B), and Emerging Verticals (0.7B) |
| Profitability | Favorable ROIC at 13.13%, ROE 45.81%, but net margin moderate at 5.13% | Lower profitability with ROIC 10.67% below WACC (11.76%), net margin at 9.61%, declining profitability trend |
| Innovation | Moderate, with steady software product revenue but hardware dominates; innovation focus not clearly indicated | Strong focus on software and technology solutions across diverse sectors, indicating innovation potential |
| Global presence | Primarily North American focus with a large hardware distribution network | More global, serving various sectors worldwide with diversified client base |
| Market Share | Significant market share in IT hardware distribution | Growing presence in IT services and software development, but faces value erosion risks |
In summary, CDW shows strong diversification and profitability with a solid value creation profile despite a slightly declining ROIC trend. EPAM, while innovative and globally diversified in software services, struggles with profitability and is currently destroying value, which raises caution for investors.
Risk Analysis
Below is a comparative table highlighting key risks for CDW Corporation and EPAM Systems, Inc. as assessed in the most recent fiscal year (2024).
| Metric | CDW Corporation | EPAM Systems, Inc. |
|---|---|---|
| Market Risk | Moderate (Beta 1.07) | High (Beta 1.73) |
| Debt Level | High (D/E 2.55, 40.8%) | Very Low (D/E 0.04, 3.4%) |
| Regulatory Risk | Moderate (US, UK, Canada) | Moderate (Global IT services) |
| Operational Risk | Moderate (Service delivery complexity) | Moderate (Global software development) |
| Environmental Risk | Low (IT hardware/software focus) | Low (Digital platforms focus) |
| Geopolitical Risk | Moderate (North America, UK exposure) | Moderate to High (Global operations, including volatile regions) |
The most impactful risks are CDW’s high debt level, posing financial strain despite favorable profitability metrics, and EPAM’s higher market volatility and geopolitical exposure due to its global footprint. Investors should weigh debt management for CDW and geopolitical uncertainties for EPAM when considering these stocks.
Which Stock to Choose?
CDW Corporation shows a favorable income statement overall, with a 13.7% revenue growth and 36.7% net income growth over 2020-2024 despite a 1.77% revenue decline in 2024. Its financial ratios are slightly favorable, highlighted by a strong 45.8% ROE but a high debt-to-equity ratio of 2.55. The company maintains a very favorable rating of B, though with some concerns on leverage and valuation multiples.
EPAM Systems, Inc. demonstrates robust revenue growth of 77.8% and net income growth of 38.9% over the same period, with positive net margin expansion in recent years. Its ratios are slightly favorable but with notable weaknesses such as an unfavorable ROIC and WACC relationship and some valuation concerns. EPAM holds a very favorable A- rating supported by strong liquidity and low debt levels.
For investors prioritizing growth and stronger recent earnings momentum, EPAM may appear more attractive given its higher revenue growth and solid liquidity. Conversely, those focused on profitability metrics like ROE and value creation might find CDW’s slightly favorable moat and strong equity returns to be more compelling despite its higher leverage. The choice could thus depend on the investor’s risk tolerance and preference for growth versus value characteristics.
Disclaimer: Investment carries a risk of loss of initial capital. The past performance is not a reliable indicator of future results. Be sure to understand risks before making an investment decision.
Go Further
I encourage you to read the complete analyses of CDW Corporation and EPAM Systems, Inc. to enhance your investment decisions: