Home > Comparison > Technology > CDW vs DXC
The strategic rivalry between CDW Corporation and DXC Technology Company shapes the Information Technology Services sector’s evolution. CDW operates as a nimble IT solutions provider focused on hardware and integrated services for diverse markets. In contrast, DXC, a global IT services giant, centers on large-scale digital transformation and infrastructure management. This analysis probes which company’s operational model offers a superior risk-adjusted return, guiding investors toward the more resilient portfolio addition.
Table of contents
Companies Overview
CDW Corporation and DXC Technology Company command significant roles in the Information Technology Services sector.
CDW Corporation: Integrated IT Solutions Leader
CDW dominates as a provider of IT solutions across the US, UK, and Canada. It generates revenue from hardware and software sales, plus integrated IT services spanning data centers, networking, and security. In 2026, CDW focuses strategically on expanding hybrid cloud capabilities and tailored digital workspace solutions for diverse customer segments.
DXC Technology Company: Digital Transformation Enabler
DXC stands as a global provider of IT services and consulting, operating in North America, Europe, Asia, and Australia. Its revenue stems from Global Business Services and Global Infrastructure Services, helping clients accelerate digital transformation and manage multi-cloud environments. In 2026, DXC emphasizes secure application delivery and IT outsourcing to optimize mission-critical systems.
Strategic Collision: Similarities & Divergences
Both companies pursue growth in digital transformation but differ in approach: CDW leverages a hardware-software integrated model, while DXC offers a service-heavy, cloud-centric platform. Their primary battleground lies in enterprise IT solutions, especially hybrid and multi-cloud adoption. CDW’s profile suits investors favoring tangible product-service synergy; DXC appeals to those seeking deep digital consulting and infrastructure expertise.
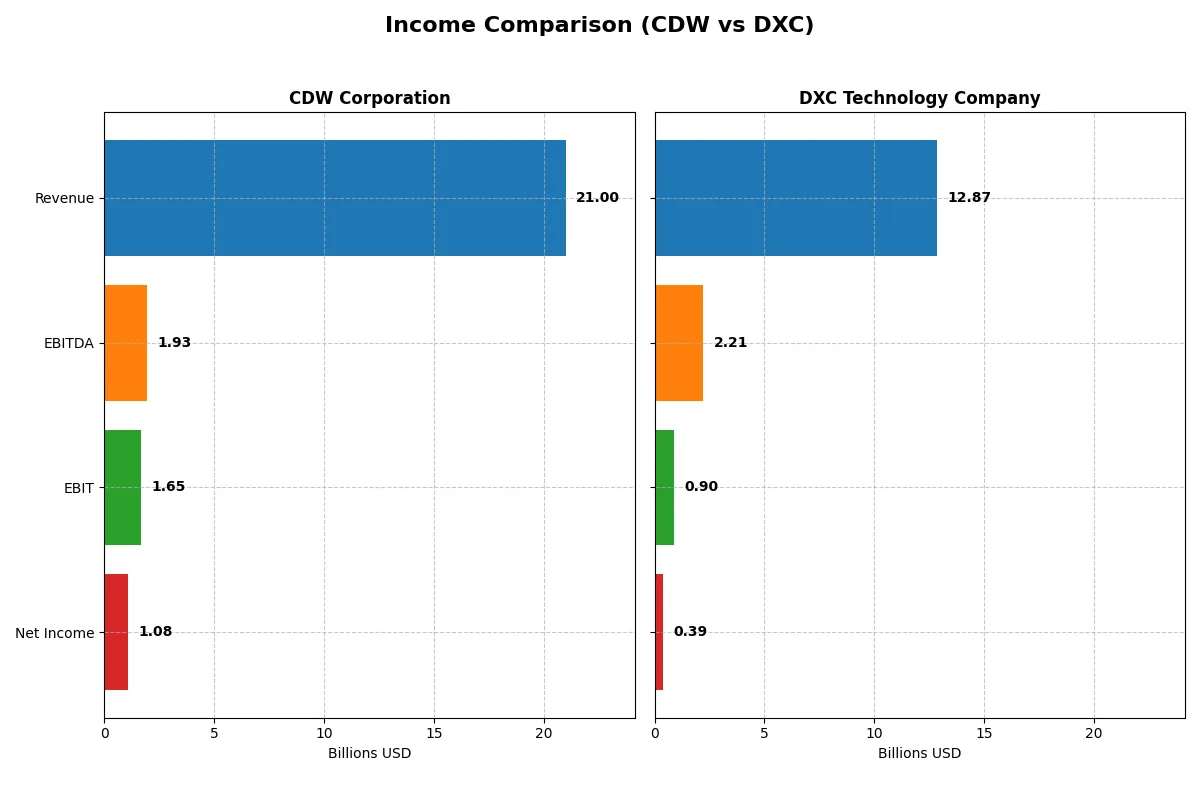
Income Statement Comparison
This data dissects the core profitability and scalability of both corporate engines to reveal who dominates the bottom line in the most recent fiscal year:
| Metric | CDW Corporation (CDW) | DXC Technology Company (DXC) |
|---|---|---|
| Revenue | 21B | 13B |
| Cost of Revenue | 16B | 10B |
| Operating Expenses | 2.95B | 2.4B |
| Gross Profit | 4.6B | 3.1B |
| EBITDA | 1.9B | 2.2B |
| EBIT | 1.65B | 0.9B |
| Interest Expense | 215M | 265M |
| Net Income | 1.08B | 389M |
| EPS | 8.06 | 2.15 |
| Fiscal Year | 2024 | 2025 |
Income Statement Analysis: The Bottom-Line Duel
The following income statement comparison reveals the true efficiency and profitability of each corporate engine over recent years.
CDW Corporation Analysis
CDW’s revenue peaked at 23.7B in 2022, then gradually declined to 21B in 2024, while net income grew overall to 1.08B in 2024. Its gross margin hovers near 22%, indicating stable cost control, while net margin at 5.13% remains favorable. Despite a slight recent dip in revenue and earnings, CDW maintains solid profitability and operational efficiency.
DXC Technology Company Analysis
DXC’s revenue fell sharply from 16.3B in 2021 to 12.9B in 2025, accompanied by volatile net income swinging from a loss of 568M in 2023 to a positive 389M in 2025. Gross margin stands at a higher 24%, but net margin is only 3.02%, reflecting margin pressure. Recent earnings growth shows momentum, yet the long-term revenue decline signals operational challenges.
Margin Stability vs. Revenue Resilience
CDW demonstrates superior revenue resilience and consistent net income growth over five years, with stable margins. DXC shows margin improvement and recent earnings recovery, but struggles with revenue shrinkage and fluctuating profitability. Investors seeking steady returns may favor CDW’s reliable profit engine, while DXC’s profile suits those targeting turnaround potential amid risk.
Financial Ratios Comparison
These vital ratios act as a diagnostic tool to expose the underlying fiscal health, valuation premiums, and capital efficiency of the companies compared below:
| Ratios | CDW Corporation (CDW) | DXC Technology Company (DXC) |
|---|---|---|
| ROE | 45.8% | 12.0% |
| ROIC | 13.1% | 4.4% |
| P/E | 21.6 | 7.9 |
| P/B | 9.9 | 1.0 |
| Current Ratio | 1.35 | 1.22 |
| Quick Ratio | 1.24 | 1.22 |
| D/E (Debt-to-Equity) | 2.55 | 1.41 |
| Debt-to-Assets | 40.8% | 34.4% |
| Interest Coverage | 7.7 | 2.63 |
| Asset Turnover | 1.43 | 0.97 |
| Fixed Asset Turnover | 67.3 | 6.82 |
| Payout Ratio | 30.8% | 0% |
| Dividend Yield | 1.43% | 0% |
| Fiscal Year | 2024 | 2025 |
Efficiency & Valuation Duel: The Vital Signs
Ratios act as a company’s DNA, uncovering hidden risks and operational strengths that raw numbers often mask.
CDW Corporation
CDW delivers strong profitability with a 45.8% ROE and favorable 13.1% ROIC, well above its 7.3% WACC. Its valuation is neutral; the P/E of 21.6 is balanced but a high P/B signals some overvaluation. CDW pays a modest 1.4% dividend, reflecting steady shareholder returns amid solid capital allocation.
DXC Technology Company
DXC shows weaker profitability, with a 12.1% ROE and 4.4% ROIC, below the WACC of 5.7%, indicating operational challenges. The stock trades at a low P/E of 7.9 and P/B of 0.95, suggesting undervaluation. DXC does not pay dividends, likely reinvesting cash flow to stabilize and pursue growth.
Balanced Profitability vs. Attractive Valuation
CDW offers superior operational efficiency and shareholder returns but trades at a premium valuation. DXC’s lower valuation appeals to value-oriented investors but comes with weaker profitability. Risk-tolerant investors may prefer DXC’s potential upside; those seeking stability might favor CDW’s robust fundamentals.
Which one offers the Superior Shareholder Reward?
I observe that CDW Corporation pays a consistent dividend yield around 1.4%, with a payout ratio near 30%, well-covered by free cash flow (90%+). CDW also maintains steady buybacks, enhancing total shareholder returns sustainably. In contrast, DXC Technology pays no dividends but aggressively reinvests in growth and acquisitions. DXC’s buyback activity is moderate, and its free cash flow coverage is weaker (~60-80%), raising sustainability concerns. For an investor in 2026, CDW’s balanced dividend and buyback model offers more reliable, long-term shareholder reward than DXC’s reinvestment-heavy but riskier approach.
Comparative Score Analysis: The Strategic Profile
The radar chart reveals the fundamental DNA and trade-offs of both firms, highlighting their strategic strengths and vulnerabilities across key financial metrics:
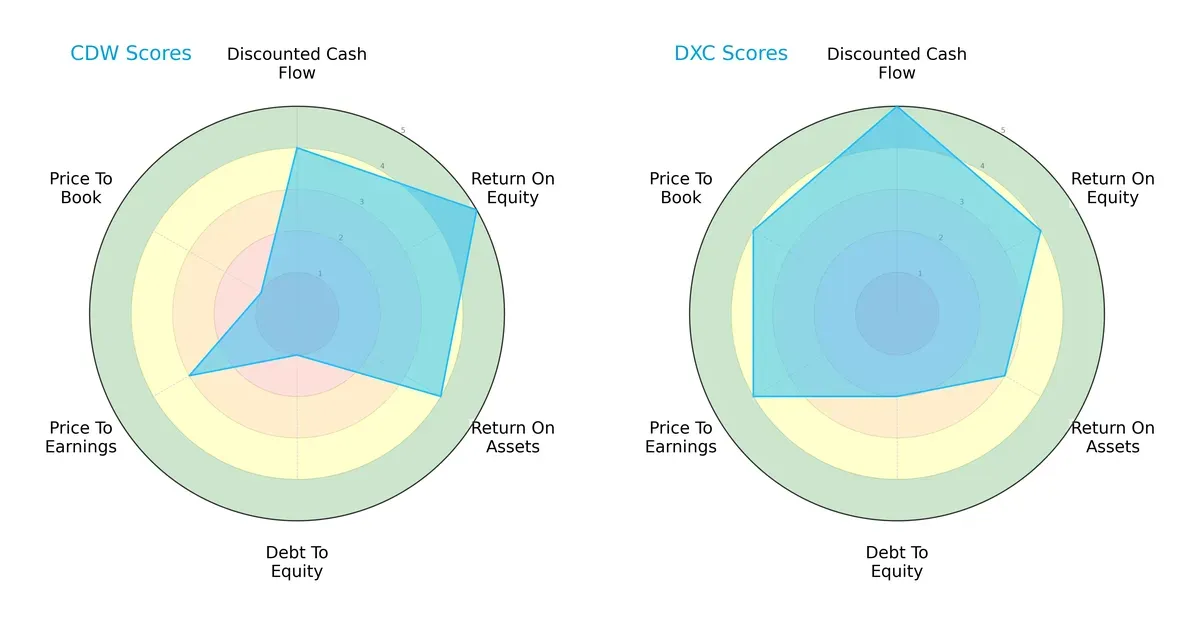
CDW shows a pronounced edge in return on equity (5 vs. 4) and return on assets (4 vs. 3), signaling operational efficiency and profit generation prowess. DXC excels in discounted cash flow (5 vs. 4) and valuation metrics (P/E 4 vs. 3; P/B 4 vs. 1), suggesting better market pricing and growth expectations. However, CDW’s very unfavorable debt-to-equity score (1 vs. 2) flags elevated financial risk. Overall, DXC presents a more balanced profile, relying on valuation strength and moderate leverage, while CDW depends heavily on profitability but carries financial risk.
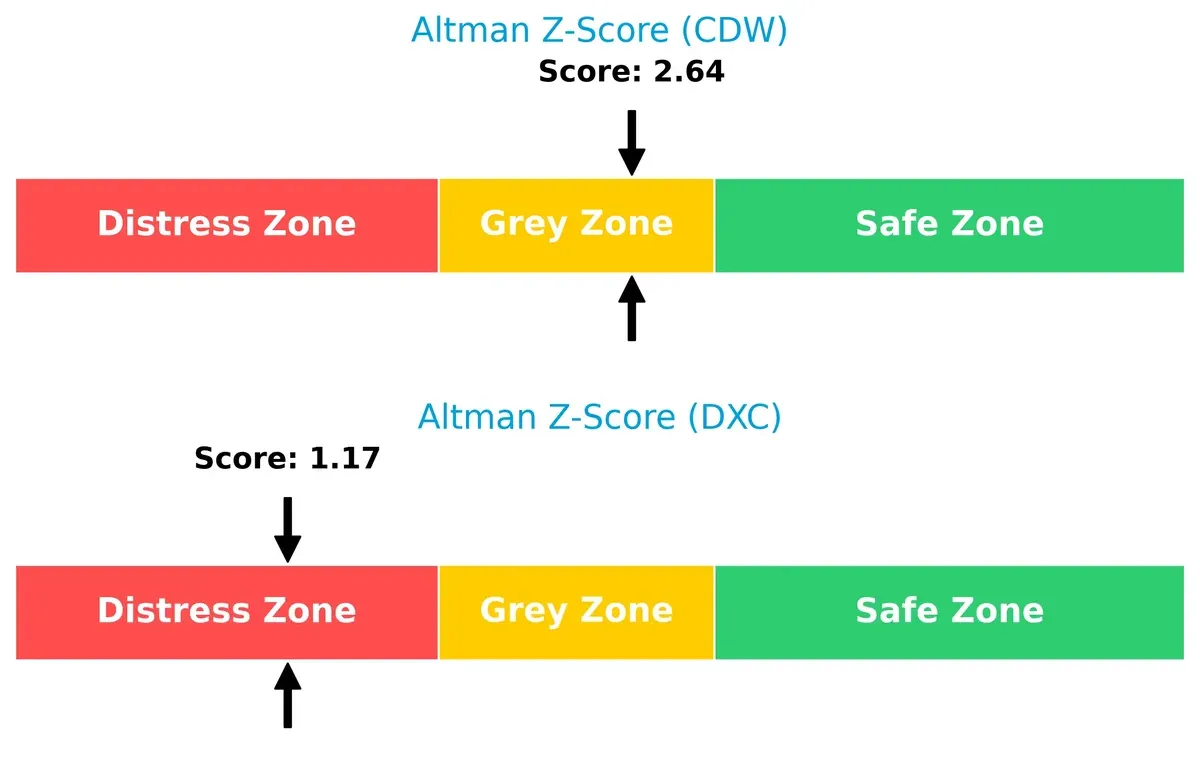
Bankruptcy Risk: Solvency Showdown
DXC’s Altman Z-Score (1.17) places it firmly in the distress zone, signaling a high bankruptcy risk under current economic cycles. CDW’s better score (2.64) sits in the grey zone, implying moderate risk but more resilience:
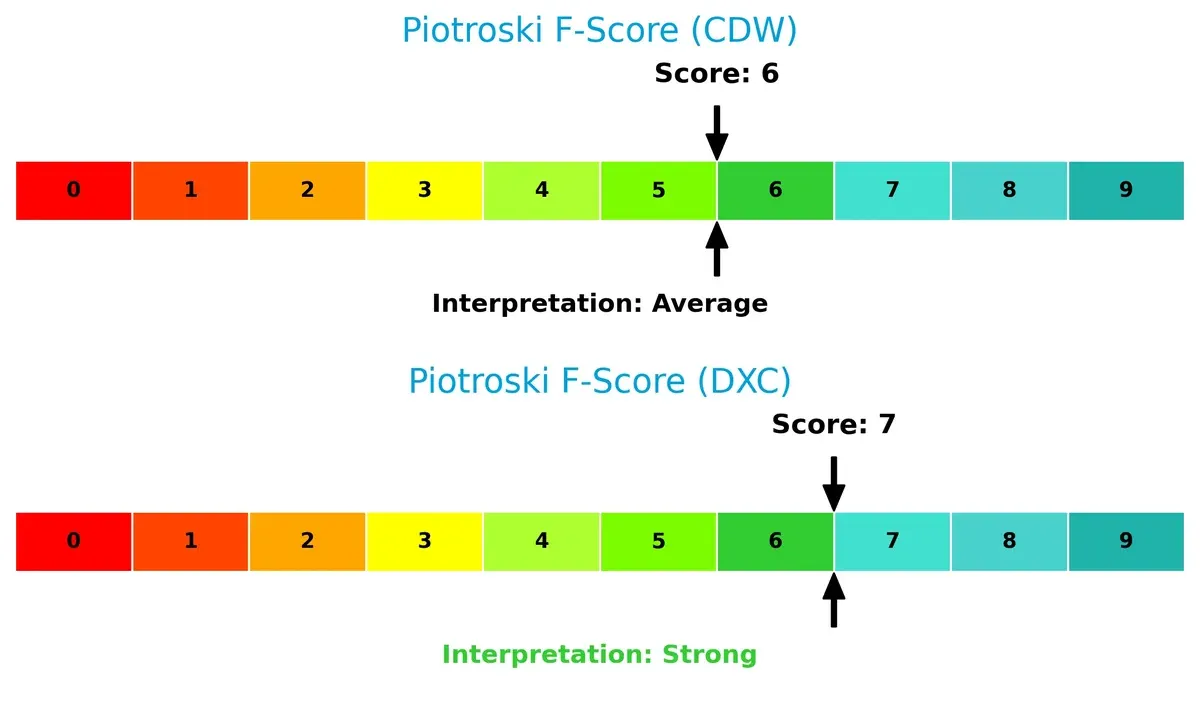
Financial Health: Quality of Operations
DXC’s Piotroski F-Score of 7 reflects stronger financial health and operational quality compared to CDW’s score of 6. CDW’s average score suggests some red flags in internal metrics, while DXC’s strong rating underlines superior fundamentals:
How are the two companies positioned?
This section dissects CDW and DXC’s operational DNA by comparing revenue distribution and internal dynamics. The goal is to confront their economic moats to identify which model offers the most resilient competitive advantage today.
Revenue Segmentation: The Strategic Mix
The following comparison dissects how CDW Corporation and DXC Technology Company diversify their income streams and reveals their primary sector bets:
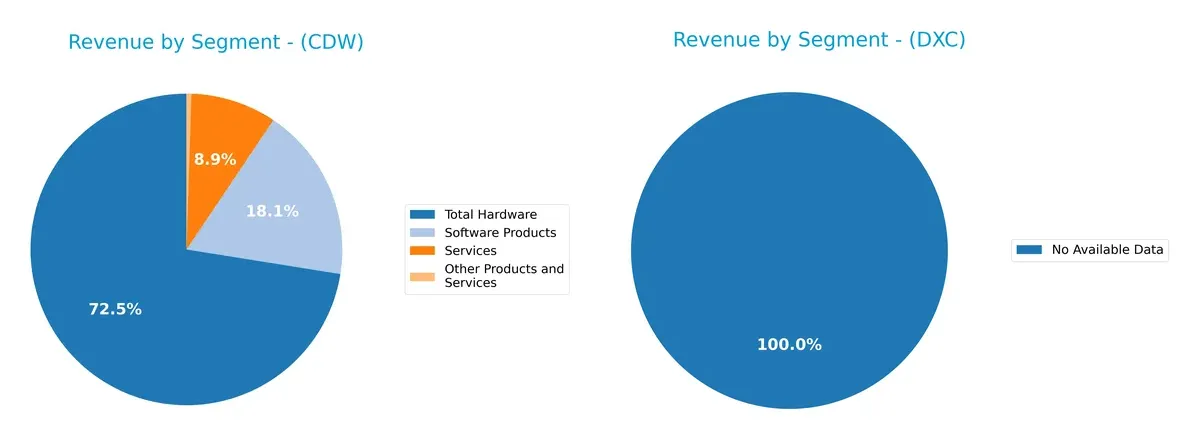
CDW’s revenue heavily anchors in Hardware at $15.2B, dwarfing its Software Products at $3.8B and Services at $1.9B. This concentration signals reliance on infrastructure sales. DXC lacks available data, preventing comparison. CDW’s narrow focus on hardware risks market shifts but leverages its ecosystem lock-in. I see CDW pivoting on infrastructure dominance rather than a balanced segment spread, exposing potential concentration risk.
Strengths and Weaknesses Comparison
This table compares the Strengths and Weaknesses of CDW Corporation and DXC Technology Company:
CDW Strengths
- Strong profitability with ROE at 45.81% and ROIC of 13.13%
- Favorable WACC at 7.31% supports capital efficiency
- High asset turnover indicates operational efficiency
- Diversified revenue from hardware, software, and services
- Significant U.S. and growing non-U.S. revenue base
DXC Strengths
- Attractive valuation with P/E of 7.92 and P/B close to 1
- Favorable WACC at 5.69% lowers cost of capital
- Quick ratio shows solid short-term liquidity
- Favorable fixed asset turnover supports asset utilization
- Neutral interest coverage indicates manageable interest expenses
CDW Weaknesses
- High debt-to-equity ratio at 2.55 signals leverage risk
- Unfavorable P/B ratio near 10 indicates possible overvaluation
- Net margin is only neutral at 5.13%
- Moderate current ratio of 1.35 limits liquidity buffer
DXC Weaknesses
- Lower profitability with net margin at 3.02% and ROIC of 4.43%
- Higher debt-to-equity at 1.41 presents financial risk
- Dividend yield of 0% may deter income-focused investors
- Asset turnover and interest coverage are neutral, limiting operational strength
CDW exhibits strong profitability and operational efficiency but carries higher leverage and valuation risks. DXC shows attractive valuation metrics and liquidity but struggles with profitability and moderate debt levels. These contrasts reflect differing strategic and financial positioning in their sectors.
The Moat Duel: Analyzing Competitive Defensibility
A structural moat is the only thing protecting long-term profits from the erosion of competition. Here’s how CDW Corporation and DXC Technology stack up:
CDW Corporation: Switching Costs Moat
CDW’s advantage stems from high switching costs embedded in complex IT solutions and managed services. This moat sustains strong ROIC above WACC, despite a recent downward trend. Expansion into hybrid cloud deepens its defensibility in 2026.
DXC Technology Company: Scale and Service Integration Moat
DXC leverages scale and integrated IT services, but unlike CDW, it struggles to convert this into value creation. Its ROIC lags WACC, signaling value destruction. Recent operational improvements may offer a turnaround opportunity.
Verdict: Switching Costs vs. Scale Efficiency
CDW holds the deeper moat through consistent value creation and customer lock-in. DXC’s scale advantage is undermined by shrinking ROIC and value loss. CDW is clearly better equipped to defend market share long term.
Which stock offers better returns?
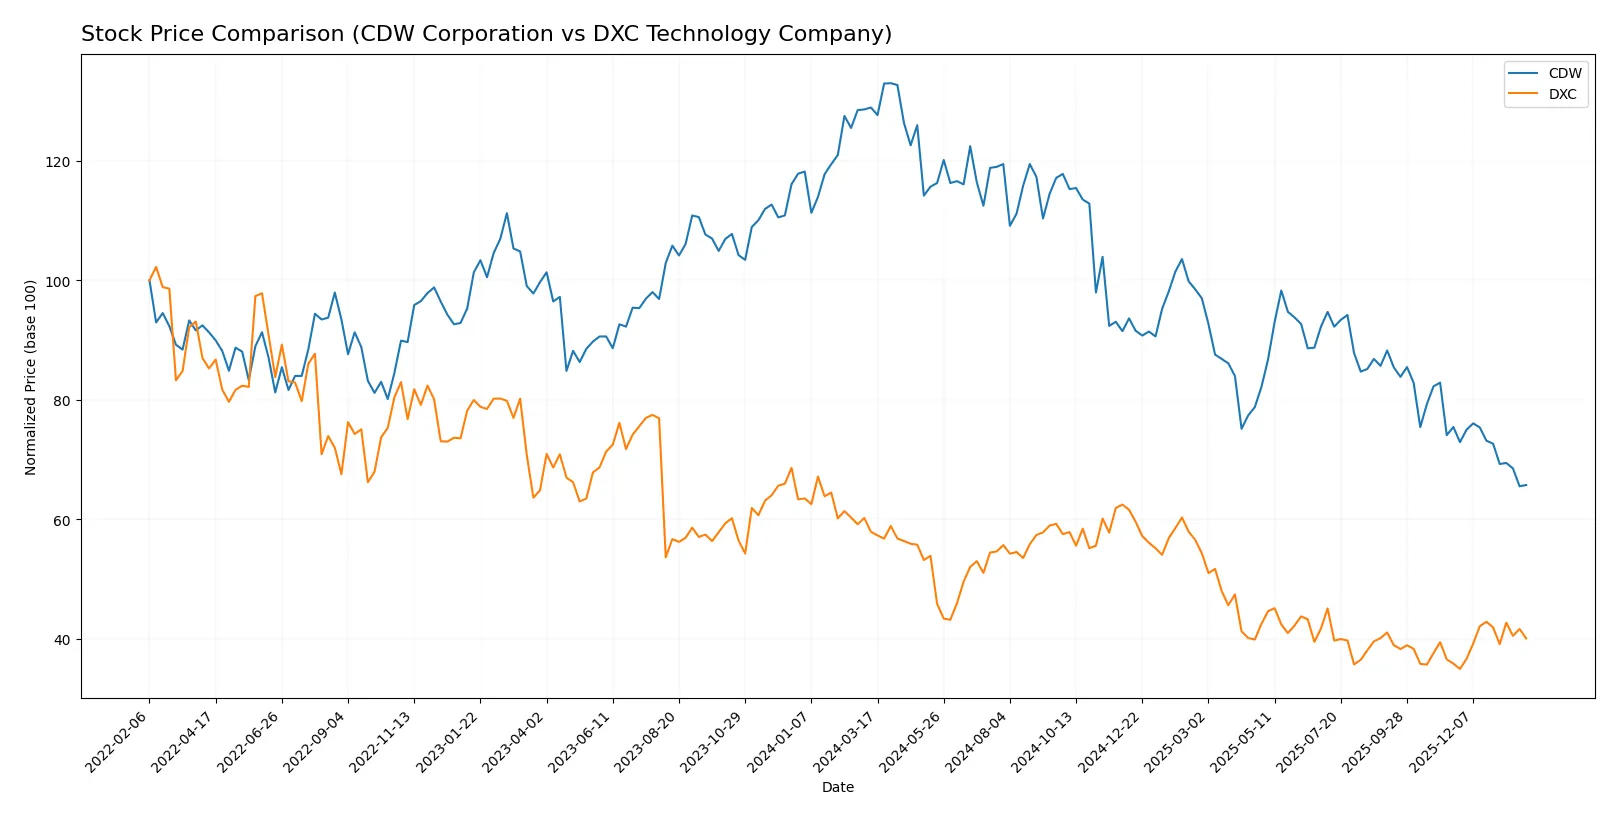
Over the past year, both CDW Corporation and DXC Technology Company experienced significant price shifts with contrasting recent momentum and volume dynamics reflecting divergent investor sentiment.
Trend Comparison
CDW Corporation’s stock price fell 49.03% over the past 12 months, marking a bearish trend with decelerating losses and high volatility (34.02 std deviation). The price ranged from a high of 255.78 to a low of 126.0.
DXC Technology Company’s stock declined 30.82% over the same period, also bearish but with accelerating losses and low volatility (3.0 std deviation). The price fluctuated between 22.5 and 12.59.
Comparing recent trends, DXC rebounded with an 11.77% gain since November 2025, while CDW continued declining by 12.88%. DXC delivered superior market performance over the past year.
Target Prices
Analysts present a clear consensus on target prices for CDW Corporation and DXC Technology Company.
| Company | Target Low | Target High | Consensus |
|---|---|---|---|
| CDW Corporation | 141 | 190 | 168.8 |
| DXC Technology Company | 13 | 14 | 13.5 |
The consensus target price for CDW sits roughly 33% above its current 126.39 price, signaling optimistic growth expectations. DXC’s target consensus at 13.5 slightly trails its current 14.43 price, suggesting limited upside or cautious outlooks.

Don’t Let Luck Decide Your Entry Point
Optimize your entry points with our advanced ProRealTime indicators. You’ll get efficient buy signals with precise price targets for maximum performance. Start outperforming now!
How do institutions grade them?
CDW Corporation Grades
The following table summarizes recent institutional grades for CDW Corporation:
| Grading Company | Action | New Grade | Date |
|---|---|---|---|
| Morgan Stanley | Downgrade | Equal Weight | 2026-01-20 |
| Citigroup | Maintain | Neutral | 2026-01-20 |
| Morgan Stanley | Maintain | Overweight | 2025-12-17 |
| Raymond James | Upgrade | Strong Buy | 2025-11-25 |
| UBS | Maintain | Buy | 2025-11-05 |
| Barclays | Maintain | Equal Weight | 2025-11-05 |
| Evercore ISI Group | Maintain | Outperform | 2025-10-20 |
| UBS | Maintain | Buy | 2025-08-07 |
| Barclays | Maintain | Equal Weight | 2025-08-07 |
| JP Morgan | Maintain | Neutral | 2025-07-17 |
DXC Technology Company Grades
The following table summarizes recent institutional grades for DXC Technology Company:
| Grading Company | Action | New Grade | Date |
|---|---|---|---|
| Stifel | Maintain | Hold | 2025-10-31 |
| JP Morgan | Maintain | Underweight | 2025-08-20 |
| Morgan Stanley | Maintain | Equal Weight | 2025-08-01 |
| RBC Capital | Maintain | Sector Perform | 2025-08-01 |
| JP Morgan | Maintain | Underweight | 2025-05-21 |
| RBC Capital | Maintain | Sector Perform | 2025-05-15 |
| BMO Capital | Maintain | Market Perform | 2025-05-15 |
| Morgan Stanley | Maintain | Equal Weight | 2025-05-15 |
| Guggenheim | Maintain | Neutral | 2025-05-12 |
| Susquehanna | Maintain | Neutral | 2025-04-23 |
Which company has the best grades?
CDW Corporation holds generally stronger grades, including “Strong Buy” and “Buy,” compared to DXC Technology’s consistent “Hold” and “Underweight.” This divergence may affect investor sentiment and valuation expectations.
Risks specific to each company
The following categories identify the critical pressure points and systemic threats facing both firms in the 2026 market environment:
1. Market & Competition
CDW Corporation
- Faces intense competition in IT solutions with moderate net margin and strong ROE indicating resilience.
DXC Technology Company
- Competes globally with weaker net margin and ROIC, reflecting pressure in digital transformation services.
2. Capital Structure & Debt
CDW Corporation
- High debt-to-equity ratio (2.55) signals risk despite favorable interest coverage.
DXC Technology Company
- Moderate debt-to-equity (1.41) with neutral interest coverage suggests manageable leverage but some risk.
3. Stock Volatility
CDW Corporation
- Beta 1.073 indicates slightly above-market volatility, typical for tech sector.
DXC Technology Company
- Beta 1.045 shows moderately stable stock but with higher average trading volume signaling liquidity risk.
4. Regulatory & Legal
CDW Corporation
- Operates in US, UK, Canada with standard IT regulatory exposure.
DXC Technology Company
- Broader geographic footprint increases exposure to diverse regulations and legal risks.
5. Supply Chain & Operations
CDW Corporation
- Integrated IT solutions rely on third-party providers, exposing it to supply chain disruptions.
DXC Technology Company
- Global services and infrastructure segments face complex operational challenges and supply dependencies.
6. ESG & Climate Transition
CDW Corporation
- ESG risks moderate; technology sector pressures to improve sustainability practices persist.
DXC Technology Company
- Larger global footprint increases ESG scrutiny but also more opportunities for climate transition initiatives.
7. Geopolitical Exposure
CDW Corporation
- Concentrated in North America and UK, geopolitical risk is moderate.
DXC Technology Company
- Operations span North America, Europe, Asia, and Australia, increasing vulnerability to geopolitical tensions.
Which company shows a better risk-adjusted profile?
CDW’s principal risk is its elevated leverage, which could constrain flexibility in a tightening credit market. DXC’s greatest concern lies in its financial distress signals, highlighted by a low Altman Z-score, increasing bankruptcy risk. Despite DXC’s weaker profitability, its stronger ratings and lower valuation multiples suggest a better risk-adjusted profile. CDW’s high debt-to-equity ratio contrasts with DXC’s better balance sheet score, but DXC’s distress zone Altman Z-score warns of potential solvency issues. This recent financial stress in DXC demands cautious monitoring, though its valuation merits attention from risk-tolerant investors.
Final Verdict: Which stock to choose?
CDW Corporation’s superpower lies in its ability to consistently create value with a strong ROIC well above its cost of capital. It demonstrates robust profitability and operational efficiency. A point of vigilance is its elevated leverage, which could amplify risks in a rising rate environment. CDW suits investors aiming for aggressive growth with a tolerance for balance sheet risk.
DXC Technology’s strategic moat centers on its attractive valuation metrics and improving free cash flow yield. It offers a more conservative risk profile compared to CDW, supported by moderate leverage and a favorable price-to-book ratio. DXC fits portfolios focused on growth at a reasonable price, appealing to value-conscious investors seeking stability.
If you prioritize enduring profitability and operational excellence, CDW outshines as the compelling choice due to its consistent value creation despite leverage concerns. However, if you seek better stability and undervaluation with a margin of safety, DXC offers superior downside protection and attractive entry points. Both stocks present distinct analytical scenarios tailored to different investor profiles.
Disclaimer: Investment carries a risk of loss of initial capital. The past performance is not a reliable indicator of future results. Be sure to understand risks before making an investment decision.
Go Further
I encourage you to read the complete analyses of CDW Corporation and DXC Technology Company to enhance your investment decisions: