Home > Comparison > Technology > CDW vs CTSH
The strategic rivalry between CDW Corporation and Cognizant Technology Solutions shapes the evolution of the technology services sector. CDW operates as a hardware and integrated IT solutions provider, focusing on discrete products and hybrid cloud capabilities. Cognizant excels as a global professional services firm, delivering consulting, outsourcing, and digital transformation across industries. This analysis assesses which firm’s business model and growth trajectory offer superior risk-adjusted returns for a diversified portfolio.

Table of contents
Companies Overview
CDW Corporation and Cognizant Technology Solutions Corporation stand as major players in the Information Technology Services sector.
CDW Corporation: Integrated IT Solutions Provider
CDW Corporation commands a strong market presence in North America offering integrated IT solutions. Its core revenue stems from selling hardware and software products combined with advisory, managed, and professional services. In 2026, CDW sharpened its focus on hybrid and cloud capabilities spanning data center, networking, and digital workspace solutions to capture growing enterprise demand.
Cognizant Technology Solutions Corporation: Global IT Consulting Giant
Cognizant leads as a global professional services firm delivering consulting and outsourcing across diverse industries. Its revenue engine revolves around digital transformation services including AI, analytics, robotic process automation, and customer experience enhancement. The company’s 2026 strategy emphasizes outcome-based contracting and omni-channel healthcare digitalization to fuel operational improvements.
Strategic Collision: Similarities & Divergences
Both firms compete in IT services but diverge sharply: CDW prefers a product-plus-service model, while Cognizant pursues high-touch consulting and digital transformation. Their battleground lies in winning large enterprise clients seeking hybrid cloud and automation solutions. CDW offers a hardware-anchored, integrated portfolio, whereas Cognizant presents deep industry specialization, shaping distinctly different risk and growth profiles for investors.
Income Statement Comparison
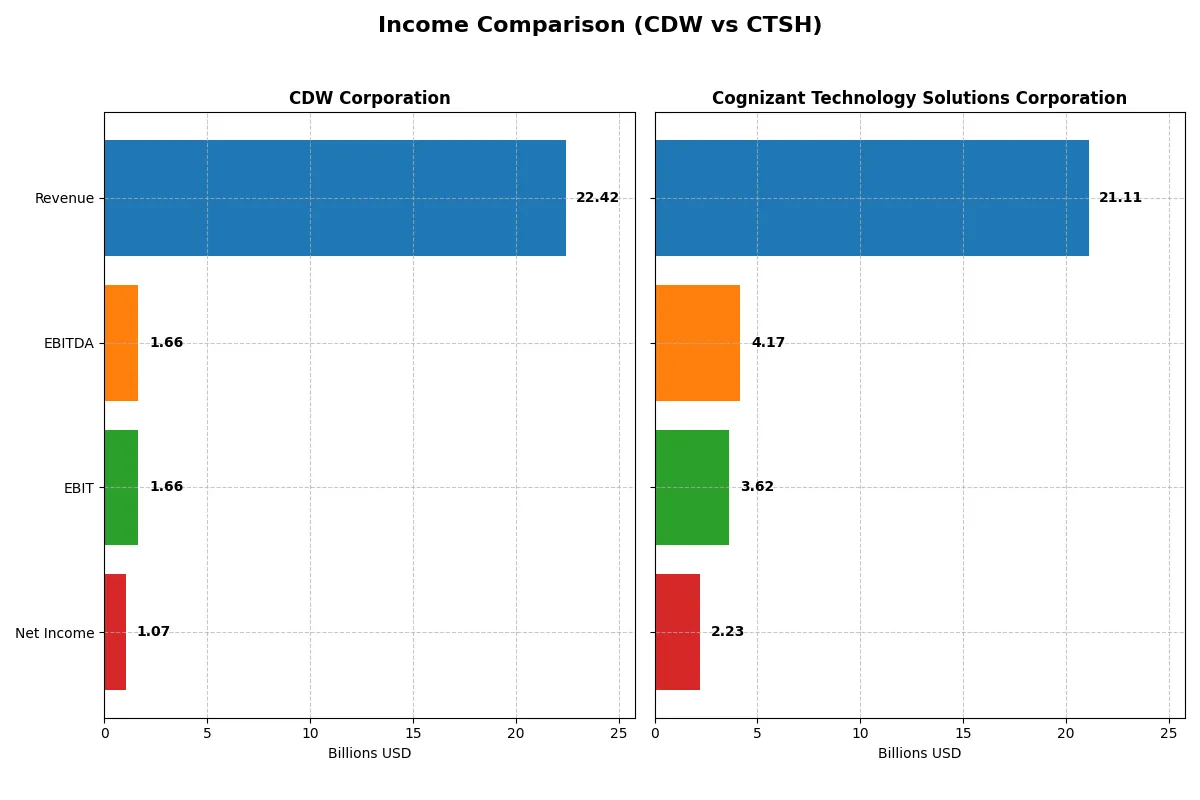
This data dissects the core profitability and scalability of both corporate engines to reveal who dominates the bottom line:
| Metric | CDW Corporation (CDW) | Cognizant Technology Solutions Corporation (CTSH) |
|---|---|---|
| Revenue | 22.4B | 21.1B |
| Cost of Revenue | 17.6B | 14.0B |
| Operating Expenses | 3.2B | 3.6B |
| Gross Profit | 4.9B | 7.1B |
| EBITDA | 1.7B | 4.2B |
| EBIT | 1.7B | 3.6B |
| Interest Expense | 227M | 37M |
| Net Income | 1.1B | 2.2B |
| EPS | 8.13 | 4.56 |
| Fiscal Year | 2025 | 2025 |
Income Statement Analysis: The Bottom-Line Duel
This income statement comparison reveals the true efficiency of each company’s profit engine and margin management over recent years.
CDW Corporation Analysis
CDW’s revenue edged up modestly from $21B in 2021 to $22.4B in 2025, showing steady growth. Net income advanced from $988M to $1.07B but saw slight volatility. Gross margin stayed favorable near 21.7%, while net margin hovered around 4.8%, reflecting mixed margin momentum. Operating expenses grew in line with revenue, limiting EBIT expansion to 0.35% last year.
Cognizant Technology Solutions Corporation Analysis
Cognizant’s revenue rose from $18.5B in 2021 to $21.1B in 2025, outperforming CDW’s growth rate. Net income climbed from $2.14B to $2.23B, although net margin slipped slightly to 10.6%. The firm maintains a robust gross margin of 33.7% and EBIT margin at 17.2%, highlighting superior operational efficiency. EBIT surged 21% last year, signaling strong momentum.
Margin Strength vs. Revenue Growth
Cognizant outperforms CDW with higher margins and more significant EBIT growth, reflecting sharper efficiency and scale benefits. CDW delivers steady revenue and moderate net income growth but struggles with margin pressure. For investors, Cognizant’s profile offers a more compelling blend of profitability and growth momentum.
Financial Ratios Comparison
These vital ratios act as a diagnostic tool to expose the underlying fiscal health, valuation premiums, and capital efficiency of the companies compared below:
| Ratios | CDW Corporation (CDW) | Cognizant Technology Solutions Corporation (CTSH) |
|---|---|---|
| ROE | 40.93% | 14.85% |
| ROIC | 12.17% | 12.31% |
| P/E | 16.77 | 17.90 |
| P/B | 6.86 | 2.66 |
| Current Ratio | 1.18 | 2.34 |
| Quick Ratio | 1.10 | 2.34 |
| D/E (Debt to Equity) | 2.42 | 0.10 |
| Debt-to-Assets | 39.29% | 7.61% |
| Interest Coverage | 7.28 | 95.38 |
| Asset Turnover | 1.40 | 1.02 |
| Fixed Asset Turnover | 72.76 | 14.02 |
| Payout ratio | 30.84% | 27.35% |
| Dividend yield | 1.84% | 1.53% |
| Fiscal Year | 2025 | 2025 |
Efficiency & Valuation Duel: The Vital Signs
Ratios act as a company’s DNA, uncovering hidden risks and operational excellence that numbers alone cannot reveal.
CDW Corporation
CDW posts a strong ROE of 40.93%, signaling exceptional profitability, though its net margin is only 4.76%, which is less impressive. The P/E ratio at 16.77 suggests a fairly valued stock, but a high P/B of 6.86 flags potential overvaluation. CDW returns value through a 1.84% dividend yield, balancing payouts with reinvestment prudently.
Cognizant Technology Solutions Corporation
Cognizant shows a solid net margin of 10.56%, outperforming CDW’s profitability, with a moderate ROE of 14.85%. Its P/E ratio of 17.9 positions the stock as fairly priced, supported by a reasonable P/B of 2.66. The company maintains financial strength with a 1.53% dividend yield and a conservative capital structure, reflecting stable shareholder returns.
Balanced Profitability vs. Financial Strength
Cognizant offers a more favorable overall ratio profile, combining superior margins and lower leverage with consistent returns. CDW’s higher ROE contrasts with weaker margin and balance sheet signals, creating a riskier valuation backdrop. Investors seeking operational efficiency may prefer CDW; those prioritizing financial stability and steady profitability might lean towards Cognizant.
Which one offers the Superior Shareholder Reward?
I see CDW and Cognizant (CTSH) both pay dividends, but their approaches differ sharply. CDW yields 1.84% with a 31% payout ratio, backed by strong free cash flow coverage near 90%. CTSH yields 1.53% at a 27% payout with similarly solid FCF coverage. CDW’s buybacks are aggressive, leveraging high debt-to-equity (2.42) to boost returns, while CTSH maintains low leverage (0.10) and modest buybacks, emphasizing balance sheet strength. Historically, CDW’s distribution is more levered but riskier, aiming for immediate shareholder reward. CTSH favors sustainable growth with moderate returns. For 2026, I favor CDW for total shareholder return, accepting higher risk for greater cash return intensity.
Comparative Score Analysis: The Strategic Profile
The radar chart reveals the fundamental DNA and trade-offs of CDW Corporation and Cognizant Technology Solutions Corporation, highlighting their core strengths and weaknesses:

CDW excels in Return on Equity (5) and Return on Assets (4), showing strong profitability and asset efficiency. However, it suffers a very unfavorable Debt/Equity score (1), signaling high financial risk. Cognizant offers a more balanced profile with solid ROA (5), moderate Debt/Equity (3), and favorable valuation metrics. Cognizant’s overall score (4) surpasses CDW’s (3), reflecting steadier financial health and risk management.
—
Bankruptcy Risk: Solvency Showdown
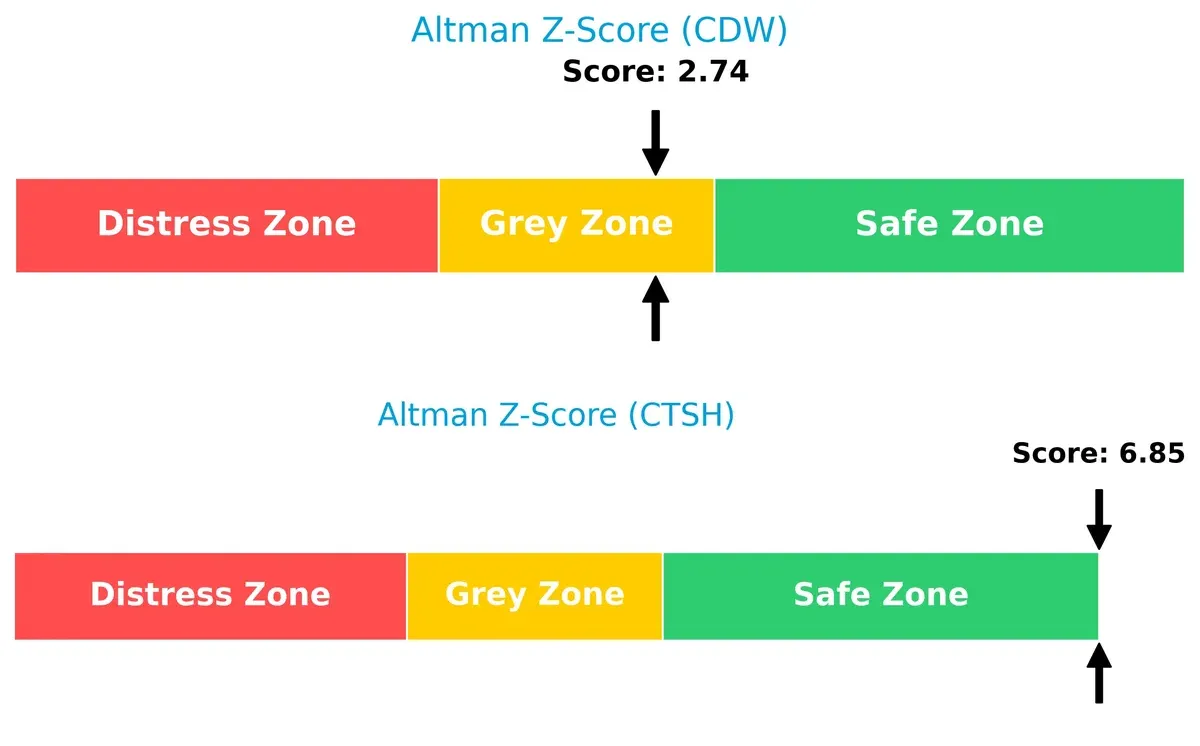
Cognizant’s Altman Z-Score (6.85) places it firmly in the safe zone, indicating low bankruptcy risk, while CDW’s score (2.74) sits in the grey zone, suggesting moderate risk during economic fluctuations:
—
Financial Health: Quality of Operations
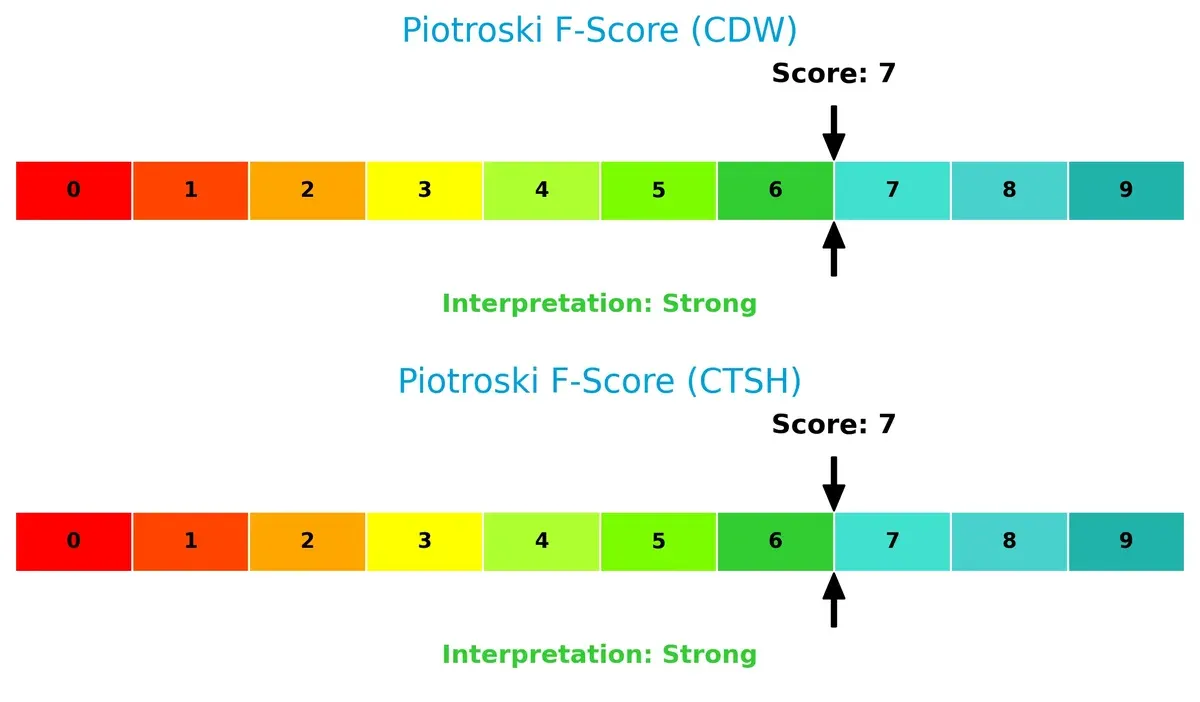
Both firms share a strong Piotroski F-Score of 7, signaling robust operational quality and financial strength with no immediate red flags detected in either company’s fundamentals:
How are the two companies positioned?
This section dissects CDW and CTSH’s operational DNA by comparing revenue distribution and internal strengths and weaknesses. The goal is to confront their economic moats and identify which model offers the most resilient, sustainable competitive advantage today.
Revenue Segmentation: The Strategic Mix
This visual comparison dissects how CDW Corporation and Cognizant Technology Solutions diversify their income streams and where their primary sector bets lie:
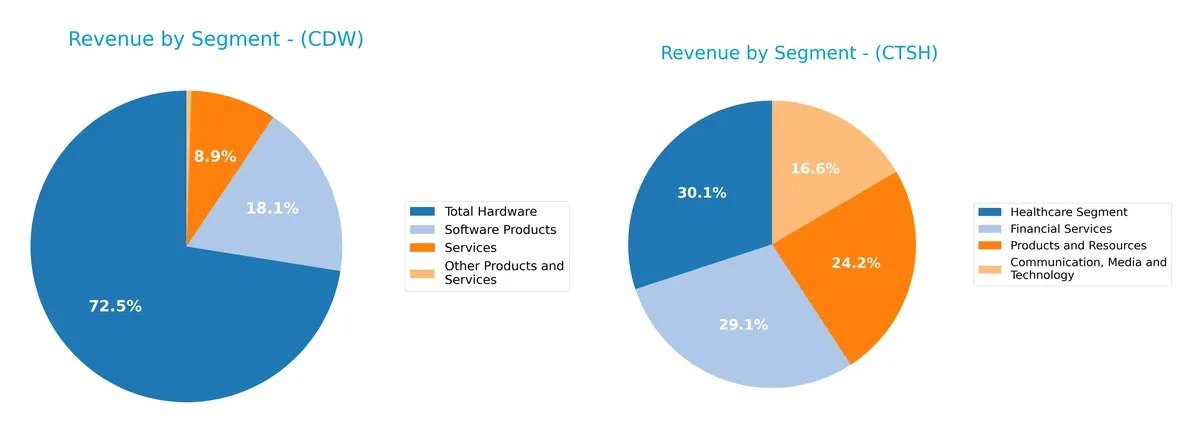
CDW leans heavily on Total Hardware, generating $15.2B in 2024, dwarfing its Software Products ($3.8B) and Services ($1.87B). This concentration underscores infrastructure dominance but exposes it to hardware market risks. Conversely, Cognizant spreads revenue more evenly across Financial Services ($5.75B), Healthcare ($5.93B), Products and Resources ($4.78B), and Communication ($3.27B). This diversification mitigates sector-specific shocks and anchors Cognizant’s ecosystem lock-in strategy.
Strengths and Weaknesses Comparison
This table compares the Strengths and Weaknesses of CDW Corporation and Cognizant Technology Solutions Corporation:
CDW Strengths
- Diverse revenue streams across hardware, software, and services
- Strong profitability with ROE of 40.93% and ROIC above WACC
- Solid asset turnover ratios indicating efficient use of assets
- Balanced US and Non-US revenue mix supporting geographic presence
CTSH Strengths
- Favorable net margin of 10.56% showing operational efficiency
- Strong liquidity with current and quick ratios above 2.3
- Low debt levels reflected in debt-to-equity and debt-to-assets ratios
- Broad geographic diversification including Europe and North America
- Consistent revenue from multiple business segments including healthcare and financial services
CDW Weaknesses
- Low net margin at 4.76% may pressure profitability
- High debt-to-equity ratio of 2.42 signals leverage risk
- Unfavorable price-to-book ratio suggesting valuation concerns
- Heavy reliance on US market limits global diversification
- Neutral liquidity ratios could constrain short-term flexibility
CTSH Weaknesses
- Moderate ROE of 14.85% is less impressive compared to peers
- Neutral price-to-earnings and price-to-book ratios indicate fair valuation
- Reliance on North America still significant despite global reach
- Neutral WACC may cap returns on invested capital
- Dividend yield slightly lower than CDW’s neutral stance
CDW shows operational efficiency and strong returns but bears leverage and limited geographic diversification risks. CTSH demonstrates solid profitability and liquidity with wider global exposure but presents moderate returns and some valuation constraints. Both companies reflect distinct strategic profiles influencing their financial resilience.
The Moat Duel: Analyzing Competitive Defensibility
A structural moat is the only thing protecting long-term profits from the erosion of competition. Let’s dissect the moats of two IT giants:
CDW Corporation: Integrated Solutions Switching Costs
CDW’s moat stems from switching costs tied to its integrated IT solutions across hardware and software. This generates stable gross margins near 22%. In 2026, expanding cloud and hybrid offerings could deepen this advantage but margin pressure looms from rising operational costs.
Cognizant Technology Solutions Corporation: Specialized Service Intangibles
Cognizant’s moat relies on intangible assets—deep industry expertise and digital transformation services. It commands superior margins, with EBIT at 17%, outpacing CDW substantially. Despite a declining ROIC trend, Cognizant’s global footprint offers avenues for growth in AI and automation services.
Moat Strength Showdown: Switching Costs vs. Intangible Expertise
Both companies create value with ROIC above WACC, but CDW’s moat is more stable, while Cognizant’s is wider but more volatile. CDW’s integrated solutions better defend market share, but Cognizant’s specialized expertise fuels stronger margin upside long term.
Which stock offers better returns?
The past year reveals contrasting dynamics: CDW Corporation’s stock sharply declined while Cognizant Technology Solutions Corporation showed moderate appreciation and accelerating momentum.
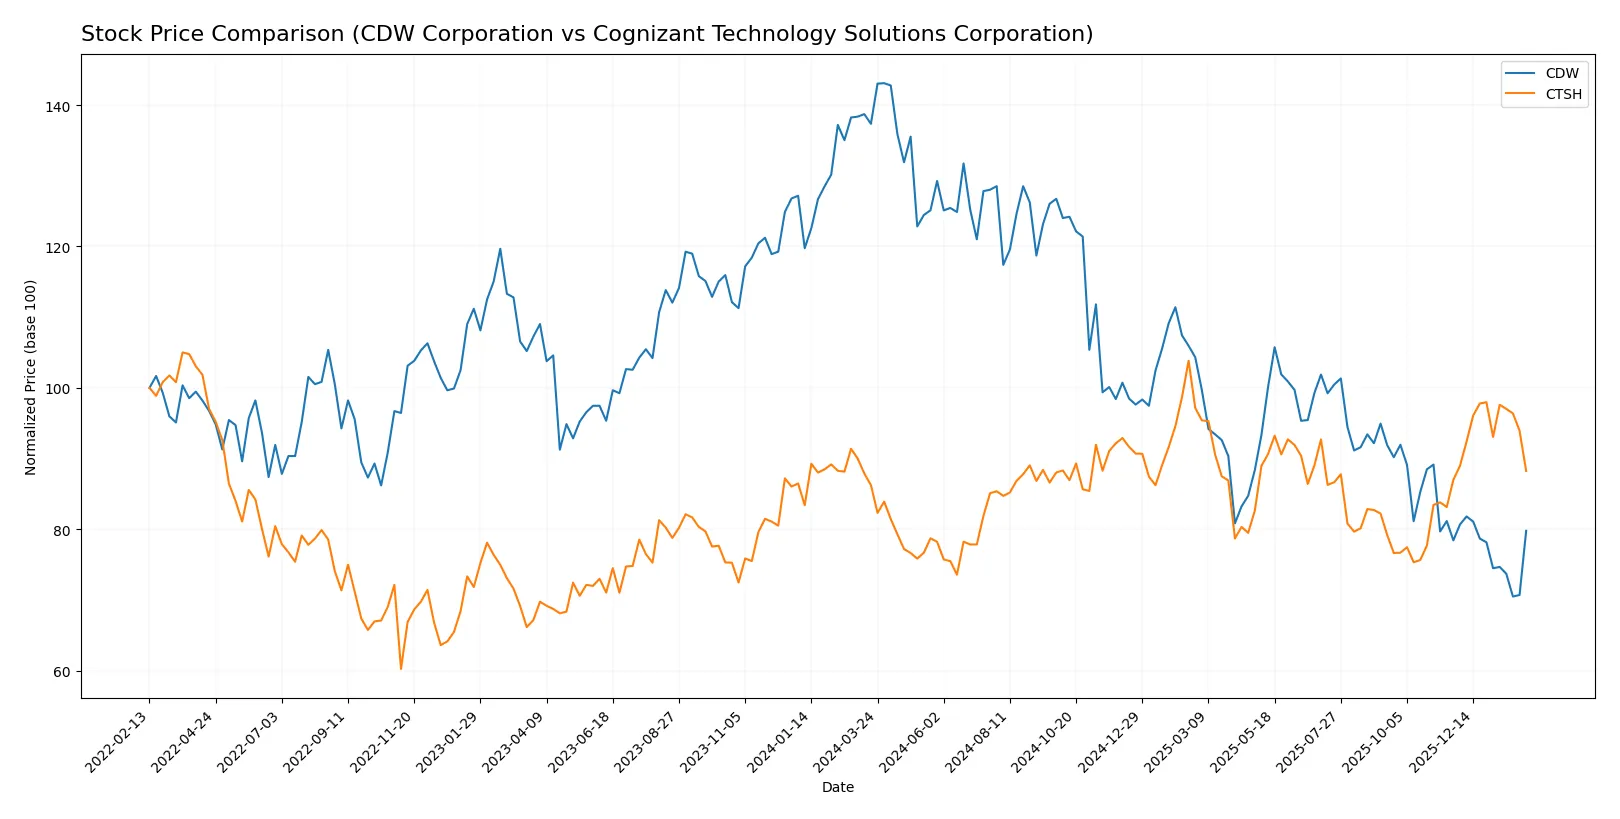
Trend Comparison
CDW Corporation’s stock price fell 41.91% over the past 12 months, marking a bearish trend with decelerating decline and high volatility. The price ranged from a high of 255.78 to a low of 126.0.
Cognizant Technology Solutions Corporation’s stock rose 2.32% in the same period, reflecting a bullish trend with accelerating momentum and lower volatility. The price fluctuated between 64.26 and 90.7.
Comparing both stocks, Cognizant outperformed CDW with positive returns and growing momentum, while CDW’s steep decline indicates weaker market performance.
Target Prices
Analysts expect moderate upside for CDW Corporation and Cognizant Technology Solutions Corporation based on current target price consensus.
| Company | Target Low | Target High | Consensus |
|---|---|---|---|
| CDW Corporation | 141 | 185 | 162.4 |
| Cognizant Technology Solutions Corporation | 82 | 107 | 93.2 |
CDW’s consensus target price is roughly 14% above its current price of 142.62, signaling moderate growth expectations. Cognizant’s target consensus exceeds its 77.08 price by about 21%, indicating stronger analyst optimism.

Don’t Let Luck Decide Your Entry Point
Optimize your entry points with our advanced ProRealTime indicators. You’ll get efficient buy signals with precise price targets for maximum performance. Start outperforming now!
How do institutions grade them?
CDW Corporation Grades
The table below summarizes recent institutional grades for CDW Corporation:
| Grading Company | Action | New Grade | Date |
|---|---|---|---|
| Citigroup | Maintain | Neutral | 2026-02-05 |
| UBS | Maintain | Buy | 2026-02-05 |
| Morgan Stanley | Maintain | Equal Weight | 2026-02-05 |
| JP Morgan | Maintain | Neutral | 2026-02-05 |
| Barclays | Maintain | Equal Weight | 2026-02-05 |
| Morgan Stanley | Downgrade | Equal Weight | 2026-01-20 |
| Citigroup | Maintain | Neutral | 2026-01-20 |
| Morgan Stanley | Maintain | Overweight | 2025-12-17 |
| Raymond James | Upgrade | Strong Buy | 2025-11-25 |
| UBS | Maintain | Buy | 2025-11-05 |
Cognizant Technology Solutions Corporation Grades
The following table shows recent institutional grades for Cognizant Technology Solutions Corporation:
| Grading Company | Action | New Grade | Date |
|---|---|---|---|
| TD Cowen | Maintain | Hold | 2026-02-05 |
| Morgan Stanley | Maintain | Equal Weight | 2026-02-05 |
| RBC Capital | Maintain | Sector Perform | 2026-02-05 |
| Guggenheim | Maintain | Buy | 2026-01-28 |
| Citigroup | Maintain | Neutral | 2026-01-22 |
| Wells Fargo | Maintain | Overweight | 2026-01-14 |
| TD Cowen | Maintain | Hold | 2026-01-09 |
| UBS | Maintain | Neutral | 2025-12-08 |
| William Blair | Upgrade | Outperform | 2025-11-21 |
| UBS | Maintain | Neutral | 2025-10-30 |
Which company has the best grades?
CDW Corporation holds a stronger consensus with multiple Buy and a Strong Buy from Raymond James. Cognizant’s grades cluster around Hold to Overweight, indicating more caution. Investors may interpret CDW’s higher-grade consistency as a sign of greater confidence among analysts.
Risks specific to each company
The following categories identify the critical pressure points and systemic threats facing both firms in the 2026 market environment:
1. Market & Competition
CDW Corporation
- Faces intense competition in IT hardware and software distribution with pressure on margins.
Cognizant Technology Solutions Corporation
- Competes globally in IT consulting and outsourcing with diversified sector exposure but faces pricing pressure.
2. Capital Structure & Debt
CDW Corporation
- High debt-to-equity ratio (2.42) signals leverage risk despite favorable interest coverage.
Cognizant Technology Solutions Corporation
- Low debt-to-equity ratio (0.10) indicates strong balance sheet and low financial risk.
3. Stock Volatility
CDW Corporation
- Beta near 1.05 implies stock moves roughly with market but with some volatility.
Cognizant Technology Solutions Corporation
- Beta below 1 (0.96) suggests lower volatility and defensive characteristics.
4. Regulatory & Legal
CDW Corporation
- Exposed to evolving data privacy and government contracting regulations in US, UK, Canada.
Cognizant Technology Solutions Corporation
- Faces complex international regulatory environments across healthcare, financial services, and tech sectors.
5. Supply Chain & Operations
CDW Corporation
- Relies on third-party hardware suppliers; risks from component shortages and logistics delays.
Cognizant Technology Solutions Corporation
- Operational complexity from global delivery model; risk from talent retention and client concentration.
6. ESG & Climate Transition
CDW Corporation
- Moderate ESG risks with opportunity to improve sustainability in product lifecycle and operations.
Cognizant Technology Solutions Corporation
- Increasing scrutiny on social and governance practices; climate initiatives critical for client trust.
7. Geopolitical Exposure
CDW Corporation
- Concentrated in North America and UK; geopolitical tensions could impact trade and data flows.
Cognizant Technology Solutions Corporation
- Broad international footprint exposes it to geopolitical instability in multiple regions.
Which company shows a better risk-adjusted profile?
Cognizant’s low leverage and strong liquidity position it with a superior risk-adjusted profile compared to CDW. CDW’s elevated debt ratio is a key vulnerability. Cognizant’s Altman Z-score of 6.85 places it safely in the secure zone, while CDW’s 2.74 score signals moderate financial risk. This difference highlights Cognizant’s stronger balance sheet resilience amid market pressures.
Final Verdict: Which stock to choose?
CDW Corporation’s superpower lies in its ability to generate strong returns on equity and invested capital, signaling efficient capital allocation. However, its elevated debt levels remain a point of vigilance. It suits aggressive growth portfolios willing to tolerate leverage for potential value creation.
Cognizant Technology Solutions benefits from a robust strategic moat built on stable recurring revenue and a pristine balance sheet. Its financial safety profile surpasses CDW’s, offering steadier cash flow generation. This aligns well with GARP investors seeking growth tempered by reasonable risk.
If you prioritize aggressive capital efficiency and value creation, CDW is the compelling choice due to its higher ROE and focused capital deployment despite leverage risks. However, if you seek stability combined with steady growth, Cognizant offers better balance sheet strength and consistent cash flows, commanding a premium for risk-conscious portfolios.
Disclaimer: Investment carries a risk of loss of initial capital. The past performance is not a reliable indicator of future results. Be sure to understand risks before making an investment decision.
Go Further
I encourage you to read the complete analyses of CDW Corporation and Cognizant Technology Solutions Corporation to enhance your investment decisions: