In the rapidly evolving software infrastructure sector, Wix.com Ltd. and CCC Intelligent Solutions Holdings Inc. stand out as innovators with distinct yet overlapping market focuses. Wix empowers millions globally with user-friendly website creation tools, while CCC revolutionizes insurance workflows through AI-driven cloud solutions. Comparing these two tech companies offers valuable insights into their growth potential and innovation strategies. Join me as we explore which company presents the most compelling opportunity for your investment portfolio.

Table of contents
Companies Overview
I will begin the comparison between Wix.com Ltd. and CCC Intelligent Solutions Holdings Inc. by providing an overview of these two companies and their main differences.
Wix.com Ltd. Overview
Wix.com Ltd. develops and markets a cloud-based platform that enables users worldwide to create websites and web applications. The company’s mission focuses on empowering individuals and businesses with tools like Wix Editor, Wix ADI, and complementary services such as Wix Payments and Wix Arena. Headquartered in Tel Aviv, Wix serves over 222M registered users and 6M premium subscribers, positioning itself as a leader in website infrastructure software.
CCC Intelligent Solutions Holdings Inc. Overview
CCC Intelligent Solutions Holdings provides cloud, AI, and telematics technologies for the property and casualty insurance economy. Its SaaS platform digitizes insurance workflows and connects businesses including carriers, repairers, and manufacturers. Founded in 1980 and based in Chicago, CCC focuses on AI-enabled solutions across insurance, repair, parts, and financial services, aiming to streamline processes in the insurance ecosystem.
Key similarities and differences
Both Wix and CCC operate in the Software – Infrastructure industry, leveraging cloud and AI technologies to serve business clients. Wix targets website creation and online business management globally, while CCC specializes in digital transformation within the insurance sector. Wix has a larger user base and premium subscriptions, whereas CCC emphasizes specialized SaaS for insurance workflows, reflecting distinct market focuses despite overlapping technological foundations.
Income Statement Comparison
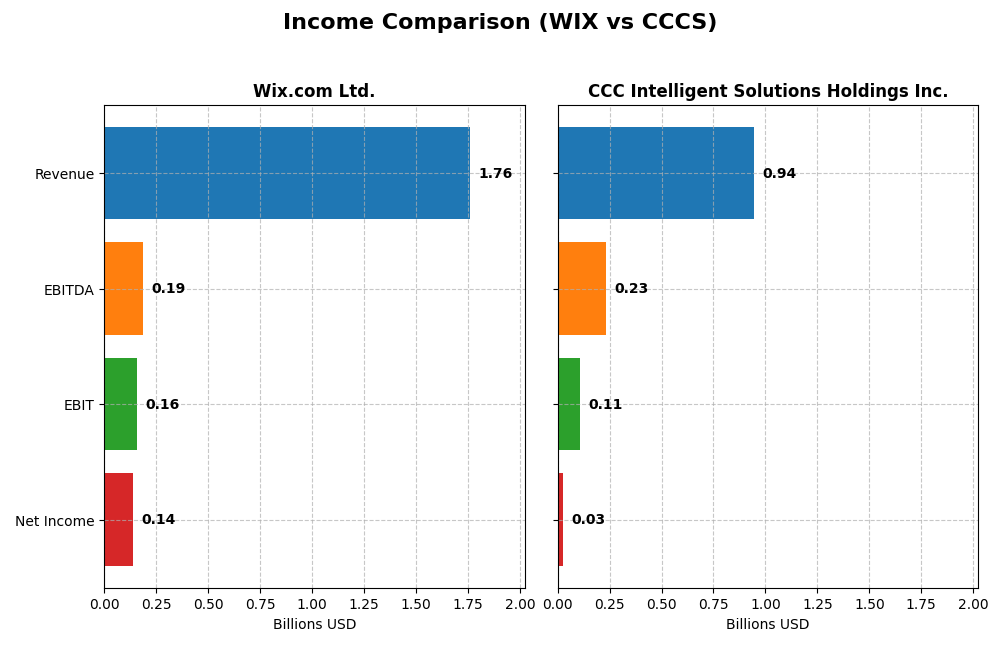
The table below provides a side-by-side comparison of the key income statement metrics for Wix.com Ltd. and CCC Intelligent Solutions Holdings Inc. for the fiscal year 2024.
| Metric | Wix.com Ltd. (WIX) | CCC Intelligent Solutions Holdings Inc. (CCCS) |
|---|---|---|
| Market Cap | 4.46B | 5.63B |
| Revenue | 1.76B | 945M |
| EBITDA | 186M | 233M |
| EBIT | 155M | 109M |
| Net Income | 138M | 26M |
| EPS | 2.49 | 0.043 |
| Fiscal Year | 2024 | 2024 |
Income Statement Interpretations
Wix.com Ltd.
Wix.com Ltd. displayed consistent revenue growth from 2020 to 2024, reaching $1.76B in 2024, with net income turning positive at $138M after prior losses. Gross margins remained favorable around 67.9%, while net margins improved significantly to 7.9%. The 2024 fiscal year saw a strong rebound in profitability, with EBITDA and net income surging, reflecting improved operational efficiency and margin expansion.
CCC Intelligent Solutions Holdings Inc.
CCC Intelligent Solutions achieved steady revenue growth from $633M in 2020 to $945M in 2024, with net income recovering to $26M after previous losses. The company maintained a high gross margin of 75.6%, while EBIT margin rose to 11.5%. The 2024 year saw positive EBIT and net income, supported by effective cost control, although net margin remained modest at 2.8%, indicating room for further profitability enhancement.
Which one has the stronger fundamentals?
Both companies exhibit favorable income statement trends with revenue growth and margin improvements. Wix.com shows a more pronounced recovery in net income and margin expansion, while CCC Intelligent Solutions holds higher gross and EBIT margins but lower net margins. Wix’s stronger net margin growth contrasts with CCC’s more stable operational profitability, reflecting differing strengths in fundamental performance.
Financial Ratios Comparison
Below is a comparison of key financial ratios for Wix.com Ltd. (WIX) and CCC Intelligent Solutions Holdings Inc. (CCCS) for the fiscal year 2024.
| Ratios | Wix.com Ltd. (WIX) | CCC Intelligent Solutions (CCCS) |
|---|---|---|
| ROE | -175.6% | 1.31% |
| ROIC | 9.13% | 1.86% |
| P/E | 86.21 | 274.02 |
| P/B | -151.35 | 3.59 |
| Current Ratio | 0.84 | 3.65 |
| Quick Ratio | 0.84 | 3.65 |
| D/E (Debt-to-Equity) | -12.31 | 0.42 |
| Debt-to-Assets | 50.70% | 26.65% |
| Interest Coverage | 25.92 | 1.24 |
| Asset Turnover | 0.92 | 0.30 |
| Fixed Asset Turnover | 3.33 | 4.68 |
| Payout Ratio | 0 | 0 |
| Dividend Yield | 0% | 0% |
Interpretation of the Ratios
Wix.com Ltd.
Wix.com Ltd. shows a mixed ratio profile with some strengths such as a favorable price-to-book ratio and strong interest coverage of 40.14. However, concerns arise from a low current ratio of 0.84 and an unfavorable return on equity at -175.57%, suggesting financial leverage challenges. The company does not pay dividends, reflecting a reinvestment strategy focused on growth and innovation.
CCC Intelligent Solutions Holdings Inc.
There is no available data for CCC Intelligent Solutions Holdings Inc. regarding key financial ratios or dividend payments, preventing an assessment of its financial health or shareholder returns. The absence of such data limits the ability to compare its operational or financial strength relative to peers.
Which one has the best ratios?
Based on the available information, Wix.com Ltd. provides a clearer view of its financial ratios, revealing a slightly unfavorable overall profile with a balance of favorable and unfavorable metrics. Without comparable data for CCC Intelligent Solutions Holdings Inc., Wix.com Ltd. stands as the only company with assessable ratios, though caution is warranted due to mixed signals in its financial health.
Strategic Positioning
This section compares the strategic positioning of Wix.com Ltd. and CCC Intelligent Solutions Holdings Inc., including market position, key segments, and exposure to technological disruption:
Wix.com Ltd.
- Market position and competitive pressure
- Key segments and business drivers
- Exposure to technological disruption
CCC Intelligent Solutions Holdings Inc.
- Mid-cap software infrastructure firm with global user base; faces tech sector competition
- Creative subscriptions and business solutions drive revenue growth globally
- Cloud-based platform with AI-driven tools for website creation and business management
Wix.com Ltd. vs CCC Intelligent Solutions Holdings Inc. Positioning
Wix shows a diversified approach with multiple business solutions and creative subscription products across global markets. CCC concentrates on specialized SaaS for the insurance sector, leveraging AI and telematics. Wix’s broader market may offer wider growth avenues, while CCC’s focus supports deep domain expertise.
Which has the best competitive advantage?
Based on MOAT evaluation, Wix is currently shedding value despite growing profitability, while CCC lacks available MOAT data. Thus, Wix’s competitive advantage is slightly unfavorable but improving; no definitive advantage can be assessed for CCC.
Stock Comparison
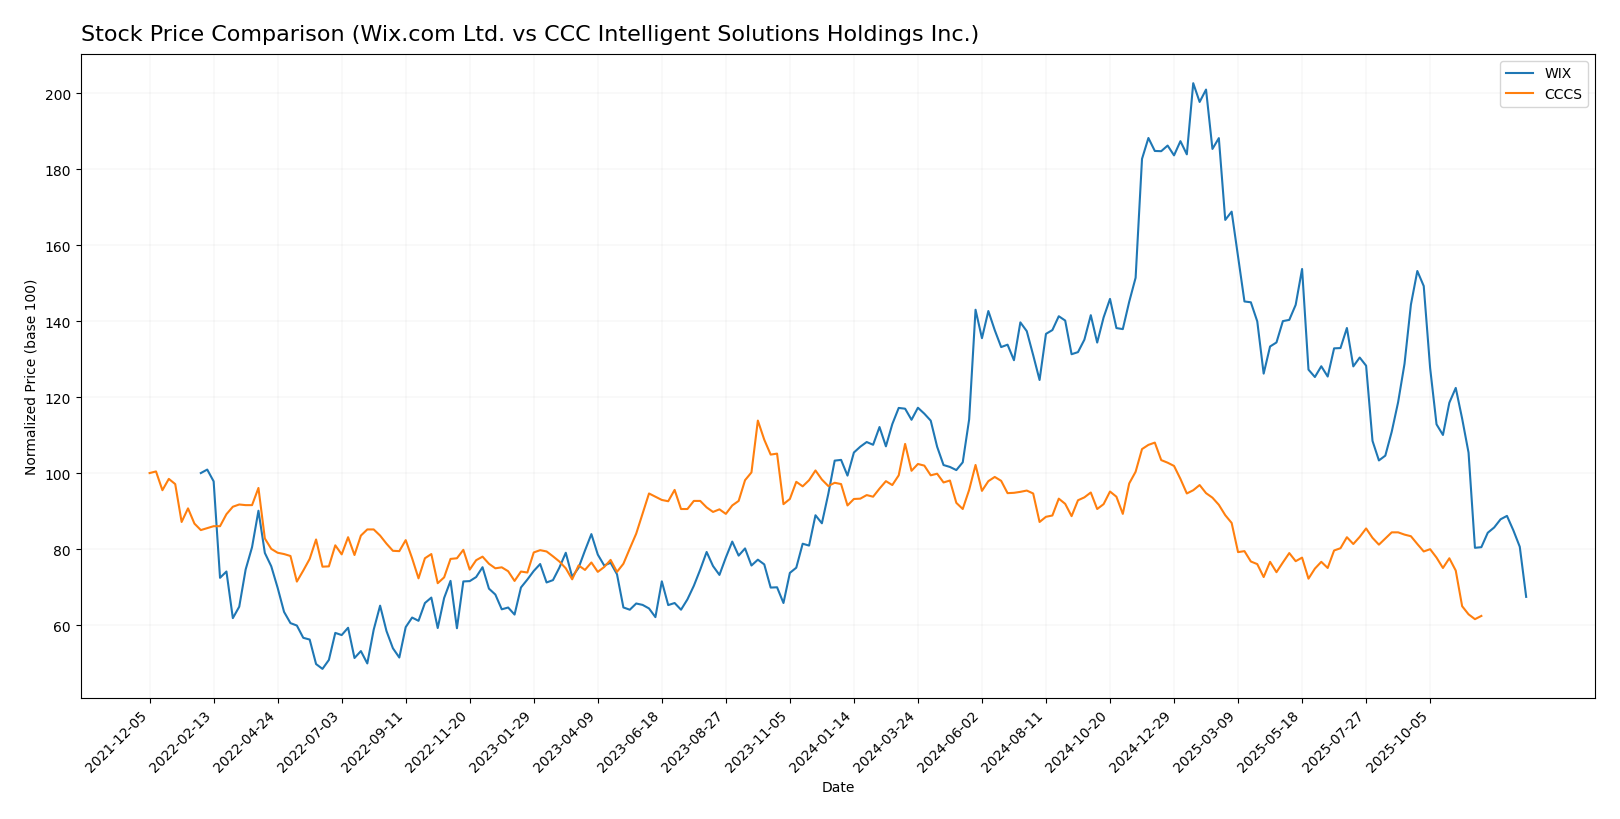
The stock price movements of Wix.com Ltd. (WIX) and CCC Intelligent Solutions Holdings Inc. (CCCS) over the past 12 months reveal significant bearish trends with marked declines and decelerating momentum, reflecting challenging trading dynamics for both companies.
Trend Analysis
Wix.com Ltd. (WIX) experienced a 40.28% price decline over the past year, indicating a bearish trend with decelerating downward momentum. Volatility was high with a standard deviation of 34.39, and prices ranged from 240.89 to 80.16.
CCC Intelligent Solutions Holdings Inc. (CCCS) also faced a bearish trend with a 31.78% decline over 12 months and decelerating negative momentum. Volatility was low at 1.24 standard deviation, with prices fluctuating between 12.67 and 7.22.
Comparing the two, WIX exhibited the larger percentage drop and greater volatility, delivering the weaker market performance relative to CCCS during the same period.
Target Prices
The current analyst consensus for target prices reveals a mixed outlook for Wix.com Ltd. and CCC Intelligent Solutions Holdings Inc.
| Company | Target High | Target Low | Consensus |
|---|---|---|---|
| Wix.com Ltd. | 210 | 70 | 160.27 |
| CCC Intelligent Solutions Holdings Inc. | 11 | 11 | 11 |
Analysts expect Wix.com Ltd.’s stock to have significant upside potential compared to its current price of $80.16, while CCC Intelligent Solutions Holdings Inc.’s target price is close to its current trading price of $8.75, indicating more limited growth expectations.
Analyst Opinions Comparison
This section compares analysts’ ratings and grades for Wix.com Ltd. and CCC Intelligent Solutions Holdings Inc.:
Rating Comparison
WIX Rating
- Rating: C, classified as Very Favorable by evaluators.
- Discounted Cash Flow Score: 3, indicating a Moderate valuation outlook.
- ROE Score: 1, considered Very Unfavorable due to low profitability from equity.
- ROA Score: 4, a Favorable score showing effective asset utilization.
- Debt To Equity Score: 1, Very Unfavorable, suggesting high financial risk.
- Overall Score: 2, Moderate rating reflecting mixed financial metrics.
CCCS Rating
- No rating information available for CCCS.
- No Discounted Cash Flow Score data provided.
- No Return on Equity Score available.
- No Return on Assets Score reported.
- No Debt To Equity Score data provided.
- No Overall Score information available.
Which one is the best rated?
Based on the available data, Wix.com Ltd. holds a Moderate overall score with detailed financial metric ratings, while CCC Intelligent Solutions has no analyst ratings or scores reported, making Wix the better rated by default.
Scores Comparison
Here is a comparison of the Altman Z-Score and Piotroski Score for Wix.com Ltd. and CCC Intelligent Solutions Holdings Inc.:
WIX Scores
- Altman Z-Score: 1.83, indicating moderate bankruptcy risk in the grey zone.
- Piotroski Score: 6, showing average financial strength.
CCCS Scores
- Altman Z-Score: 2.18, indicating moderate bankruptcy risk in the grey zone.
- Piotroski Score: 3, indicating very weak financial strength.
Which company has the best scores?
Based on the provided scores, CCCS has a slightly better Altman Z-Score, suggesting marginally lower bankruptcy risk. However, WIX has a significantly stronger Piotroski Score, indicating better overall financial health.
Grades Comparison
Here is the grades comparison for Wix.com Ltd. and CCC Intelligent Solutions Holdings Inc.:
Wix.com Ltd. Grades
The following table summarizes recent grades from reliable financial institutions for Wix.com Ltd.:
| Grading Company | Action | New Grade | Date |
|---|---|---|---|
| Morgan Stanley | Maintain | Overweight | 2026-01-15 |
| Wells Fargo | Maintain | Overweight | 2025-12-19 |
| Cantor Fitzgerald | Maintain | Overweight | 2025-12-11 |
| Wells Fargo | Maintain | Overweight | 2025-11-20 |
| Barclays | Maintain | Overweight | 2025-11-20 |
| Citizens | Maintain | Market Outperform | 2025-11-20 |
| Citigroup | Maintain | Buy | 2025-11-20 |
| Scotiabank | Maintain | Sector Outperform | 2025-11-20 |
| Needham | Maintain | Buy | 2025-11-20 |
| Evercore ISI Group | Maintain | Outperform | 2025-11-20 |
Overall, Wix.com Ltd. maintains a strong consensus of buy and outperform ratings with no downgrades reported recently.
No reliable grading data is available for CCC Intelligent Solutions Holdings Inc. The risk profile for CCC Intelligent Solutions can be gauged from other metrics, but no formal grades were provided.
Which company has the best grades?
Wix.com Ltd. clearly has better and more consistent grades, with multiple reputable firms issuing “Overweight,” “Buy,” and “Outperform” ratings. CCC Intelligent Solutions Holdings Inc. lacks comparable grade data, which may increase uncertainty for investors assessing its outlook.
Strengths and Weaknesses
Below is a comparison of key strengths and weaknesses for Wix.com Ltd. (WIX) and CCC Intelligent Solutions Holdings Inc. (CCCS) based on the latest available data.
| Criterion | Wix.com Ltd. (WIX) | CCC Intelligent Solutions Holdings Inc. (CCCS) |
|---|---|---|
| Diversification | Moderate, with two main segments: Creative Subscription (~$1.26B) and Business Solutions (~$496M) in 2024 | Moderate, focused on Software Subscriptions (~$906M) and Other Services (~$38M) in 2024 |
| Profitability | Slightly unfavorable overall; net margin 7.9%, ROIC 9.1% below WACC 9.35%; ROE negative at -175.6% | Data unavailable to assess profitability metrics |
| Innovation | Strong in platform development and creative tools, reflected by growing ROIC trend (+159%) despite current value destruction | Data unavailable; innovation level unclear |
| Global presence | Established global user base with scalable SaaS model | Data unavailable; likely more niche or regional presence |
| Market Share | Significant in website building and online business solutions, growing subscription revenues | Data unavailable; market share unclear |
Key takeaways: Wix shows a growing and innovative business with expanding revenue streams but struggles with current profitability and value creation. CCCS lacks sufficient public data for a comprehensive assessment, limiting confident investment decisions. I advise caution and recommend monitoring CCCS for future disclosure updates.
Risk Analysis
Below is a comparison of key risks for Wix.com Ltd. (WIX) and CCC Intelligent Solutions Holdings Inc. (CCCS) as of 2026.
| Metric | Wix.com Ltd. (WIX) | CCC Intelligent Solutions Holdings Inc. (CCCS) |
|---|---|---|
| Market Risk | High volatility, beta 1.42 | Moderate volatility, beta 0.72 |
| Debt level | High debt-to-assets at 50.7% | Data unavailable |
| Regulatory Risk | Moderate, tech sector regulations globally | Moderate, insurance tech sector regulations |
| Operational Risk | Medium, due to platform complexity | Medium, reliant on AI and cloud infrastructure |
| Environmental Risk | Low, minimal direct impact | Low, minimal direct impact |
| Geopolitical Risk | Elevated, headquartered in Israel with global operations | Moderate, US-based with global presence |
In synthesis, Wix faces the most impactful risks from its high market volatility and significant debt level, which affects financial stability. CCCS shows moderate market and geopolitical risks but lacks sufficient data on debt, making full assessment difficult. Investors should weigh Wix’s financial risk carefully given its unfavorable debt and profitability metrics.
Which Stock to Choose?
Wix.com Ltd. has shown strong income growth with a 78.86% revenue increase over 2020-2024 and favorable net margin growth, yet its financial ratios paint a mixed picture, including an unfavorable return on equity (-175.57%) and a slightly unfavorable overall ratio evaluation. The company’s debt level is moderate with a net debt to EBITDA of 1.66, but it is considered slightly unfavorable in value creation as ROIC remains below WACC despite improving profitability. Its rating is very favorable (C), though with some caution on valuation metrics.
CCC Intelligent Solutions Holdings Inc. has also displayed solid income growth, with a 49.24% revenue increase and favorable improvements in net margin and EPS over the same period. However, key financial ratios and comprehensive ratings data are unavailable, limiting a full assessment. Its debt metrics appear manageable with a net debt to EBITDA around 1.93, and income statement indicators are generally favorable, but score evaluations suggest weaker financial strength compared to Wix.
For investors prioritizing growth and profitability with detailed financial insights, Wix might appear more transparent despite some valuation and leverage concerns. Conversely, those seeking exposure to a company with solid income growth but less available financial data might find CCC Intelligent Solutions worth monitoring, especially given its moderate debt and favorable income statement trends. The choice could thus depend on an investor’s tolerance for data uncertainty and preference for financial clarity.
Disclaimer: Investment carries a risk of loss of initial capital. The past performance is not a reliable indicator of future results. Be sure to understand risks before making an investment decision.
Go Further
I encourage you to read the complete analyses of Wix.com Ltd. and CCC Intelligent Solutions Holdings Inc. to enhance your investment decisions: