In today’s fast-evolving technology landscape, UiPath Inc. and CCC Intelligent Solutions Holdings Inc. stand out as prominent players in the software infrastructure sector. Both companies leverage artificial intelligence and automation to transform complex workflows, though they serve distinct yet overlapping markets such as insurance, finance, and healthcare. This comparison aims to help you understand their innovation approaches and market positions, guiding you toward the most compelling investment opportunity. Let’s explore which company offers the best potential for your portfolio.
Table of contents
Companies Overview
I will begin the comparison between UiPath Inc. and CCC Intelligent Solutions Holdings Inc. by providing an overview of these two companies and their main differences.
UiPath Overview
UiPath Inc. provides an end-to-end automation platform with robotic process automation (RPA) solutions primarily in the US, Romania, and Japan. Its software suite combines AI with low-code development environments to enable users to build, manage, and deploy automation across enterprises. Founded in 2005 and headquartered in New York City, UiPath serves industries like banking, healthcare, and government, emphasizing compliance and performance tracking.
CCC Intelligent Solutions Overview
CCC Intelligent Solutions Holdings Inc. offers cloud, mobile, AI, telematics, and hyperscale technologies tailored for the property and casualty insurance economy. Its SaaS platform digitizes AI-enabled workflows and connects insurance carriers, repairers, and automotive manufacturers. Founded in 1980 and based in Chicago, CCC provides a broad range of insurance and repair solutions, supporting commerce and ecosystem management within the insurance sector.
Key similarities and differences
Both UiPath and CCC operate in the Software – Infrastructure industry in the US technology sector, leveraging AI to enhance business processes. UiPath focuses on automation across multiple industries with a robotic platform, while CCC targets the insurance ecosystem with specialized SaaS products. UiPath has a larger workforce and market cap, whereas CCC emphasizes cloud and telematics technologies specific to insurance workflows.
Income Statement Comparison
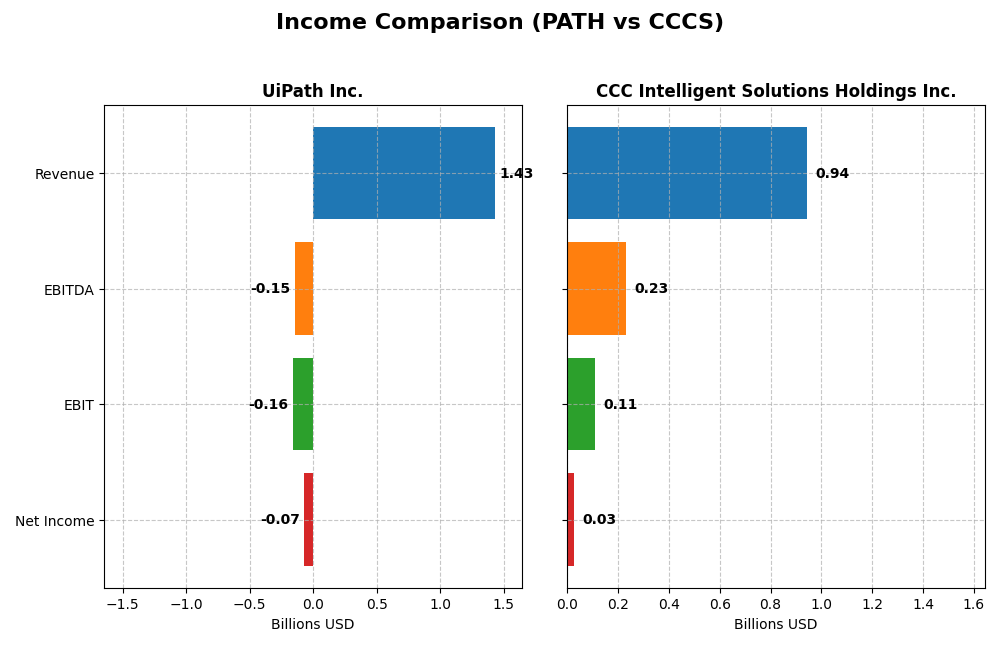
This table compares the latest fiscal year income statement metrics for UiPath Inc. and CCC Intelligent Solutions Holdings Inc., providing a snapshot of their financial performance in 2025 and 2024 respectively.
| Metric | UiPath Inc. (PATH) | CCC Intelligent Solutions Holdings Inc. (CCCS) |
|---|---|---|
| Market Cap | 7.7B | 5.6B |
| Revenue | 1.43B | 945M |
| EBITDA | -145M | 233M |
| EBIT | -163M | 109M |
| Net Income | -74M | 26M |
| EPS | -0.13 | 0.043 |
| Fiscal Year | 2025 | 2024 |
Income Statement Interpretations
UiPath Inc.
UiPath’s revenue rose significantly from 607M in 2021 to 1.43B in 2025, marking strong growth. Despite this, net income remained negative, though losses narrowed from -525M in 2022 to -74M in 2025, improving net margin to -5.15%. The gross margin remained robust at 82.73%, while EBIT marginally improved in 2025, indicating a gradual path to profitability.
CCC Intelligent Solutions Holdings Inc.
CCC showed steady revenue growth from 633M in 2020 to 945M in 2024. Net income rebounded from a loss of -249M in 2021 to a positive 26M in 2024, lifting net margin to 2.77%. EBIT margin improved markedly to 11.53% in 2024, supported by favorable operating expense control and a solid gross margin of 75.55%, highlighting operational leverage.
Which one has the stronger fundamentals?
Both companies exhibit favorable income statement trends, but CCC’s consistent positive EBIT and net income contrasts with UiPath’s ongoing losses despite revenue growth. UiPath’s higher gross margin signals pricing strength, yet its negative net margin and EBIT remain concerns. CCC’s improving profitability and margin expansion suggest comparatively stronger fundamentals based on recent financials.
Financial Ratios Comparison
The table below presents a side-by-side comparison of key financial ratios for UiPath Inc. (PATH) and CCC Intelligent Solutions Holdings Inc. (CCCS) based on their most recent fiscal year data.
| Ratios | UiPath Inc. (PATH) FY 2025 | CCC Intelligent Solutions (CCCS) FY 2024 |
|---|---|---|
| ROE | -3.99% | 1.31% |
| ROIC | -7.41% | 1.86% |
| P/E | -108.0 | 274.0 |
| P/B | 4.31 | 3.59 |
| Current Ratio | 2.93 | 3.65 |
| Quick Ratio | 2.93 | 3.65 |
| D/E (Debt-to-Equity) | 0.04 | 0.42 |
| Debt-to-Assets | 2.72% | 26.65% |
| Interest Coverage | 0 | 1.24 |
| Asset Turnover | 0.50 | 0.30 |
| Fixed Asset Turnover | 14.41 | 4.68 |
| Payout Ratio | 0 | 0 |
| Dividend Yield | 0 | 0 |
Interpretation of the Ratios
UiPath Inc.
UiPath shows mixed financial ratios with several unfavorable metrics such as negative net margin (-5.15%), negative return on equity (-3.99%), and return on invested capital (-7.41%). However, liquidity ratios like current and quick ratio at 2.93 are favorable, indicating good short-term financial health. The company does not pay dividends, likely reflecting reinvestment in growth and development, with no distribution risks.
CCC Intelligent Solutions Holdings Inc.
There is insufficient data available to evaluate the financial ratios for CCC Intelligent Solutions Holdings Inc. No key metrics or ratio evaluations have been provided, which limits any assessment of its financial strength, profitability, liquidity, or shareholder return policies at this time.
Which one has the best ratios?
Based on the available data, UiPath Inc. exhibits a slightly unfavorable overall ratio profile with a balance of favorable liquidity and asset turnover against weak profitability and coverage metrics. CCC Intelligent Solutions Holdings Inc. cannot be compared due to missing ratio information, making UiPath the only company with an evaluable financial ratio set.
Strategic Positioning
This section compares the strategic positioning of UiPath Inc. and CCC Intelligent Solutions Holdings Inc., focusing on market position, key segments, and exposure to technological disruption:
UiPath Inc.
- Leading software infrastructure player with $7.7B market cap and moderate competitive pressure.
- Key segments include RPA licenses, subscription services, and professional services driving growth.
- Combines AI with automation tools; platform integrates low-code and analytics, addressing digital transformation.
CCC Intelligent Solutions Holdings Inc.
- Mid-sized software infrastructure firm with $5.6B market cap, facing competitive pressure in insurance tech.
- Focused on SaaS subscriptions and services for the property and casualty insurance ecosystem.
- Provides AI, cloud, mobile, and telematics solutions; heavily invested in AI-enabled insurance workflows.
UiPath Inc. vs CCC Intelligent Solutions Holdings Inc. Positioning
UiPath maintains a diversified automation platform serving multiple industries with varied revenue streams. CCC concentrates on insurance technology with a SaaS-centric model. UiPath’s broader market exposure contrasts with CCC’s specialized ecosystem focus.
Which has the best competitive advantage?
UiPath shows a slightly unfavorable moat due to value destruction but an improving ROIC trend, indicating growing profitability. CCC’s moat data is unavailable, preventing comparative moat advantage assessment.
Stock Comparison
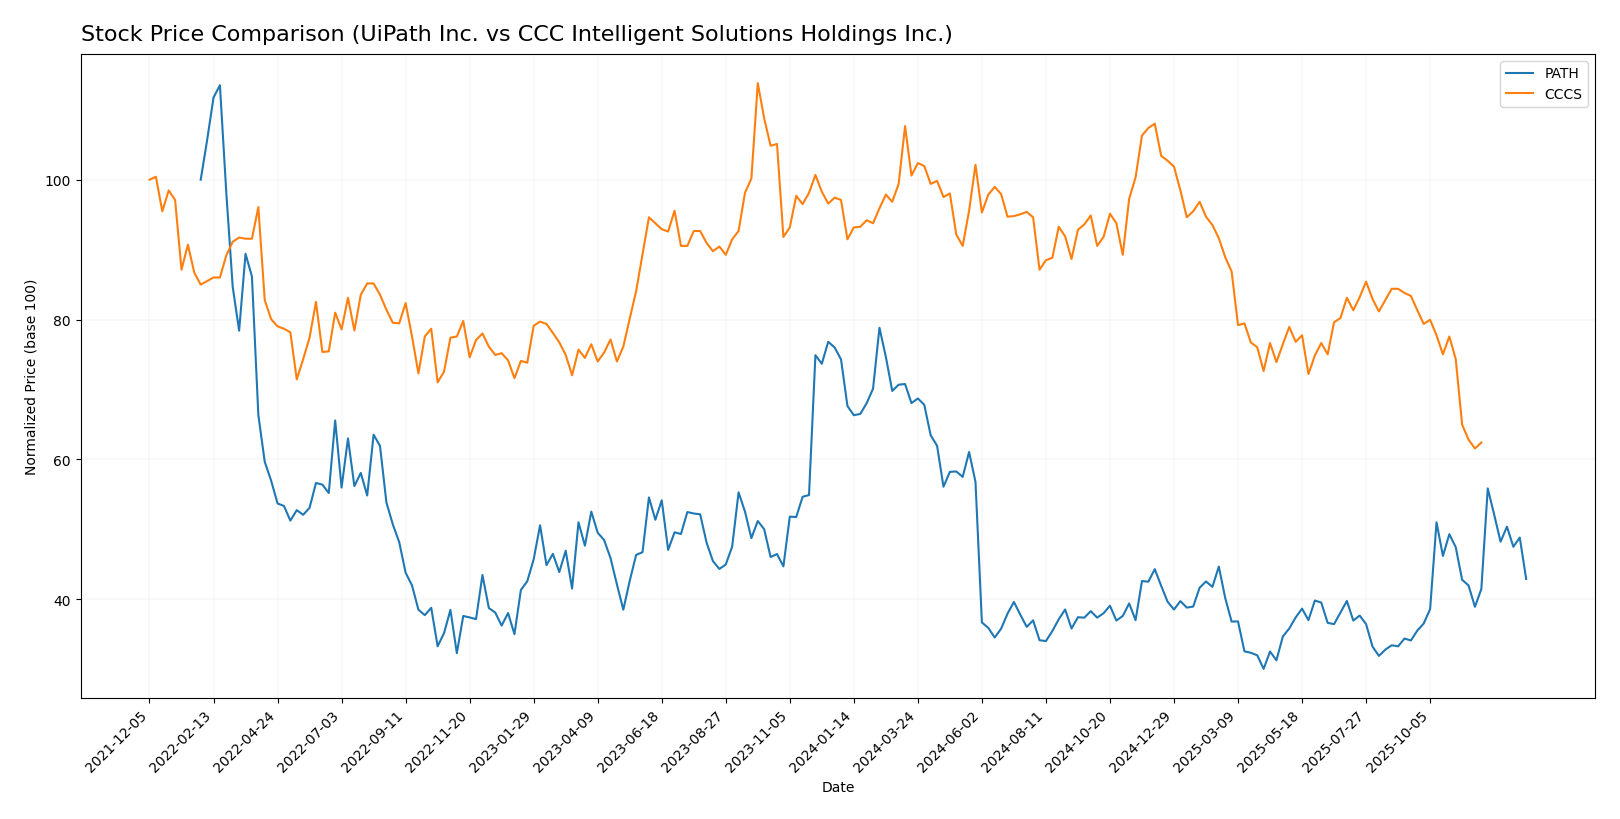
The stock price charts highlight significant bearish trends for both UiPath Inc. and CCC Intelligent Solutions Holdings Inc. over the past 12 months, with notable declines and varying volatility profiles.
Trend Analysis
UiPath Inc. (PATH) experienced a bearish trend over the past year with a price decline of -38.53%, marked by accelerating downward momentum and a high volatility level (std deviation 3.33). The stock’s price ranged between 10.04 and 23.66.
CCC Intelligent Solutions Holdings Inc. (CCCS) also showed a bearish trend over the same 12-month period, with a -31.78% price change, but with decelerating loss and lower volatility (std deviation 1.24). The price fluctuated between 7.22 and 12.67.
Comparing both, PATH delivered the largest negative market performance with a steeper decline and higher volatility than CCCS, indicating greater downside risk during the analyzed period.
Target Prices
Analysts present a clear target price consensus for UiPath Inc. and CCC Intelligent Solutions Holdings Inc.
| Company | Target High | Target Low | Consensus |
|---|---|---|---|
| UiPath Inc. | 19 | 14 | 16.6 |
| CCC Intelligent Solutions Holdings Inc. | 11 | 11 | 11 |
The consensus target prices for both companies suggest moderate upside potential compared to their current prices: UiPath’s consensus of 16.6 is above its 14.34 stock price, while CCC’s 11 target significantly exceeds its 8.75 price, indicating optimistic analyst expectations.
Analyst Opinions Comparison
This section compares analysts’ ratings and grades for UiPath Inc. and CCC Intelligent Solutions Holdings Inc.:
Rating Comparison
UiPath Inc. Rating
- Rating: B+, considered Very Favorable by analysts.
- Discounted Cash Flow Score: 3, indicating moderate valuation.
- ROE Score: 4, reflecting favorable profitability from equity.
- ROA Score: 4, showing favorable asset utilization.
- Debt To Equity Score: 4, indicating favorable financial stability.
- Overall Score: 3, assessed as moderate overall financial health.
CCC Intelligent Solutions Holdings Inc. Rating
- No rating data available.
- No data provided.
- No data provided.
- No data provided.
- No data provided.
- No data provided.
Which one is the best rated?
Based strictly on the available data, UiPath Inc. is better rated with a B+ overall rating and favorable scores in profitability and financial stability. No rating information is provided for CCC Intelligent Solutions Holdings Inc.
Scores Comparison
Here is the comparison of the Altman Z-Score and Piotroski Score for UiPath Inc. and CCC Intelligent Solutions Holdings Inc.:
UiPath Inc. Scores
- Altman Z-Score: 5.27, indicating a safe zone with low bankruptcy risk.
- Piotroski Score: 7, classified as strong financial health.
CCC Intelligent Solutions Scores
- Altman Z-Score: 2.18, placing it in the grey zone with moderate risk.
- Piotroski Score: 3, considered very weak financial health.
Which company has the best scores?
UiPath Inc. shows stronger scores with a safe zone Altman Z-Score and a strong Piotroski Score of 7. CCC Intelligent Solutions is in the grey zone with a very weak Piotroski Score of 3.
Grades Comparison
The following presents a comparison of the available grades for UiPath Inc. and CCC Intelligent Solutions Holdings Inc.:
UiPath Inc. Grades
This table summarizes recent grades assigned to UiPath Inc. by reputable financial institutions.
| Grading Company | Action | New Grade | Date |
|---|---|---|---|
| Barclays | Maintain | Equal Weight | 2026-01-12 |
| RBC Capital | Maintain | Sector Perform | 2026-01-05 |
| RBC Capital | Maintain | Sector Perform | 2025-12-10 |
| Morgan Stanley | Maintain | Equal Weight | 2025-12-09 |
| DA Davidson | Maintain | Neutral | 2025-12-05 |
| Canaccord Genuity | Maintain | Buy | 2025-12-04 |
| Mizuho | Maintain | Neutral | 2025-12-04 |
| RBC Capital | Maintain | Sector Perform | 2025-12-04 |
| Wells Fargo | Maintain | Equal Weight | 2025-12-04 |
| Evercore ISI Group | Maintain | In Line | 2025-12-04 |
UiPath’s grades predominantly cluster around “Equal Weight,” “Sector Perform,” and “Neutral,” with a single “Buy” rating, indicating a consensus leaning modestly toward holding the stock.
CCC Intelligent Solutions Holdings Inc. Grades
No reliable grades were provided for CCC Intelligent Solutions Holdings Inc. by verifiable grading companies.
The available grades for UiPath indicate a general consensus of caution or neutrality, while the absence of reliable grades for CCC Intelligent Solutions suggests limited analyst coverage or public rating information.
Which company has the best grades?
Comparing both companies, UiPath Inc. has received more analyst coverage with mostly neutral to hold ratings, whereas CCC Intelligent Solutions lacks verifiable grades. Investors may interpret the broader analyst input on UiPath as a more established consensus, which can affect perceived risk and valuation clarity.
Strengths and Weaknesses
Below is a comparative overview of key strengths and weaknesses for UiPath Inc. (PATH) and CCC Intelligent Solutions Holdings Inc. (CCCS) based on the latest available data.
| Criterion | UiPath Inc. (PATH) | CCC Intelligent Solutions (CCCS) |
|---|---|---|
| Diversification | Moderate: Revenue split among License (587M), Subscription Services (802M), and Professional Services (71M) in 2025 | Moderate: Primarily Software Subscriptions (906M) with smaller Other Services (38M) in 2024 |
| Profitability | Weak: Negative net margin (-5.15%), ROIC (-7.41%), ROE (-3.99%) in 2025; company currently shedding value | Data unavailable for profitability evaluation |
| Innovation | Growing ROIC trend (+65%), indicating improving operational efficiency and innovation impact | Data unavailable for innovation metrics |
| Global presence | Strong global SaaS footprint, supported by diversified revenue streams across services and licenses | Likely strong SaaS presence given subscription dominance; specifics unavailable |
| Market Share | Significant in RPA (Robotic Process Automation) niche with consistent revenue growth in Subscription Services | Leading position in software subscription market for insurance claims and services; exact market share unknown |
Key takeaways: UiPath shows improving operational efficiency despite current profitability challenges, supported by diversified revenue streams and a strong global presence in automation software. CCCS’s revenue profile emphasizes growth in software subscriptions, but lack of financial data limits assessment of profitability and competitive moat. Investors should weigh UiPath’s growth potential against its current value destruction, while seeking more data on CCCS for confident evaluation.
Risk Analysis
The table below summarizes key risk factors for UiPath Inc. (PATH) and CCC Intelligent Solutions Holdings Inc. (CCCS) based on the most recent data available in 2026.
| Metric | UiPath Inc. (PATH) | CCC Intelligent Solutions Holdings Inc. (CCCS) |
|---|---|---|
| Market Risk | Moderate (Beta 1.08 indicates average market volatility exposure) | Lower (Beta 0.72 suggests less sensitivity to market swings) |
| Debt Level | Low (Debt to Equity 0.04, Debt to Assets 2.72%) | Unknown (No recent data available) |
| Regulatory Risk | Moderate (Technology sector, subject to data privacy and AI regulations) | Moderate (Insurance tech sector, regulatory scrutiny on data and claims) |
| Operational Risk | Moderate (Relies on AI and RPA platform stability; recent net margin negative at -5.15%) | Unknown (No recent operational metrics available) |
| Environmental Risk | Low (Software company with minimal direct environmental impact) | Low (Primarily SaaS solutions, limited environmental footprint) |
| Geopolitical Risk | Moderate (Global operations including US, Romania, Japan; potential cross-border regulatory challenges) | Moderate (US-based but serving global insurance economy, exposed to geopolitical shifts) |
UiPath faces moderate market and operational risks due to its negative profitability and reliance on AI automation platforms, but benefits from low debt and strong liquidity. CCCS shows less market volatility but lacks sufficient financial data; its exposure to regulatory and geopolitical risks is moderate given its industry and international scope. The most impactful risks currently are UiPath’s operational losses and regulatory environment changes affecting AI and data usage.
Which Stock to Choose?
UiPath Inc. shows a favorable income evolution with strong revenue growth of 135% over five years and improving profitability despite continuing negative margins. Financial ratios are mixed: low debt and high liquidity contrast with unfavorable returns on equity and capital. Its B+ rating is very favorable, supported by solid Altman Z-Score and Piotroski scores, though the company is still shedding value overall.
CCC Intelligent Solutions Holdings Inc. presents a favorable income statement with positive EBIT and steady net margin near 3%. However, key financial ratios and detailed metrics are unavailable, limiting comprehensive evaluation. Its Altman Z-Score places it in a grey zone, and the Piotroski score is very weak, indicating financial fragility despite positive income trends.
For investors prioritizing growth and improving profitability, UiPath’s strong income growth and solid rating might appear more attractive. Conversely, those seeking companies with positive margins but facing uncertainty in financial stability could view CCC Intelligent Solutions differently. Ultimately, the choice might depend on the investor’s risk tolerance and strategy focus.
Disclaimer: Investment carries a risk of loss of initial capital. The past performance is not a reliable indicator of future results. Be sure to understand risks before making an investment decision.
Go Further
I encourage you to read the complete analyses of UiPath Inc. and CCC Intelligent Solutions Holdings Inc. to enhance your investment decisions: