In today’s fast-evolving technology landscape, CCC Intelligent Solutions Holdings Inc. (CCCS) and StoneCo Ltd. (STNE) stand out for their innovative software infrastructure offerings. CCCS specializes in AI-driven solutions for the insurance economy, while STNE focuses on fintech services enabling electronic commerce in Brazil. Despite operating in distinct niches, both companies leverage technology to transform traditional industries. In this article, I will help you uncover which company presents a more compelling investment opportunity in 2026.
Table of contents
Companies Overview
I will begin the comparison between CCC Intelligent Solutions Holdings Inc. and StoneCo Ltd. by providing an overview of these two companies and their main differences.
CCC Intelligent Solutions Holdings Inc. Overview
CCC Intelligent Solutions Holdings Inc. specializes in cloud, mobile, AI, telematics, and hyperscale technologies tailored for the property and casualty insurance economy. Its SaaS platform digitizes critical AI-enabled workflows, connecting insurance carriers, collision repairers, parts suppliers, and automotive manufacturers. With a market cap of 5.6B USD and headquartered in Chicago, CCC focuses on software infrastructure solutions that streamline insurance-related commerce.
StoneCo Ltd. Overview
StoneCo Ltd. delivers financial technology solutions for merchants and integrated partners in Brazil, supporting electronic commerce in-store, online, and via mobile. The company operates through Stone Hubs and direct sales teams, serving roughly 1.77M clients, mainly small and medium businesses. With a market cap of 3.9B USD, StoneCo is based in George Town, Cayman Islands, and emphasizes fintech infrastructure for diverse commerce channels.
Key similarities and differences
Both companies operate in the software infrastructure industry but target distinct markets and sectors. CCC focuses on AI-driven solutions for the insurance ecosystem, while StoneCo provides fintech services for commerce in Brazil. CCC has a lower beta at 0.72, indicating less volatility than StoneCo’s 1.84. Additionally, StoneCo employs over 7K staff, significantly more than CCC’s 2.3K, reflecting their operational scale differences.
Income Statement Comparison
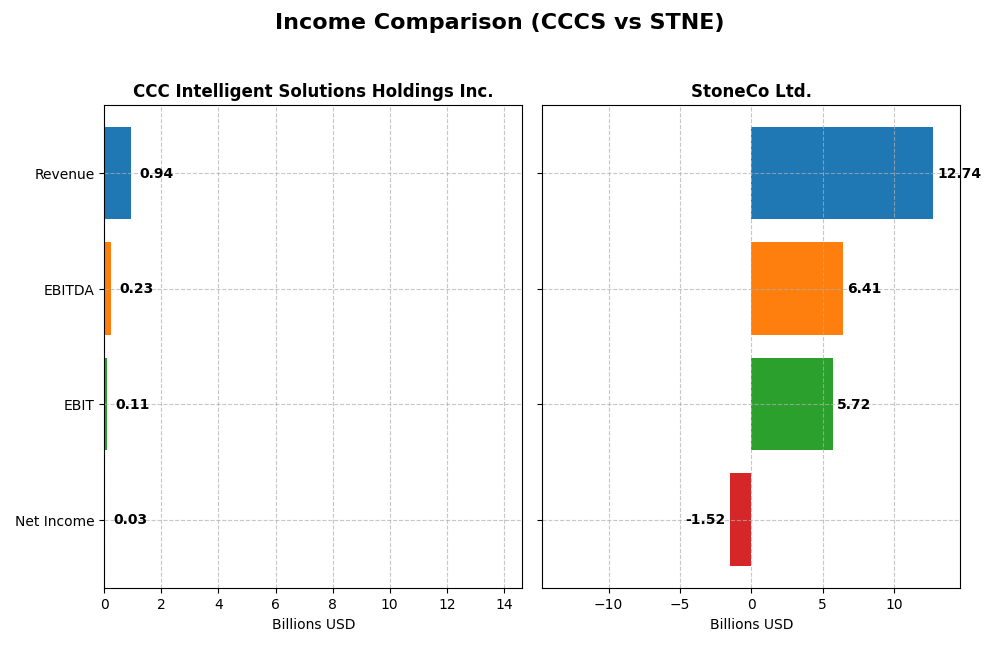
The table below compares the key income statement metrics for CCC Intelligent Solutions Holdings Inc. and StoneCo Ltd. for the fiscal year 2024.
| Metric | CCC Intelligent Solutions Holdings Inc. (CCCS) | StoneCo Ltd. (STNE) |
|---|---|---|
| Market Cap | 5.63B USD | 3.88B USD |
| Revenue | 945M USD | 12.74B BRL |
| EBITDA | 233M USD | 6.41B BRL |
| EBIT | 109M USD | 5.72B BRL |
| Net Income | 26.1M USD | -1.52B BRL |
| EPS | 0.0428 USD | -5.02 BRL |
| Fiscal Year | 2024 | 2024 |
Income Statement Interpretations
CCC Intelligent Solutions Holdings Inc.
From 2020 to 2024, CCC Intelligent Solutions demonstrated consistent revenue growth, rising from $633M to $945M, reflecting a 49.24% increase over the period. Net income turned positive in 2022 after earlier losses, reaching $26.1M in 2024. Margins improved notably, with a gross margin of 75.55% and an EBIT margin of 11.53% in 2024, signaling enhanced operational efficiency and a significant EBIT growth of over 600% in the last year.
StoneCo Ltd.
StoneCo’s revenue grew substantially from BRL 3.17B in 2020 to BRL 12.74B in 2024, a 302.29% increase. However, net income declined sharply, turning negative since 2022 and reaching a loss of BRL 1.52B in 2024. Despite a stable gross margin around 73.4% and a strong EBIT margin of 44.86% in 2024, StoneCo’s net margin remains negative at -11.89%, reflecting challenges in translating revenue growth into profitability.
Which one has the stronger fundamentals?
CCC Intelligent Solutions exhibits stronger fundamentals with favorable revenue and net income growth, improving margins, and positive returns in recent years. StoneCo, while achieving significant revenue expansion and maintaining solid gross and EBIT margins, struggles with sustained net losses and unfavorable net margin trends. Thus, CCC shows more consistent profitability and margin improvements over the period.
Financial Ratios Comparison
Below is a comparative overview of key financial ratios for CCC Intelligent Solutions Holdings Inc. (CCCS) and StoneCo Ltd. (STNE) based on their most recent fiscal year data.
| Ratios | CCC Intelligent Solutions Holdings Inc. (CCCS) | StoneCo Ltd. (STNE) |
|---|---|---|
| ROE | 1.31% | -12.87% |
| ROIC | 1.86% | 22.41% |
| P/E | 274.02 | -9.84 |
| P/B | 3.59 | 1.27 |
| Current Ratio | 3.65 | 1.37 |
| Quick Ratio | 3.65 | 1.37 |
| D/E (Debt-to-Equity) | 0.42 | 1.10 |
| Debt-to-Assets | 26.65% | 23.53% |
| Interest Coverage | 1.24 | 5.57 |
| Asset Turnover | 0.30 | 0.23 |
| Fixed Asset Turnover | 4.68 | 6.95 |
| Payout Ratio | 0 | 0 |
| Dividend Yield | 0% | 0% |
Interpretation of the Ratios
CCC Intelligent Solutions Holdings Inc.
CCC Intelligent Solutions shows mixed financial health with a strong current ratio around 3.65 in 2024, indicating good short-term liquidity, but weaker profitability metrics such as a low return on equity near 1.3% and a net debt to EBITDA ratio of about 1.93. The company does not pay dividends, likely focusing on reinvestment and growth strategies instead of shareholder payouts.
StoneCo Ltd.
StoneCo’s ratios are slightly favorable with a 22.4% return on invested capital and a manageable debt to assets ratio of 23.5%. Challenges include a negative net margin of -11.9% and return on equity at -12.9%, reflecting profitability concerns. StoneCo does not pay dividends, possibly prioritizing reinvestment and operational expansion in its fintech business.
Which one has the best ratios?
StoneCo has a slight edge with half of its ratios rated favorable, including strong returns on capital and good liquidity, despite profitability weaknesses. CCC Intelligent Solutions has solid liquidity but struggles more with profitability and cash flow, making StoneCo’s overall ratio profile comparatively better based on the available data.
Strategic Positioning
This section compares the strategic positioning of CCC Intelligent Solutions Holdings Inc. (CCCS) and StoneCo Ltd. (STNE), focusing on market position, key segments, and exposure to technological disruption:
CCCS
- Leading in property and casualty insurance tech with moderate competitive pressure.
- Key segments include AI-driven SaaS for insurance workflows and repair ecosystem.
- Utilizes cloud, AI, telematics technologies; disruption risk tied to evolving fintech.
STNE
- Focused on Brazilian fintech for merchants, facing high competition and market volatility.
- Core business driven by electronic commerce solutions for SMBs and integrated partners.
- Fintech innovation critical; disruption risk linked to fast-changing payment and commerce tech.
CCCS vs STNE Positioning
CCCS has a concentrated focus on insurance-related SaaS solutions, leveraging AI and telematics, while STNE adopts a more diversified fintech approach serving multiple merchant channels in Brazil. CCCS benefits from deep industry specialization; STNE emphasizes broad client reach but faces higher competitive pressure.
Which has the best competitive advantage?
Based on MOAT evaluation, STNE demonstrates a very favorable competitive advantage with growing ROIC significantly exceeding WACC, indicating durable profitability and efficient capital use. CCCS lacks sufficient data for MOAT assessment.
Stock Comparison
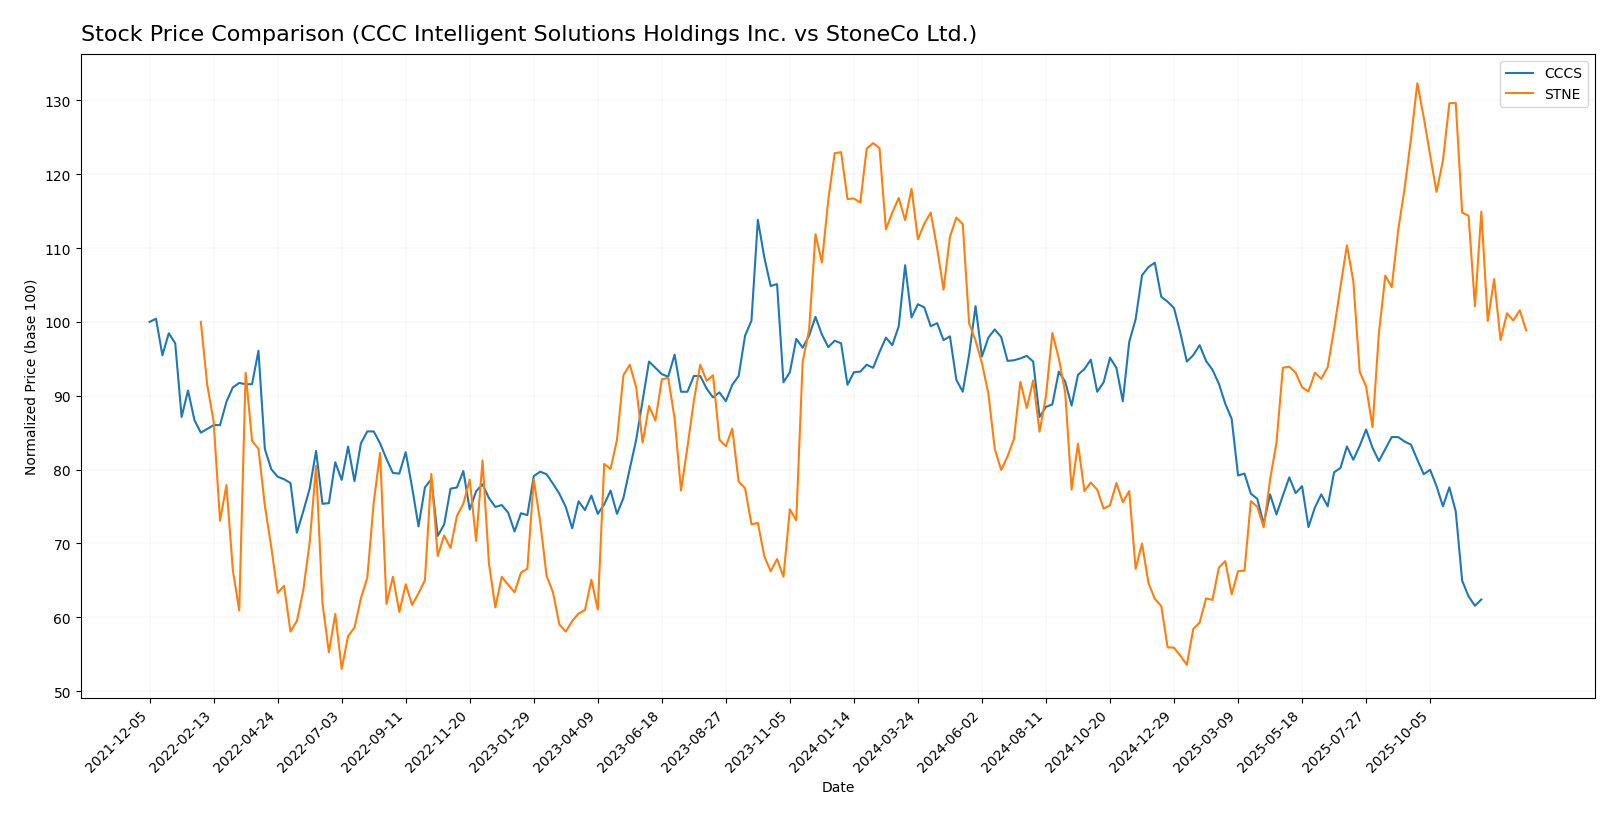
The stock price chart highlights significant declines for both CCC Intelligent Solutions Holdings Inc. and StoneCo Ltd. over the past year, with persistent bearish trends and decelerating momentum in their trading patterns.
Trend Analysis
CCC Intelligent Solutions Holdings Inc. recorded a 31.78% price decline over the past 12 months, indicating a bearish trend with deceleration. The stock ranged between 12.67 and 7.22, showing reduced volatility at 1.24 std deviation.
StoneCo Ltd. experienced a 13.9% price drop over the same period, also bearish with deceleration. Its price fluctuated between 19.4 and 7.85, exhibiting higher volatility at 2.92 std deviation.
Comparing the two, CCC Intelligent Solutions Holdings Inc. faced a steeper decline, underperforming StoneCo Ltd., which delivered the relatively better market performance over the past year.
Target Prices
The current analyst consensus presents clear target prices for both CCC Intelligent Solutions Holdings Inc. and StoneCo Ltd.
| Company | Target High | Target Low | Consensus |
|---|---|---|---|
| CCC Intelligent Solutions Holdings Inc. | 11 | 11 | 11 |
| StoneCo Ltd. | 20 | 20 | 20 |
Analysts expect CCC Intelligent Solutions to reach $11, above its current $8.75 price, signaling moderate upside potential. StoneCo’s consensus target of $20 also indicates significant growth compared to its current $14.49 price.
Analyst Opinions Comparison
This section compares analysts’ ratings and grades for CCC Intelligent Solutions Holdings Inc. (CCCS) and StoneCo Ltd. (STNE):
Rating Comparison
CCCS Rating
- No rating data available for CCC Intelligent Solutions.
- No Discounted Cash Flow Score available for CCC Intelligent.
- No Return on Equity Score available for CCC Intelligent.
- No Return on Assets Score available for CCC Intelligent.
- No Debt To Equity Score available for CCC Intelligent.
- No Overall Score available for CCC Intelligent.
STNE Rating
- Rated C with a “Very Favorable” status.
- Discounted Cash Flow Score is 3, considered Moderate.
- Return on Equity Score is 1, classified as Very Unfavorable.
- Return on Assets Score is 1, classified as Very Unfavorable.
- Debt To Equity Score is 1, classified as Very Unfavorable.
- Overall Score is 2, considered Moderate.
Which one is the best rated?
Based solely on the provided data, STNE has a defined rating and scores, while CCC Intelligent Solutions has no available ratings or scores. STNE is rated C with a Very Favorable status despite several unfavorable financial scores.
Scores Comparison
The comparison of Altman Z-Score and Piotroski Score for CCC Intelligent Solutions and StoneCo Ltd. is as follows:
CCC Intelligent Solutions Scores
- Altman Z-Score: 2.18, in the grey zone indicating moderate bankruptcy risk.
- Piotroski Score: 3, classified as very weak financial strength.
StoneCo Ltd. Scores
- Altman Z-Score: 1.02, in the distress zone indicating high bankruptcy risk.
- Piotroski Score: 5, classified as average financial strength.
Which company has the best scores?
Based strictly on the provided data, CCC Intelligent Solutions has a better Altman Z-Score, indicating lower bankruptcy risk, but a weaker Piotroski Score compared to StoneCo. StoneCo shows higher financial strength per Piotroski but faces higher bankruptcy risk.
Grades Comparison
Here is the comparison of the latest reliable grades for CCC Intelligent Solutions Holdings Inc. and StoneCo Ltd.:
CCC Intelligent Solutions Holdings Inc. Grades
The table below shows the consensus grade distribution for CCC Intelligent Solutions Holdings Inc.:
| Grading Company | Action | New Grade | Date |
|---|---|---|---|
| Consensus | Buy | Buy | 2026 |
Overall, CCC Intelligent Solutions Holdings Inc. has a consensus rating of “Buy” based on 6 buy, 3 hold, and 1 sell recommendations, indicating moderate positive sentiment.
StoneCo Ltd. Grades
The following table presents recent grade updates from well-known financial institutions for StoneCo Ltd.:
| Grading Company | Action | New Grade | Date |
|---|---|---|---|
| Goldman Sachs | Maintain | Buy | 2025-10-14 |
| B of A Securities | Maintain | Buy | 2025-09-09 |
| UBS | Maintain | Buy | 2025-08-29 |
| JP Morgan | Maintain | Overweight | 2025-07-16 |
| Barclays | Maintain | Equal Weight | 2025-05-12 |
| Barclays | Maintain | Equal Weight | 2025-04-23 |
| Citigroup | Upgrade | Buy | 2025-04-22 |
| Barclays | Maintain | Equal Weight | 2025-03-21 |
| Morgan Stanley | Maintain | Underweight | 2025-03-21 |
| Goldman Sachs | Maintain | Buy | 2025-02-06 |
StoneCo Ltd. shows a generally positive trend with multiple buy and overweight ratings, though some equal weight and underweight ratings indicate mixed analyst views.
Which company has the best grades?
StoneCo Ltd. has received more frequent and varied analyst coverage with predominantly buy and overweight grades, whereas CCC Intelligent Solutions Holdings Inc. presents a simpler consensus of buy. This suggests StoneCo’s grades reflect broader analyst engagement, potentially impacting investor perception of risk and opportunity differently.
Strengths and Weaknesses
Below is a comparison of key strengths and weaknesses for CCC Intelligent Solutions Holdings Inc. (CCCS) and StoneCo Ltd. (STNE) based on the most recent available data.
| Criterion | CCC Intelligent Solutions Holdings Inc. (CCCS) | StoneCo Ltd. (STNE) |
|---|---|---|
| Diversification | Revenue mainly from Software Subscriptions (~$906M in 2024), limited product diversification | Focused on financial tech services, less product diversity evident |
| Profitability | Data unavailable for recent profitability ratios | ROIC strong at 22.4% (favorable), but negative net margin (-11.9%) and negative ROE (-12.9%) indicate current losses |
| Innovation | Strong software subscription growth indicates innovation in SaaS | Demonstrates durable competitive advantage with growing ROIC, signaling innovation in business model |
| Global presence | Primarily US-based, limited global footprint | Operates mainly in Brazil, regional presence with growth potential |
| Market Share | No explicit data, but leading in auto software solutions | Significant market share in Brazilian fintech, competitive positioning evolving |
Key takeaways: CCCS shows robust growth in software subscriptions, reflecting a strong position in its niche but lacks diversification data. STNE exhibits a durable competitive advantage with excellent capital returns despite current profitability challenges, indicating a high-risk, high-potential profile. Investors should weigh CCCS’s stability against STNE’s growth prospects carefully.
Risk Analysis
Below is a risk comparison table for CCC Intelligent Solutions Holdings Inc. (CCCS) and StoneCo Ltd. (STNE) based on the most recent data available in 2026:
| Metric | CCC Intelligent Solutions Holdings Inc. (CCCS) | StoneCo Ltd. (STNE) |
|---|---|---|
| Market Risk | Moderate (Beta 0.72, lower volatility) | High (Beta 1.84, higher volatility) |
| Debt level | Data unavailable | Elevated (Debt/Equity 1.1, unfavorable) |
| Regulatory Risk | Moderate (US tech sector regulation) | High (Brazil fintech regulatory environment) |
| Operational Risk | Moderate (cloud & AI platform dependencies) | Moderate (complex fintech operations) |
| Environmental Risk | Low (software industry, minimal direct impact) | Low (primarily digital services) |
| Geopolitical Risk | Low (US headquartered) | High (Brazil and Cayman Islands exposure) |
CCCS benefits from lower market volatility and limited debt data, but its financial scores suggest caution. STNE faces high market and regulatory risks with a distressed Altman Z-score (1.02) indicating financial distress and an unfavorable debt profile, reflecting significant risk. Investors should weigh STNE’s operational scale against its financial vulnerabilities, while CCCS requires further data for a complete risk assessment.
Which Stock to Choose?
CCC Intelligent Solutions Holdings Inc. (CCCS) shows a favorable income evolution with strong revenue and net income growth of 49.24% and 254.92% respectively over 2020-2024. Financial ratios are missing, but profitability metrics reveal a positive trend, moderate debt levels, and a neutral interest burden. The company’s Altman Z-Score places it in the grey zone, while its Piotroski Score is very weak, indicating financial vulnerability despite income improvements.
StoneCo Ltd. (STNE) presents a mixed picture with favorable revenue growth of 302.29% but unfavorable net income decline of -277.41% over the period. Its financial ratios are slightly favorable overall, supported by a very favorable moat due to a strong and growing ROIC exceeding WACC. However, profitability ratios such as net margin and ROE are unfavorable, and debt-related scores signal caution. The Altman Z-Score is in the distress zone, though the Piotroski Score is average.
For investors prioritizing income statement strength and growth momentum, CCCS might appear more favorable given its improving profitability and income metrics. Conversely, those focused on durable competitive advantages and efficient capital use could find STNE’s very favorable moat and moderate financial ratios suggestive of long-term value creation, despite current profitability and financial distress concerns.
Disclaimer: Investment carries a risk of loss of initial capital. The past performance is not a reliable indicator of future results. Be sure to understand risks before making an investment decision.
Go Further
I encourage you to read the complete analyses of CCC Intelligent Solutions Holdings Inc. and StoneCo Ltd. to enhance your investment decisions: