In the dynamic technology sector, Palo Alto Networks, Inc. (PANW) and CCC Intelligent Solutions Holdings Inc. (CCCS) stand out as innovative players in software infrastructure. While PANW specializes in cybersecurity solutions, CCCS focuses on AI-driven cloud platforms for the insurance economy. Their distinct yet overlapping tech-driven strategies make them compelling candidates for investment. Join me as I analyze these companies to identify the most promising opportunity for your portfolio.

Table of contents
Companies Overview
I will begin the comparison between Palo Alto Networks and CCC Intelligent Solutions by providing an overview of these two companies and their main differences.
Palo Alto Networks Overview
Palo Alto Networks, Inc. is a leading cybersecurity company that delivers a broad range of products and services worldwide. Its offerings include firewall appliances, security management solutions, cloud security, threat intelligence, and professional services. The company primarily serves medium to large enterprises, service providers, and government entities across various industries. Founded in 2005, it is headquartered in Santa Clara, California, and has a market capitalization of approximately 128B USD.
CCC Intelligent Solutions Overview
CCC Intelligent Solutions Holdings Inc. specializes in cloud, mobile, AI, and telematics technologies for the property and casualty insurance sector. Its SaaS platform streamlines AI-enabled workflows and connects entities such as insurance carriers, repairers, and automotive manufacturers. Founded in 1980 and based in Chicago, Illinois, CCC has a market capitalization near 5.6B USD and focuses on digital solutions that facilitate commerce and data integration within the insurance economy.
Key similarities and differences
Both companies operate in the technology sector with a focus on software infrastructure, but they serve distinct markets and applications. Palo Alto Networks emphasizes cybersecurity solutions for diverse industries, while CCC Intelligent Solutions targets workflow digitization and AI for the insurance ecosystem. Palo Alto Networks is significantly larger by market cap and employee count, reflecting its broader enterprise reach compared to CCC’s specialized niche.
Income Statement Comparison
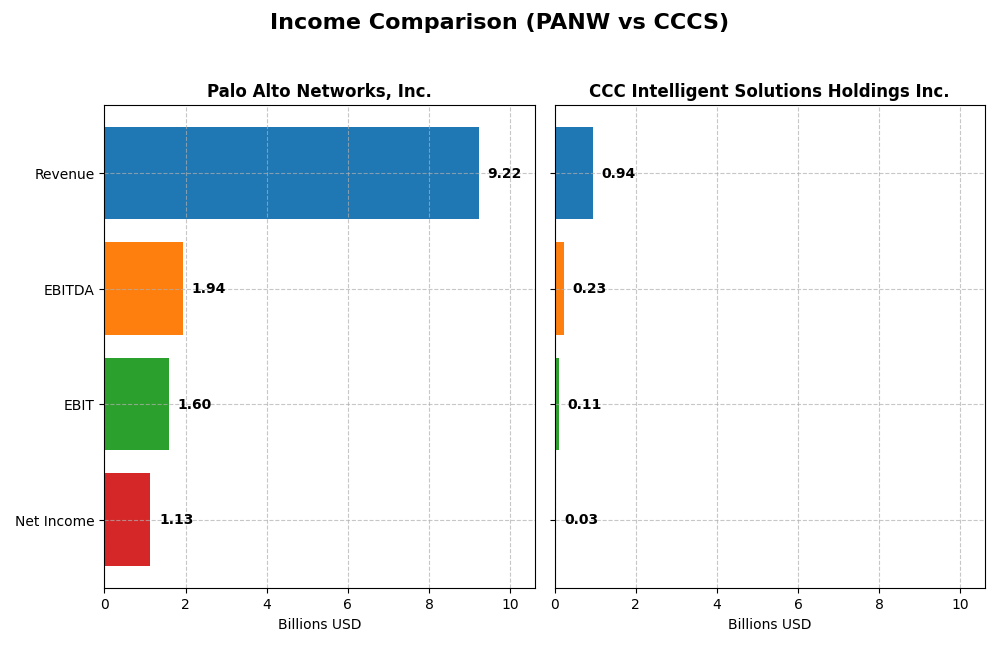
The table below presents a side-by-side comparison of key income statement metrics for Palo Alto Networks, Inc. and CCC Intelligent Solutions Holdings Inc. for their most recent fiscal years.
| Metric | Palo Alto Networks, Inc. | CCC Intelligent Solutions Holdings Inc. |
|---|---|---|
| Market Cap | 128.4B | 5.63B |
| Revenue | 9.22B | 945M |
| EBITDA | 1.94B | 233M |
| EBIT | 1.60B | 109M |
| Net Income | 1.13B | 26.1M |
| EPS | 1.71 | 0.043 |
| Fiscal Year | 2025 | 2024 |
Income Statement Interpretations
Palo Alto Networks, Inc.
From 2021 to 2025, Palo Alto Networks demonstrated strong revenue growth, rising from $4.26B to $9.22B, with net income improving markedly from a loss to $1.13B. Gross and EBIT margins remained favorable, around 73.4% and 17.3% respectively, in 2025. However, net margin and EPS declined in the latest year, indicating some pressure despite overall growth.
CCC Intelligent Solutions Holdings Inc.
CCC Intelligent Solutions experienced steady revenue growth from $633M in 2020 to $945M in 2024, with net income recovering from a loss to $26M. Gross margin stayed strong at 75.6% in 2024, while EBIT margin improved to 11.5%. The latest year saw a solid jump in net margin and EPS, reflecting enhanced profitability and operational efficiency.
Which one has the stronger fundamentals?
Both companies show favorable income statement trends, with Palo Alto Networks leading in scale and margin levels, while CCC Intelligent Solutions exhibits consistent profitability improvements and margin expansion. Palo Alto Networks faces some recent net margin softness, whereas CCC maintains neutral interest expense impact. Overall, each displays strengths aligned with their growth and profitability trajectories.
Financial Ratios Comparison
The table below presents a side-by-side comparison of key financial ratios for Palo Alto Networks, Inc. and CCC Intelligent Solutions Holdings Inc. based on their most recent fiscal year data.
| Ratios | Palo Alto Networks, Inc. (2025) | CCC Intelligent Solutions Holdings Inc. (2024) |
|---|---|---|
| ROE | 14.49% | 1.31% |
| ROIC | 5.67% | 1.86% |
| P/E | 101.43 | 274.02 |
| P/B | 14.70 | 3.59 |
| Current Ratio | 0.89 | 3.65 |
| Quick Ratio | 0.89 | 3.65 |
| D/E | 0.04 | 0.42 |
| Debt-to-Assets | 1.43% | 26.65% |
| Interest Coverage | 414.3 | 1.24 |
| Asset Turnover | 0.39 | 0.30 |
| Fixed Asset Turnover | 12.56 | 4.68 |
| Payout Ratio | 0% | 0% |
| Dividend Yield | 0% | 0% |
Interpretation of the Ratios
Palo Alto Networks, Inc.
Palo Alto Networks shows a mix of strong and weak ratios. It has favorable net margin (12.3%) and low debt levels (debt-to-equity 0.04, debt-to-assets 1.43%), but faces concerns with a high P/E ratio (101.43) and low current ratio (0.89). Asset turnover is also weak, indicating efficiency challenges. The company does not pay dividends, consistent with a growth and reinvestment strategy focused on cybersecurity innovation.
CCC Intelligent Solutions Holdings Inc.
There is no available ratio data for CCC Intelligent Solutions, preventing a detailed analysis. Given the absence of dividend payments, this could reflect reinvestment into growth or research and development, typical for a technology software infrastructure company. Without financial metrics, risks and strengths cannot be assessed comprehensively at this time.
Which one has the best ratios?
Palo Alto Networks presents a slightly favorable ratio profile with solid profitability and solvency metrics but some valuation and liquidity shortcomings. In contrast, CCC Intelligent Solutions lacks available ratio data, making a direct comparison impossible. Based on the evidence, Palo Alto Networks currently demonstrates a clearer financial picture with more evaluated strengths than weaknesses.
Strategic Positioning
This section compares the strategic positioning of Palo Alto Networks and CCC Intelligent Solutions, including market position, key segments, and exposure to technological disruption:
Palo Alto Networks
- Leading cybersecurity software provider with large market cap of 128B USD, facing competitive tech sector pressure
- Key segments: cybersecurity products, subscriptions, and support services driving revenue growth
- Exposure to disruption via cloud security, AI threat intelligence, and SaaS innovations in cybersecurity
CCC Intelligent Solutions
- Smaller market cap of 5.6B USD, operating in property and casualty insurance software with niche focus
- Key segments: AI-enabled SaaS platforms for insurance workflows, repair, and ecosystem solutions
- Leverages cloud, mobile, AI, and telematics to modernize insurance economy workflows and commerce
Palo Alto Networks vs CCC Intelligent Solutions Positioning
Palo Alto Networks pursues a diversified approach with broad cybersecurity solutions for multiple industries, while CCC focuses on a concentrated insurance technology niche. PANW benefits from scale but faces intense competition; CCC has specialized offerings with narrower scope.
Which has the best competitive advantage?
Palo Alto Networks shows a slightly unfavorable moat due to value destruction but with improving profitability, while CCC lacks sufficient data for moat evaluation, limiting competitive advantage assessment.
Stock Comparison
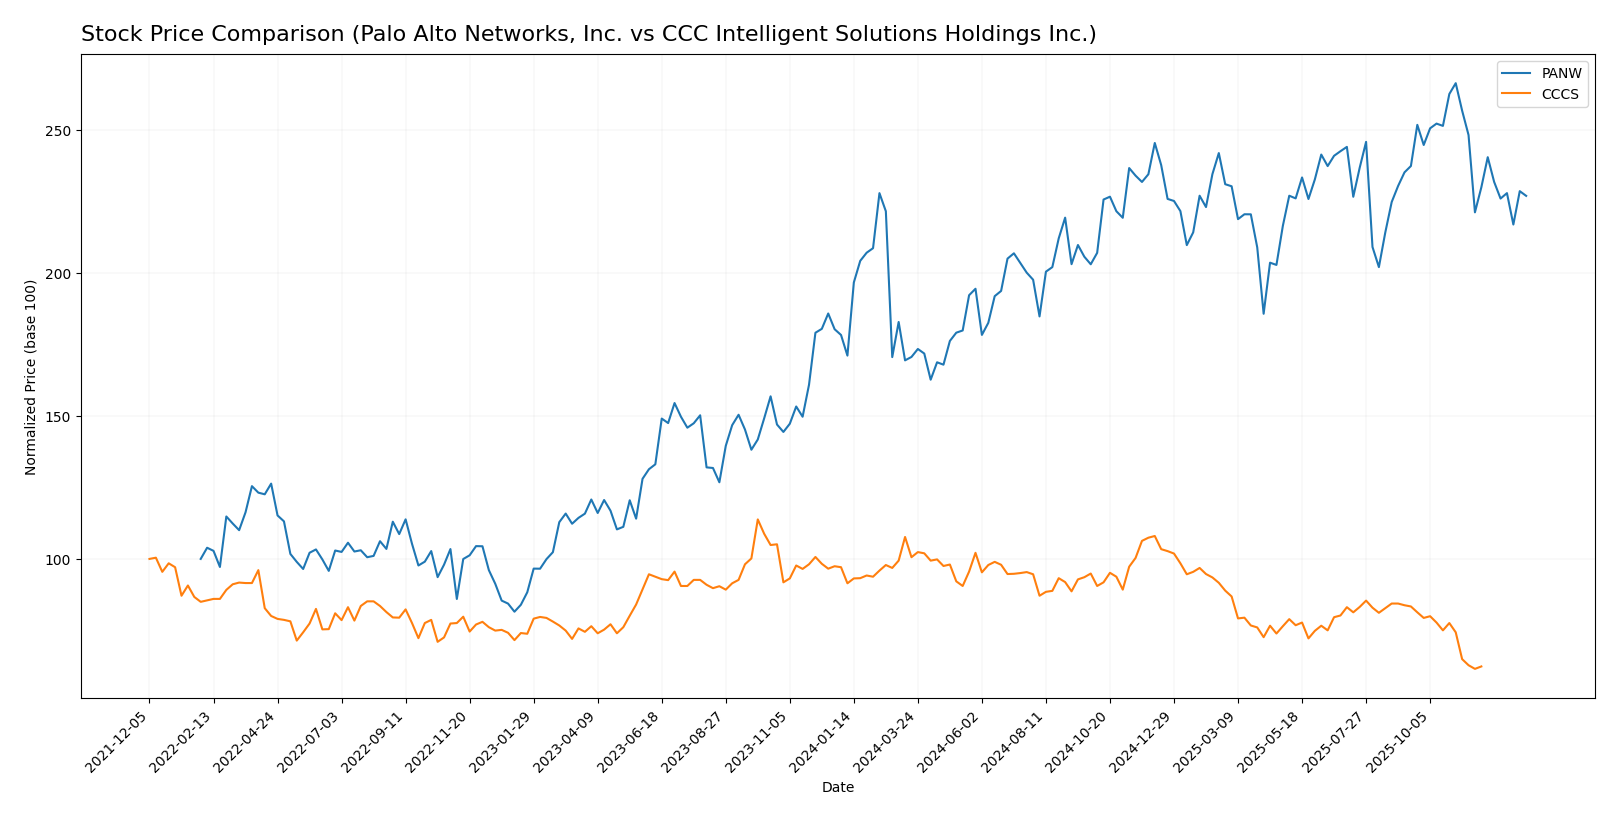
The stock price movements of Palo Alto Networks, Inc. and CCC Intelligent Solutions Holdings Inc. over the past 12 months reveal contrasting performance trajectories, with significant shifts in market sentiment and trading dynamics.
Trend Analysis
Palo Alto Networks, Inc. exhibited a bullish trend over the past year with a 33.05% price increase, despite a recent deceleration and a short-term decline of 14.79%. Price volatility is notable, with a high standard deviation of 19.95.
CCC Intelligent Solutions Holdings Inc. showed a bearish trend over the same period, declining 31.78% with decelerating losses. Recent price decreases of 25.15% occurred amid low volatility, reflected in a 1.24 standard deviation.
Comparing both stocks, Palo Alto Networks delivered the highest market performance with strong overall gains, while CCC Intelligent Solutions faced a sustained downward trend and weaker market returns.
Target Prices
Analysts present a clear target price consensus for Palo Alto Networks, Inc. and CCC Intelligent Solutions Holdings Inc.
| Company | Target High | Target Low | Consensus |
|---|---|---|---|
| Palo Alto Networks, Inc. | 265 | 157 | 231.07 |
| CCC Intelligent Solutions Holdings Inc. | 11 | 11 | 11 |
For Palo Alto Networks, the consensus target of 231.07 USD suggests upside potential compared to the current price of 187.66 USD. CCC Intelligent Solutions’ target price of 11 USD slightly exceeds its current price of 8.75 USD, indicating modest expected appreciation.
Analyst Opinions Comparison
This section compares analysts’ ratings and grades for Palo Alto Networks, Inc. and CCC Intelligent Solutions Holdings Inc.:
Rating Comparison
Palo Alto Networks, Inc. Rating
- Rating: B, classified as Very Favorable by analysts.
- Discounted Cash Flow Score: 4, indicating favorable future cash flow projections.
- ROE Score: 4, showing efficient profit generation from equity.
- ROA Score: 3, reflecting moderate asset utilization efficiency.
- Debt To Equity Score: 4, suggesting a strong balance sheet with low financial risk.
- Overall Score: 3, indicating a moderate overall financial standing.
CCC Intelligent Solutions Holdings Inc. Rating
- No rating data available.
- No data available.
- No data available.
- No data available.
- No data available.
- No data available.
Which one is the best rated?
Based on the available data, Palo Alto Networks, Inc. is better rated with a Very Favorable B rating and solid financial scores. CCC Intelligent Solutions Holdings Inc. lacks any rating or score data for comparison.
Scores Comparison
Here is a comparison of the Altman Z-Score and Piotroski Score for both companies:
Palo Alto Networks, Inc. Scores
- Altman Z-Score: 5.95, indicating a safe zone with low bankruptcy risk.
- Piotroski Score: 6, showing average financial strength.
CCC Intelligent Solutions Holdings Inc. Scores
- Altman Z-Score: 2.18, in the grey zone with moderate bankruptcy risk.
- Piotroski Score: 3, indicating very weak financial strength.
Which company has the best scores?
Palo Alto Networks shows a stronger financial position with a higher Altman Z-Score in the safe zone and a better Piotroski Score indicating average strength. CCC Intelligent Solutions is in the grey zone with very weak Piotroski strength.
Grades Comparison
Here is a comparison of the latest available grades for Palo Alto Networks, Inc. and CCC Intelligent Solutions Holdings Inc.:
Palo Alto Networks, Inc. Grades
The table below summarizes recent grades from notable grading companies for Palo Alto Networks, Inc.:
| Grading Company | Action | New Grade | Date |
|---|---|---|---|
| UBS | Maintain | Neutral | 2026-01-13 |
| Piper Sandler | Maintain | Overweight | 2026-01-05 |
| Guggenheim | Upgrade | Neutral | 2026-01-05 |
| Morgan Stanley | Maintain | Overweight | 2025-12-18 |
| Goldman Sachs | Maintain | Buy | 2025-11-21 |
| HSBC | Downgrade | Reduce | 2025-11-21 |
| Needham | Maintain | Buy | 2025-11-20 |
| WestPark Capital | Maintain | Hold | 2025-11-20 |
| Bernstein | Maintain | Outperform | 2025-11-20 |
| DA Davidson | Maintain | Buy | 2025-11-20 |
Overall, the grades for Palo Alto Networks show a predominantly positive trend with multiple “Buy” and “Overweight” ratings, though a few downgrades and neutral stances indicate some caution.
CCC Intelligent Solutions Holdings Inc. Grades
No reliable grading data is available for CCC Intelligent Solutions Holdings Inc.
The absence of grading data for CCC Intelligent Solutions increases uncertainty for investors relying on analyst opinions.
Which company has the best grades?
Palo Alto Networks, Inc. holds the stronger grading profile with a clear majority of Buy and Overweight ratings, while CCC Intelligent Solutions lacks any grading data. This difference may influence investor confidence and perceived risk.
Strengths and Weaknesses
Below is a comparative overview of key strengths and weaknesses for Palo Alto Networks, Inc. (PANW) and CCC Intelligent Solutions Holdings Inc. (CCCS) based on the most recent data available.
| Criterion | Palo Alto Networks, Inc. (PANW) | CCC Intelligent Solutions Holdings Inc. (CCCS) |
|---|---|---|
| Diversification | Strong product and subscription mix growing steadily; revenue from Products (1.8B), Subscriptions (4.97B), and Support (2.45B) in 2025 | Primarily software subscriptions (906M in 2024) with limited diversification; smaller service segment (38M) |
| Profitability | Net margin 12.3% (favorable); ROIC 5.67% (neutral), but ROIC below WACC indicating slight value destruction | Data unavailable for profitability ratios and margins |
| Innovation | High fixed asset turnover (12.56) suggests efficient use of assets in innovation; ROIC trend strongly positive (224%) | Data unavailable on innovation metrics |
| Global presence | Large and growing subscription base implies strong global reach | Smaller scale and less diversified, likely more regional presence |
| Market Share | High market valuation but with high P/E (101.43) and P/B (14.7) ratios, indicating expensive stock | Data unavailable for market share and valuation |
Key takeaways: Palo Alto Networks shows strong revenue growth and innovation with a broad product mix, but currently destroys value due to ROIC below WACC and expensive valuation multiples. CCC Intelligent Solutions lacks sufficient public data but appears smaller and less diversified, suggesting higher risk. Investors should weigh PANW’s growth potential against its valuation and monitor CCCS for more transparency before decision-making.
Risk Analysis
Below is a summary table highlighting key risk factors for Palo Alto Networks, Inc. (PANW) and CCC Intelligent Solutions Holdings Inc. (CCCS) based on the most recent data from 2025.
| Metric | Palo Alto Networks, Inc. (PANW) | CCC Intelligent Solutions Holdings Inc. (CCCS) |
|---|---|---|
| Market Risk | Moderate (Beta 0.75) | Moderate (Beta 0.72) |
| Debt level | Very Low (Debt/Equity 0.04) | Unknown (Data unavailable) |
| Regulatory Risk | Moderate (Cybersecurity compliance) | Moderate (Insurance tech regulations) |
| Operational Risk | Moderate (Cloud security reliance) | Moderate (AI and telematics platform dependency) |
| Environmental Risk | Low | Low |
| Geopolitical Risk | Moderate (Global cybersecurity threats) | Moderate (Global insurance market exposure) |
Palo Alto Networks shows low financial risk with minimal debt and a solid Altman Z-score indicating financial safety. However, its high P/E and P/B ratios suggest valuation risks. CCC Intelligent Solutions lacks full financial data, but its scores place it in a grey financial zone with weaker financial health, increasing investment risk. The most impactful risks for PANW are market valuation and cybersecurity regulatory compliance, while CCCS faces uncertainty from financial weakness and industry-specific regulatory challenges.
Which Stock to Choose?
Palo Alto Networks, Inc. (PANW) shows a favorable income evolution with strong revenue and net income growth over 2021-2025. Its financial ratios are slightly favorable overall, supported by a low debt-to-equity ratio and high interest coverage. Profitability is solid with a 12.3% net margin, though liquidity ratios are less favorable. The company carries very low debt and holds a very favorable B rating.
CCC Intelligent Solutions Holdings Inc. (CCCS) demonstrates favorable income growth, particularly in net margin and EPS over 2020-2024, with a solid gross margin around 75%. However, financial ratio data is missing, limiting full assessment. CCCS maintains moderate debt levels and a current ratio above 3, indicating strong liquidity. Scoring shows it is in a grey zone for bankruptcy risk with a very weak Piotroski score.
Investors focused on growth might find PANW’s robust income growth and strong rating appealing despite some liquidity concerns. Conversely, those prioritizing liquidity and cautious risk exposure could view CCCS’s healthy working capital and moderate financial stability as more suitable, although incomplete data suggests prudence in evaluation.
Disclaimer: Investment carries a risk of loss of initial capital. The past performance is not a reliable indicator of future results. Be sure to understand risks before making an investment decision.
Go Further
I encourage you to read the complete analyses of Palo Alto Networks, Inc. and CCC Intelligent Solutions Holdings Inc. to enhance your investment decisions: