Home > Comparison > Technology > PLTR vs CCCS
The strategic rivalry between Palantir Technologies Inc. and CCC Intelligent Solutions Holdings Inc. shapes the evolving landscape of software infrastructure. Palantir operates as a data-driven technology powerhouse specializing in intelligence and AI platforms. In contrast, CCC provides cloud-based SaaS solutions tailored to property and casualty insurance workflows. This analysis explores their contrasting operational models to determine which offers superior risk-adjusted returns for diversified portfolios.

Table of contents
Companies Overview
Palantir Technologies and CCC Intelligent Solutions both hold influential roles in the software infrastructure sector, shaping data-driven decision-making.
Palantir Technologies Inc.: Data Platform Pioneer
Palantir leads with advanced software platforms that serve intelligence and government sectors worldwide. Its revenue stems from Palantir Gotham and Foundry, which enable users to analyze complex datasets and streamline operations. In 2026, Palantir’s strategic focus sharpened on expanding AI integration and scalable deployment through its Apollo and Artificial Intelligence Platform.
CCC Intelligent Solutions Holdings Inc.: Insurance Tech Innovator
CCC specializes in cloud-based AI and telematics solutions tailored for the property and casualty insurance market. Revenue flows from its SaaS platform that digitizes workflows for insurers, repairers, and parts suppliers. CCC’s 2026 strategy emphasizes enhancing AI-powered claims processing and expanding its ecosystem across insurance and automotive sectors.
Strategic Collision: Similarities & Divergences
Both companies leverage AI-driven software to transform critical industries, yet Palantir targets broad intelligence and government applications, while CCC focuses tightly on insurance. Their competition centers on who better integrates AI to improve operational efficiency and customer outcomes. Palantir offers a high-growth, innovation-driven profile, contrasting CCC’s niche, stable SaaS business model.
Income Statement Comparison
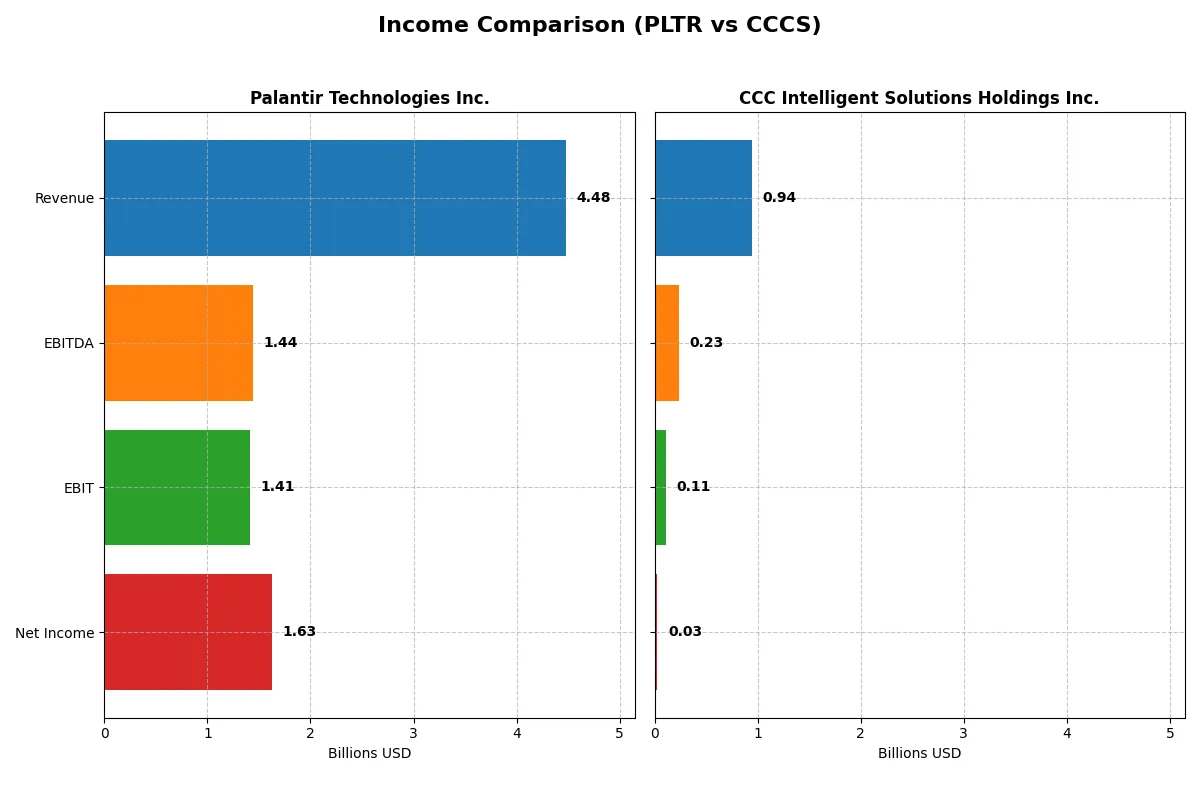
This data dissects the core profitability and scalability of both corporate engines to reveal who dominates the bottom line:
| Metric | Palantir Technologies Inc. (PLTR) | CCC Intelligent Solutions Holdings Inc. (CCCS) |
|---|---|---|
| Revenue | 4.48B | 945M |
| Cost of Revenue | 789M | 231M |
| Operating Expenses | 2.27B | 634M |
| Gross Profit | 3.69B | 714M |
| EBITDA | 1.44B | 233M |
| EBIT | 1.41B | 109M |
| Interest Expense | 0 | 65M |
| Net Income | 1.63B | 26M |
| EPS | 0.69 | 0.043 |
| Fiscal Year | 2025 | 2024 |
Income Statement Analysis: The Bottom-Line Duel
This income statement comparison reveals which company drives superior operational efficiency and profit generation in their respective markets.
Palantir Technologies Inc. Analysis
Palantir’s revenue surged from 1.54B in 2021 to 4.48B in 2025, with net income rising dramatically from a 520M loss to a 1.63B profit. Its gross margin holds a robust 82.4%, while the net margin expanded to 36.3%, signaling exceptional cost control and scale efficiency in 2025. The company’s EBIT growth of 356% in one year highlights accelerating profitability momentum.
CCC Intelligent Solutions Holdings Inc. Analysis
CCC’s revenue grew steadily from 633M in 2020 to 945M in 2024, with net income rebounding from a 25M loss to a modest 26M gain. Gross margin remains solid at 75.6%, but net margin lags at 2.8%, reflecting ongoing challenges in converting sales into profits. Despite a strong one-year EBIT growth of 619%, overall profitability remains constrained by higher interest expenses and operating costs.
Margin Dominance vs. Modest Growth
Palantir outpaces CCC significantly in scale, margin strength, and bottom-line growth over the recent period. Its superior gross and net margins demonstrate a durable competitive moat and effective capital allocation. Investors seeking robust profitability and high momentum may favor Palantir’s profile. Conversely, CCC appeals more as a steady grower facing margin pressure and financial leverage risks.
Financial Ratios Comparison
These vital ratios act as a diagnostic tool to expose the underlying fiscal health, valuation premiums, and capital efficiency of the companies compared below:
| Ratios | Palantir Technologies Inc. (PLTR) | CCC Intelligent Solutions Holdings Inc. (CCCS) |
|---|---|---|
| ROE | 22.0% | 1.3% |
| ROIC | 17.9% | 1.9% |
| P/E | 259.2 | 274.0 |
| P/B | 57.0 | 3.6 |
| Current Ratio | 7.1 | 3.6 |
| Quick Ratio | 7.1 | 3.6 |
| D/E (Debt-to-Equity) | 0.03 | 0.42 |
| Debt-to-Assets | 2.6% | 26.7% |
| Interest Coverage | 0 (not reported) | 1.24 |
| Asset Turnover | 0.50 | 0.30 |
| Fixed Asset Turnover | 17.8 | 4.7 |
| Payout Ratio | 0% | 0% |
| Dividend Yield | 0% | 0% |
| Fiscal Year | 2025 | 2024 |
Efficiency & Valuation Duel: The Vital Signs
Financial ratios act as a company’s DNA, exposing hidden risks and operational excellence critical for nuanced investment decisions.
Palantir Technologies Inc.
Palantir posts a robust 22% ROE and a stellar 36.3% net margin, signaling strong profitability and operational efficiency. Yet, its valuation is highly stretched, with a P/E of 259 and P/B of 57, far above tech sector norms. The firm pays no dividends, instead aggressively reinvesting in R&D (12.5% of revenue) to fuel growth.
CCC Intelligent Solutions Holdings Inc.
Data for CCC Intelligent Solutions’ key ratios are unavailable, limiting direct profitability and valuation analysis. This opacity introduces uncertainty about its operational efficiency and shareholder returns, complicating any thorough ratio-based evaluation or risk assessment at present.
Premium Valuation vs. Data Scarcity: A Clear Contrast
Palantir’s metrics reveal impressive profitability but at a steep valuation premium, demanding cautious scrutiny. CCC’s lack of disclosed ratios clouds its financial health, raising risk. Investors favoring transparency and proven profitability will lean toward Palantir, while risk-tolerant profiles might await clearer data from CCC.
Which one offers the Superior Shareholder Reward?
Palantir Technologies Inc. (PLTR) and CCC Intelligent Solutions Holdings Inc. (CCCS) both forgo dividends, focusing on reinvestment and buybacks. PLTR boasts zero dividend payout but sustains a hefty buyback program, leveraging strong free cash flow (0.89/share) and a current ratio above 7 for stability. CCCS also pays no dividends but shows weaker free cash flow coverage (0.38/share) and has a moderate buyback intensity. PLTR’s capital allocation emphasizes growth and returns via buybacks, sustaining a high operating margin (31.6%) and rock-solid balance sheet. CCCS holds higher debt levels and thinner margins, risking sustainability. I conclude PLTR offers a superior total return profile in 2026 due to disciplined buybacks and robust cash flow generation.
Bankruptcy Risk Duel (Altman Z-Score)
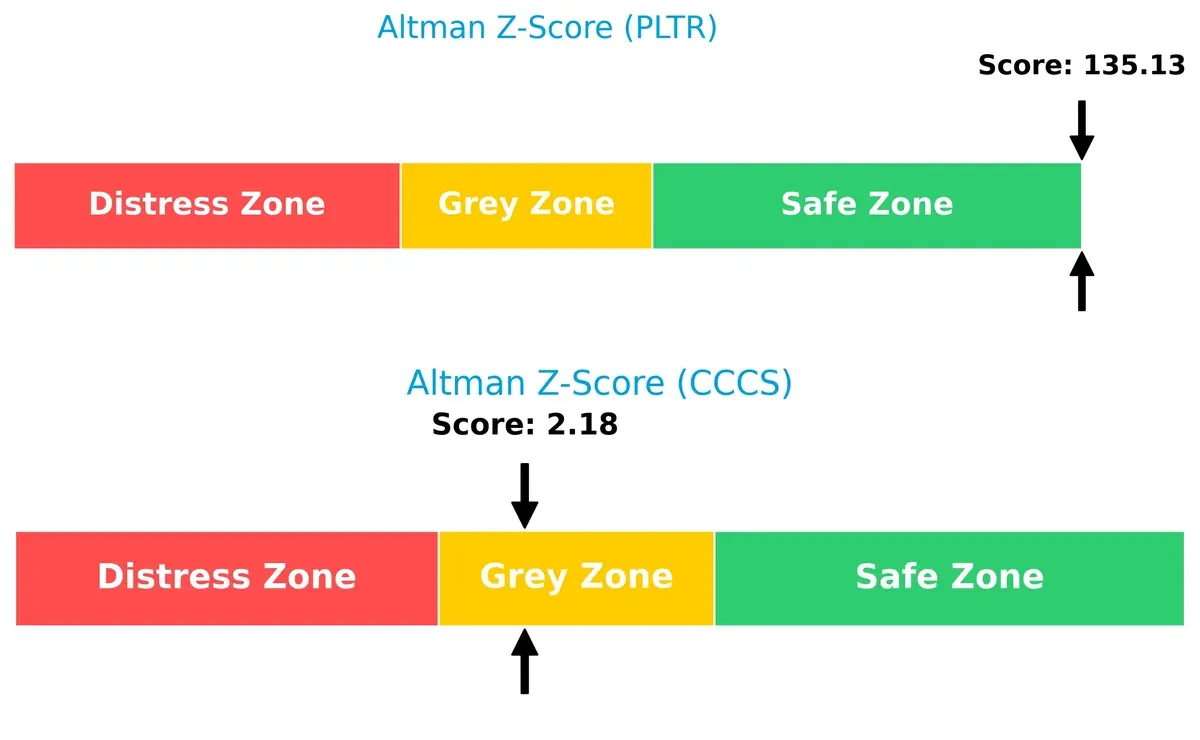
Bankruptcy Risk: Solvency Showdown
I observe a stark contrast in Altman Z-Scores: Palantir’s 135.1 firmly positions it in the safe zone, while CCC Intelligent’s 2.18 lands in the grey zone. This gap signals Palantir’s superior long-term survival odds in volatile cycles:
Financial Strength Showdown (Piotroski F-Score)
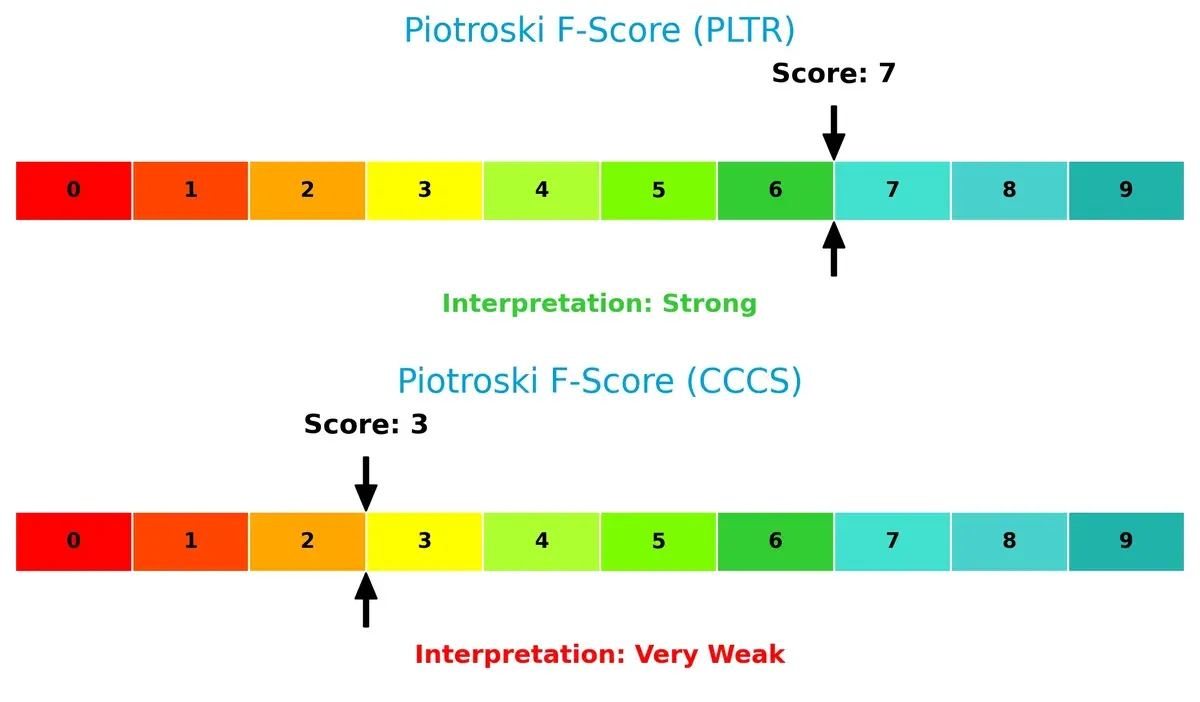
Financial Health: Quality of Operations
Palantir scores a strong 7 on the Piotroski scale, indicating robust financial health and operational quality. CCC Intelligent’s weak 3 raises red flags, suggesting internal financial stress and operational challenges:
How are the two companies positioned?
This section dissects the operational DNA of Palantir and CCC by comparing their revenue distribution and internal dynamics. The goal is to confront their economic moats and identify which model offers the most sustainable competitive advantage today.
Revenue Segmentation: The Strategic Mix
This visual comparison dissects how Palantir Technologies and CCC Intelligent Solutions diversify their income streams and reveals where their primary sector bets lie:
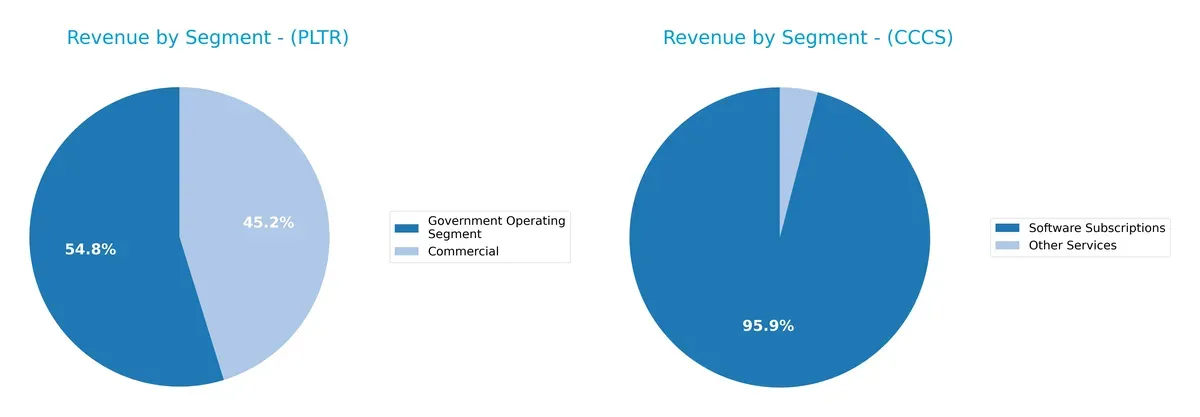
Palantir’s revenue pivots between Commercial ($1.3B) and Government ($1.57B) segments, showing balanced diversification. CCC Intelligent Solutions dwarfs its “Other Services” ($38M) with a heavy reliance on Software Subscriptions ($906M). Palantir’s dual-segment approach mitigates concentration risk and leverages government contracts for stability. CCC’s dependence on subscriptions signals infrastructure dominance but poses vulnerability to software market shifts.
Strengths and Weaknesses Comparison
This table compares the strengths and weaknesses of Palantir Technologies Inc. and CCC Intelligent Solutions Holdings Inc.:
Palantir Technologies Inc. Strengths
- Strong profitability with 36.31% net margin
- High ROE at 22%
- Favorable ROIC of 17.95% exceeding WACC
- Robust global presence across US, UK, and Rest of World
- Increasing revenue from commercial and government segments
CCC Intelligent Solutions Holdings Inc. Strengths
- Diversified revenue from software subscriptions and other services
- Significant market presence in the Americas
- Consistent revenue growth in software subscriptions
Palantir Technologies Inc. Weaknesses
- High PE ratio of 259.19 indicating expensive valuation
- Elevated PB ratio at 57.02
- Unfavorable current ratio at 7.11 possibly signaling inefficient asset use
- Debt to equity extremely low, limiting leverage benefits
- Zero dividend yield
- Limited asset turnover at 0.5
CCC Intelligent Solutions Holdings Inc. Weaknesses
- Lack of available financial ratios and profitability data
- Limited geographic diversification primarily concentrated in Americas
- Small revenue from China segment
Palantir shows strong profitability and global diversification but faces valuation and liquidity concerns. CCC’s data gaps and regional concentration highlight transparency and diversification risks. Both companies’ strategic positioning hinges on addressing these weaknesses to sustain growth.
The Moat Duel: Analyzing Competitive Defensibility
A structural moat is the sole shield preserving long-term profits against relentless competition erosion:
Palantir Technologies Inc.: Data Network Effects Powerhouse
Palantir’s moat stems from powerful network effects in intelligence and enterprise data integration. Its 6.2% ROIC premium over WACC and margin stability showcase value creation. Expansion into AI-driven analytics in 2026 promises to deepen this advantage.
CCC Intelligent Solutions Holdings Inc.: AI-Enabled Workflow Integrator
CCC’s moat lies in AI-driven workflow digitization for the insurance ecosystem, contrasting Palantir’s broader data dominance. Though growth is solid, limited margin expansion signals a narrower moat. Opportunities in telematics and payments could disrupt markets in 2026.
Network Effects vs. Niche AI Integration
Palantir’s wide moat outmatches CCC’s focused AI moat, backed by superior ROIC and margin strength. Palantir stands better poised to defend and expand its market share amid intensifying competition.
Which stock offers better returns?
Over the past year, Palantir Technologies soared sharply before decelerating recently, while CCC Intelligent Solutions declined steadily with moderate volume increases, reflecting contrasting trading dynamics.
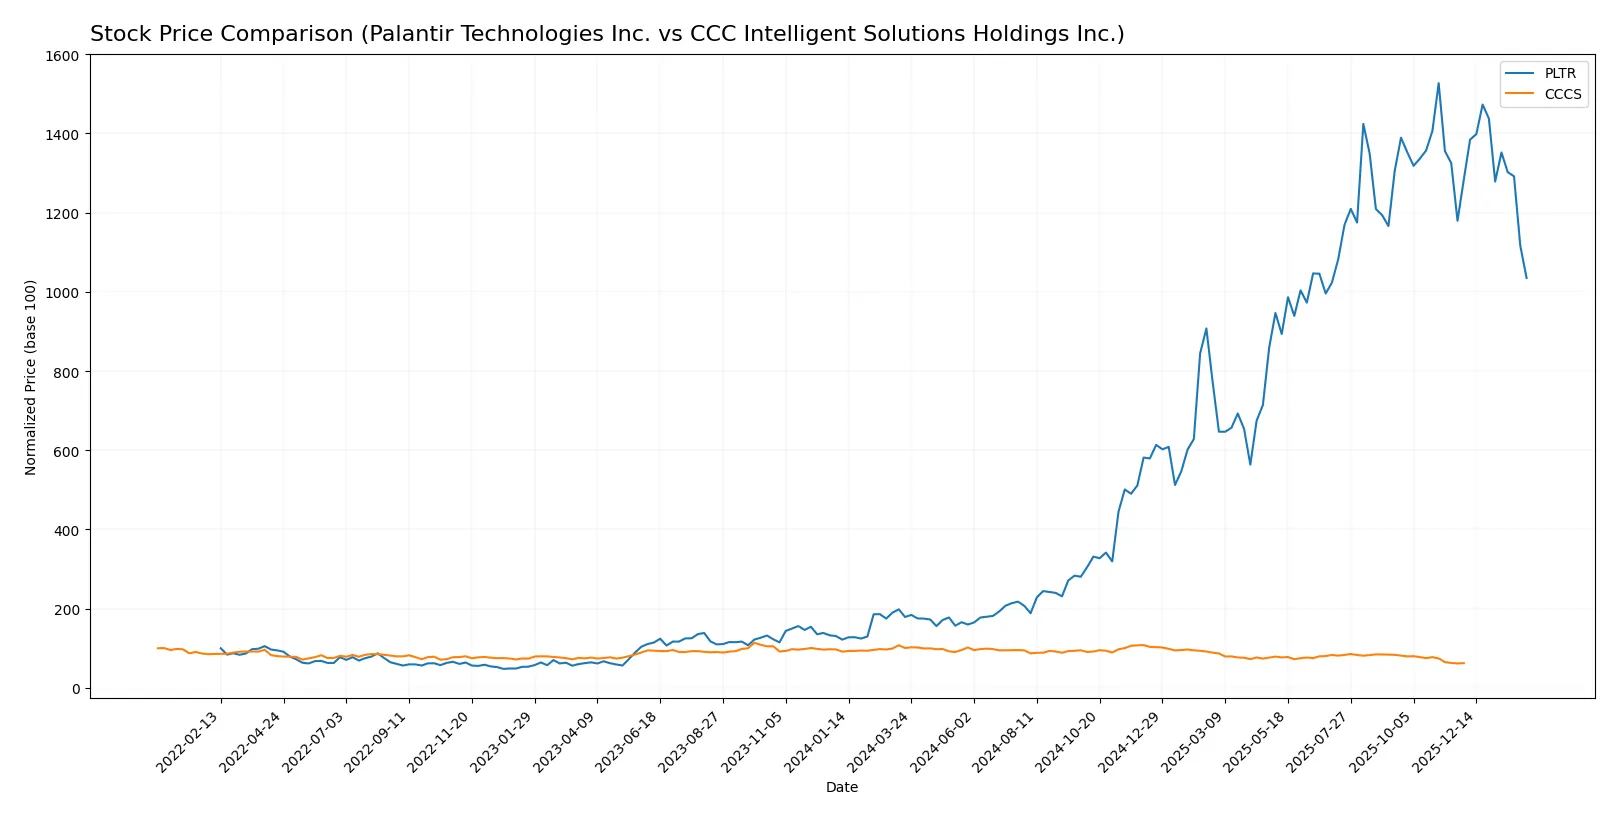
Trend Comparison
Palantir’s stock price rose 478.54% over the past 12 months, marking a strong bullish trend despite recent deceleration and a 12.24% drop in the last quarter.
CCC Intelligent Solutions’ stock fell 31.78% over the same period, signaling a clear bearish trend with decelerating losses and a recent 25.15% decline.
Palantir outperformed CCC by a wide margin, delivering the highest market returns despite recent short-term weakness in buyer dominance.
Target Prices
Analysts present a clear consensus on target prices for Palantir Technologies Inc. and CCC Intelligent Solutions Holdings Inc.
| Company | Target Low | Target High | Consensus |
|---|---|---|---|
| Palantir Technologies Inc. | 180 | 230 | 200.15 |
| CCC Intelligent Solutions Holdings Inc. | 11 | 11 | 11 |
Palantir’s consensus target of 200.15 implies a 47% upside from the current 135.9 stock price, signaling strong growth expectations. CCC’s target at 11 suggests a modest 26% increase over its 8.75 price, reflecting conservative optimism.

Don’t Let Luck Decide Your Entry Point
Optimize your entry points with our advanced ProRealTime indicators. You’ll get efficient buy signals with precise price targets for maximum performance. Start outperforming now!
How do institutions grade them?
The following summarizes the most recent institutional grades for the two companies:
Palantir Technologies Inc. Grades
This table shows recent stock grades from reputable financial institutions for Palantir Technologies Inc.:
| Grading Company | Action | New Grade | Date |
|---|---|---|---|
| UBS | Maintain | Neutral | 2026-02-03 |
| Citigroup | Maintain | Buy | 2026-02-03 |
| DA Davidson | Maintain | Neutral | 2026-02-03 |
| Citigroup | Upgrade | Buy | 2026-01-12 |
| DA Davidson | Maintain | Neutral | 2025-11-04 |
| RBC Capital | Maintain | Underperform | 2025-11-04 |
| Baird | Maintain | Neutral | 2025-11-04 |
| Goldman Sachs | Maintain | Neutral | 2025-11-04 |
| Mizuho | Maintain | Neutral | 2025-11-04 |
| Morgan Stanley | Maintain | Equal Weight | 2025-11-04 |
CCC Intelligent Solutions Holdings Inc. Grades
No reliable institutional grades are available for CCC Intelligent Solutions Holdings Inc. at this time.
Which company has the best grades?
Palantir Technologies Inc. holds a broader range of institutional grades, including multiple “Buy” ratings from Citigroup. CCC Intelligent Solutions lacks any current institutional grading, which may limit investor insight. Investors might view Palantir’s mix of neutral and buy ratings as a sign of cautious optimism but should be mindful of the underperform rating from RBC Capital.
Risks specific to each company
The following categories identify the critical pressure points and systemic threats facing both firms in the 2026 market environment:
1. Market & Competition
Palantir Technologies Inc.
- Dominates government and intelligence software with strong data integration capabilities but faces high tech competition.
CCC Intelligent Solutions Holdings Inc.
- Operates in insurance tech niche with less market power and limited scale versus larger SaaS peers.
2. Capital Structure & Debt
Palantir Technologies Inc.
- Pristine balance sheet with negligible debt (D/E 0.03), supporting financial flexibility.
CCC Intelligent Solutions Holdings Inc.
- Debt profile unclear due to missing data, raising transparency concerns.
3. Stock Volatility
Palantir Technologies Inc.
- High beta (1.69) indicates elevated volatility and sensitivity to market swings.
CCC Intelligent Solutions Holdings Inc.
- Low beta (0.72) suggests more stable price movements but less growth leverage.
4. Regulatory & Legal
Palantir Technologies Inc.
- Faces scrutiny due to government contracts and data privacy in multiple jurisdictions.
CCC Intelligent Solutions Holdings Inc.
- Industry regulation is moderate but less exposed to international legal risks.
5. Supply Chain & Operations
Palantir Technologies Inc.
- Software deployment flexibility via cloud and on-premises reduces operational risks.
CCC Intelligent Solutions Holdings Inc.
- Relies heavily on cloud infrastructure and partnerships, potentially vulnerable to disruptions.
6. ESG & Climate Transition
Palantir Technologies Inc.
- Limited public ESG disclosures; sector-wide pressure to improve data ethics and sustainability.
CCC Intelligent Solutions Holdings Inc.
- ESG data unavailable, which raises concern about compliance and investor appeal.
7. Geopolitical Exposure
Palantir Technologies Inc.
- Significant exposure to U.S. and allied government contracts, sensitive to geopolitical tensions.
CCC Intelligent Solutions Holdings Inc.
- Primarily U.S.-focused with limited international geopolitical risk.
Which company shows a better risk-adjusted profile?
Palantir’s strongest risk is high stock volatility driven by market sensitivity and valuation extremes. CCC faces the most significant risk from opaque financial data and weaker credit transparency. Palantir’s pristine balance sheet and strong Altman Z-score position it better on risk-adjusted grounds despite volatility. CCC’s grey zone distress signals and poor Piotroski score highlight financial fragility. The absence of critical ratios and ratings for CCC justifies caution and favors Palantir for conservative investors.
Final Verdict: Which stock to choose?
Palantir Technologies Inc. (PLTR) impresses with its superpower of generating robust returns on invested capital well above its cost of capital. This efficiency signals a strong and sustainable competitive advantage. A point of vigilance remains its sky-high valuation multiples, which could pressure returns if growth slows. PLTR suits aggressive growth portfolios willing to pay a premium for innovation leadership.
CCC Intelligent Solutions Holdings Inc. (CCCS) offers a strategic moat grounded in steady recurring revenue streams and a solid gross margin profile. It presents a more conservative risk profile relative to Palantir, with moderate profitability and a less volatile balance sheet. CCCS appears better suited for growth-at-a-reasonable-price (GARP) investors seeking stability alongside growth potential.
If you prioritize rapid value creation and can tolerate valuation risk, Palantir outshines with compelling efficiency and growth metrics. However, if you seek better stability and a more balanced risk-return tradeoff, CCCS offers a safer growth path, albeit with less spectacular upside. Each fits distinct investor avatars navigating the current tech landscape.
Disclaimer: Investment carries a risk of loss of initial capital. The past performance is not a reliable indicator of future results. Be sure to understand risks before making an investment decision.
Go Further
I encourage you to read the complete analyses of Palantir Technologies Inc. and CCC Intelligent Solutions Holdings Inc. to enhance your investment decisions: