In today’s fast-evolving technology landscape, Oracle Corporation and CCC Intelligent Solutions Holdings Inc. stand out as key players in the software infrastructure industry. Oracle, a global giant with diversified cloud and enterprise solutions, contrasts with CCC’s specialized focus on AI-driven platforms for the insurance sector. Comparing these companies offers valuable insights into innovation strategies and market positioning. Join me as we explore which company presents the most compelling opportunity for investors.

Table of contents
Companies Overview
I will begin the comparison between Oracle Corporation and CCC Intelligent Solutions Holdings Inc. by providing an overview of these two companies and their main differences.
Oracle Overview
Oracle Corporation focuses on delivering enterprise information technology solutions worldwide. It offers cloud software applications, including ERP, performance, supply chain, human capital management, and marketing tools, alongside infrastructure technologies like databases, middleware, and hardware products. Founded in 1977 and headquartered in Austin, Texas, Oracle operates in the Software – Infrastructure industry and serves diverse sectors via direct and indirect sales channels.
CCC Intelligent Solutions Overview
CCC Intelligent Solutions Holdings Inc. provides cloud-based SaaS platforms that digitize AI-enabled workflows for the property and casualty insurance economy. Its offerings include insurance, repair, ecosystem, and international solutions that connect insurers, repairers, manufacturers, and financial institutions. Founded in 1980 and based in Chicago, Illinois, CCC operates in the Software – Infrastructure sector, focusing on the insurance industry’s technology needs.
Key similarities and differences
Both companies operate in the Technology sector within Software – Infrastructure but target different markets. Oracle provides a broad range of enterprise IT products and cloud services across multiple industries, while CCC specializes in AI-driven SaaS solutions for the insurance economy. Oracle is a much larger company with a $549B market cap and 159K employees, compared to CCC’s $5.6B market cap and 2.3K employees, reflecting differences in scale and market reach.
Income Statement Comparison
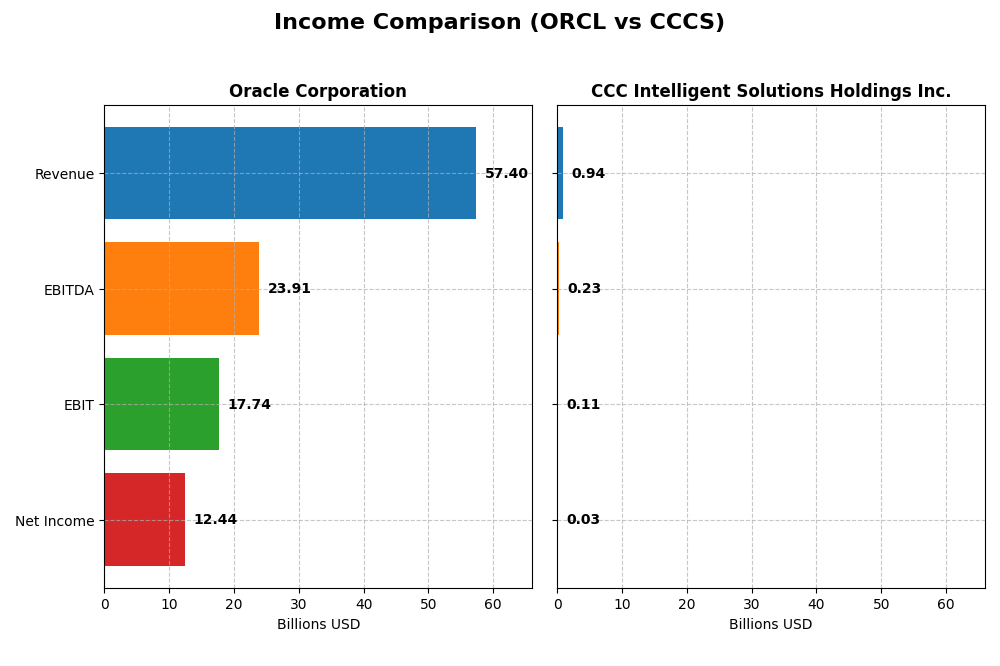
This table presents the key income statement metrics for Oracle Corporation and CCC Intelligent Solutions Holdings Inc. for their most recent fiscal years, allowing a direct financial comparison.
| Metric | Oracle Corporation (ORCL) | CCC Intelligent Solutions Holdings Inc. (CCCS) |
|---|---|---|
| Market Cap | 549B | 5.6B |
| Revenue | 57.4B | 945M |
| EBITDA | 23.9B | 233M |
| EBIT | 17.7B | 109M |
| Net Income | 12.4B | 26M |
| EPS | 4.46 | 0.0428 |
| Fiscal Year | 2025 | 2024 |
Income Statement Interpretations
Oracle Corporation
Oracle’s revenue grew steadily from $40.5B in 2021 to $57.4B in 2025, reflecting a 41.8% increase overall. Net income fluctuated, peaking at $13.7B in 2021 but declining to $12.4B in 2025, showing a -9.48% trend. Margins remain strong, with a 70.51% gross margin and 21.68% net margin in 2025, while recent growth in revenue and EBIT margins points to improved operational efficiency.
CCC Intelligent Solutions Holdings Inc.
CCC’s revenue advanced from $633M in 2020 to $945M in 2024, marking a 49.24% rise overall. Net income recovered from a loss of $17M in 2020 to a positive $26M in 2024, denoting a significant turnaround. Gross margin is favorable at 75.55%, while net margin is modest at 2.77%. Recent year growth in EBIT and net margin was substantial, reflecting improving profitability and operational leverage.
Which one has the stronger fundamentals?
Oracle demonstrates robust scale with consistently strong gross and net margins, though net income growth over the period is negative. CCC shows impressive revenue and net income growth with improving margins from a prior loss, but at a much smaller scale. Both show favorable income statement evaluations, with Oracle excelling in margin stability and CCC excelling in growth momentum.
Financial Ratios Comparison
The table below presents the most recent key financial ratios for Oracle Corporation and CCC Intelligent Solutions Holdings Inc., highlighting their profitability, liquidity, leverage, and market valuation metrics as of fiscal year 2025 and 2024 respectively.
| Ratios | Oracle Corporation (2025) | CCC Intelligent Solutions (2024) |
|---|---|---|
| ROE | 60.8% | 1.31% |
| ROIC | 10.9% | 1.86% |
| P/E | 37.1 | 274.0 |
| P/B | 22.6 | 3.59 |
| Current Ratio | 0.75 | 3.65 |
| Quick Ratio | 0.75 | 3.65 |
| D/E (Debt to Equity) | 5.09 | 0.42 |
| Debt-to-Assets | 61.8% | 26.7% |
| Interest Coverage | 4.94 | 1.24 |
| Asset Turnover | 0.34 | 0.30 |
| Fixed Asset Turnover | 1.32 | 4.68 |
| Payout Ratio | 38.1% | 0% |
| Dividend Yield | 1.03% | 0% |
Interpretation of the Ratios
Oracle Corporation
Oracle shows several strong ratios, including a favorable net margin of 21.68%, ROE at 60.84%, and ROIC at 10.86%, indicating efficient profitability and capital use. However, concerns arise with a high debt-to-equity ratio of 5.09, a low current ratio of 0.75, and elevated valuation multiples such as a P/E of 37.1 and P/B of 22.57. Oracle pays dividends with a modest yield of 1.03%, supported by stable payouts but caution is advised due to the company’s high leverage and liquidity constraints.
CCC Intelligent Solutions Holdings Inc.
Data for CCC Intelligent Solutions’ financial ratios is missing, preventing a comprehensive evaluation. The company does not pay dividends, which may reflect its growth-focused strategy and reinvestment priorities in technology and innovation. Investors should consider the absence of dividend returns alongside the lack of detailed ratio data when assessing CCC’s financial health and shareholder return potential.
Which one has the best ratios?
Oracle presents a mixed ratio profile with strong profitability and capital efficiency metrics but significant weaknesses in liquidity, leverage, and valuation. CCC’s ratio data is unavailable, limiting direct comparison. Based on available information, Oracle’s ratios provide more tangible insights, though investors must weigh its unfavorable leverage and liquidity against its profitability strengths.
Strategic Positioning
This section compares the strategic positioning of Oracle Corporation and CCC Intelligent Solutions Holdings Inc., focusing on market position, key segments, and exposure to technological disruption:
Oracle Corporation
- Large market cap of 549B with significant competitive pressure in global enterprise IT software.
- Diverse revenue streams: cloud and license (49.2B), hardware (2.9B), and services (5.2B) as main business drivers.
- Invests in advanced cloud infrastructure, AI, blockchain, and autonomous database technologies.
CCC Intelligent Solutions Holdings Inc.
- Smaller market cap of 5.6B, operating in a niche insurance technology market.
- Concentrated on SaaS subscriptions (906M) and other services (38M) focused on insurance economy.
- Uses cloud, mobile, AI, telematics, and hyperscale technologies tailored to insurance workflows.
Oracle Corporation vs CCC Intelligent Solutions Holdings Inc. Positioning
Oracle’s strategy is diversified across multiple technology segments and industries, offering broad cloud and infrastructure solutions. CCC focuses on a concentrated niche, leveraging AI and SaaS for the property and casualty insurance market, limiting its market scope but specializing in industry-specific workflows.
Which has the best competitive advantage?
Based on MOAT evaluation, Oracle shows a slightly unfavorable moat with declining return on invested capital, indicating challenges in sustaining competitive advantage. CCC lacks sufficient data to assess its competitive moat.
Stock Comparison
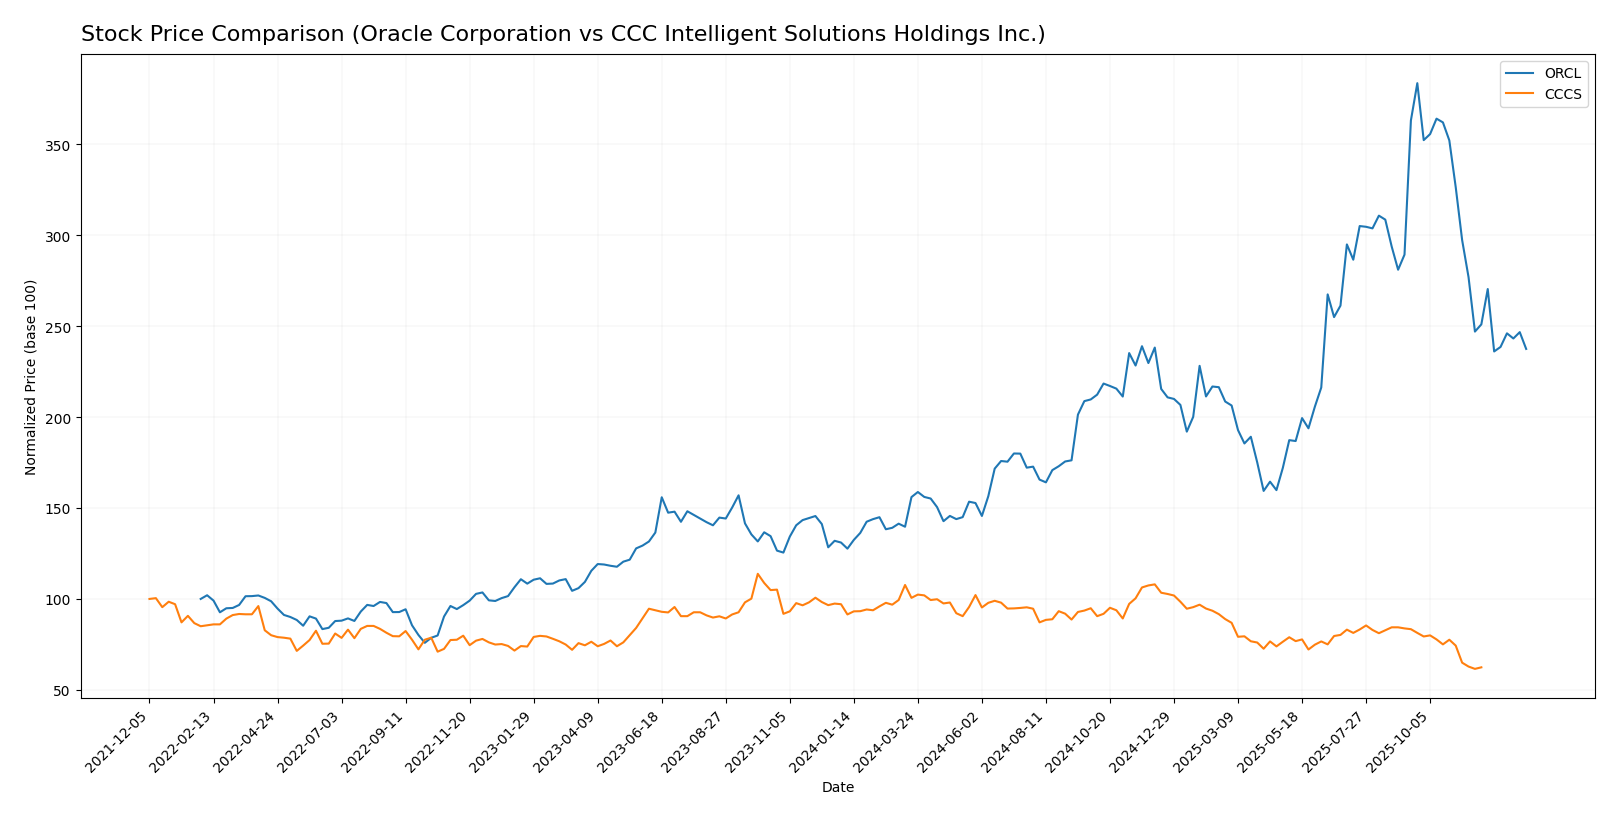
The stock prices of Oracle Corporation and CCC Intelligent Solutions Holdings Inc. over the past 12 months show contrasting dynamics, with Oracle exhibiting significant gains before a recent decline, while CCC faced a steady downward trajectory.
Trend Analysis
Oracle Corporation’s stock showed a strong bullish trend with a 70.69% increase over the past year, though recent months indicate a 27.23% decline, reflecting deceleration despite high volatility (std deviation 49.0).
CCC Intelligent Solutions experienced a bearish trend with a 31.78% drop over the same period, accompanied by deceleration and low volatility (std deviation 1.24), with recent performance further declining by 25.15%.
Comparing both, Oracle delivered the highest market performance over the past year, displaying a substantial overall gain versus CCC’s consistent losses.
Target Prices
The current target price consensus for Oracle Corporation and CCC Intelligent Solutions Holdings Inc. shows diverse analyst expectations.
| Company | Target High | Target Low | Consensus |
|---|---|---|---|
| Oracle Corporation | 400 | 175 | 314.08 |
| CCC Intelligent Solutions Holdings Inc. | 11 | 11 | 11 |
Analysts expect Oracle’s stock to potentially rise significantly above the current price of 191.09 USD, reflecting strong growth optimism. CCC’s target price of 11 USD is modestly above its current 8.75 USD, indicating more conservative expectations.
Analyst Opinions Comparison
This section compares analysts’ ratings and grades for Oracle Corporation and CCC Intelligent Solutions Holdings Inc.:
Rating Comparison
Oracle Corporation Rating
- Rating: B, considered Very Favorable by evaluators.
- Discounted Cash Flow Score: 3, indicating a Moderate status.
- ROE Score: 5, rated Very Favorable for profit generation.
- ROA Score: 4, assessed as Favorable in asset utilization.
- Debt To Equity Score: 1, marked Very Unfavorable, indicating high financial risk.
- Overall Score: 3, with a Moderate overall financial standing.
CCC Intelligent Solutions Holdings Inc. Rating
- No rating data available.
- No data available.
- No data available.
- No data available.
- No data available.
- No data available.
Which one is the best rated?
Based strictly on the available data, Oracle Corporation is the only company with analyst ratings and scores, showing a mix of very favorable and unfavorable indicators. CCC Intelligent Solutions has no rating data for comparison.
Scores Comparison
Here is a comparison of the Altman Z-Score and Piotroski Score for Oracle Corporation and CCC Intelligent Solutions Holdings Inc.:
ORCL Scores
- Altman Z-Score: 2.43, in the grey zone, indicating moderate bankruptcy risk.
- Piotroski Score: 5, classified as average financial strength.
CCCS Scores
- Altman Z-Score: 2.18, in the grey zone, indicating moderate bankruptcy risk.
- Piotroski Score: 3, classified as very weak financial strength.
Which company has the best scores?
Oracle has a higher Piotroski Score of 5 versus CCCS’s 3, indicating stronger financial health. Both companies share similar moderate bankruptcy risk with Altman Z-Scores in the grey zone.
Grades Comparison
The following presents a comparison of the available grades for Oracle Corporation and CCC Intelligent Solutions Holdings Inc.:
Oracle Corporation Grades
This table summarizes recent grades from reputable financial institutions for Oracle Corporation.
| Grading Company | Action | New Grade | Date |
|---|---|---|---|
| UBS | Maintain | Buy | 2026-01-05 |
| RBC Capital | Maintain | Sector Perform | 2026-01-05 |
| Jefferies | Maintain | Buy | 2026-01-05 |
| Goldman Sachs | Maintain | Neutral | 2025-12-12 |
| Keybanc | Maintain | Overweight | 2025-12-11 |
| UBS | Maintain | Buy | 2025-12-11 |
| Citigroup | Maintain | Buy | 2025-12-11 |
| JP Morgan | Maintain | Neutral | 2025-12-11 |
| DA Davidson | Maintain | Neutral | 2025-12-11 |
| Scotiabank | Maintain | Sector Outperform | 2025-12-11 |
Oracle’s grades predominantly reflect positive ratings, with a consensus buy stance supported by a majority of buy recommendations and consistent neutral to overweight assessments.
There are no reliable grades available for CCC Intelligent Solutions Holdings Inc., indicating less publicly accessible analyst coverage.
Which company has the best grades?
Oracle Corporation clearly holds superior grades compared to CCC Intelligent Solutions Holdings Inc., which lacks reliable grading data. This suggests Oracle benefits from broader analyst support, potentially offering investors more confidence in its market position and valuation insights.
Strengths and Weaknesses
Below is a comparative table highlighting the key strengths and weaknesses of Oracle Corporation (ORCL) and CCC Intelligent Solutions Holdings Inc. (CCCS) based on the most recent available data.
| Criterion | Oracle Corporation (ORCL) | CCC Intelligent Solutions Holdings Inc. (CCCS) |
|---|---|---|
| Diversification | Highly diversified with strong Cloud & License business generating $49.2B in 2025, plus hardware and services segments | Focused primarily on software subscriptions ($906M in 2024) and other services; less diversified |
| Profitability | Solid profitability with net margin 21.7%, ROE 60.8%, ROIC 10.9% | Data unavailable; profitability metrics missing |
| Innovation | Significant investment in cloud infrastructure and software development | Limited data; growth in software subscriptions indicates some innovation |
| Global presence | Extensive global operations, serving a wide range of industries worldwide | Mainly US-focused with smaller scale operations |
| Market Share | Strong market share in enterprise software and cloud solutions | Smaller niche player in software subscription market |
Oracle’s diversified business model and strong profitability stand out despite a slightly unfavorable trend in ROIC. CCCS shows promising growth in software subscriptions but lacks comprehensive data for a full assessment. Investors should weigh Oracle’s scale and global reach against CCCS’s niche focus and data limitations.
Risk Analysis
Below is a comparative table outlining key risk factors for Oracle Corporation (ORCL) and CCC Intelligent Solutions Holdings Inc. (CCCS) for the year 2025.
| Metric | Oracle Corporation (ORCL) | CCC Intelligent Solutions (CCCS) |
|---|---|---|
| Market Risk | High beta at 1.65 implies elevated volatility relative to the market. | Lower beta at 0.72 suggests less sensitivity to market swings. |
| Debt level | High leverage: Debt-to-Equity ratio unfavorable at 5.09; Debt-to-Assets 62%. | Data unavailable, but smaller size and lower leverage typical for mid-cap tech. |
| Regulatory Risk | Moderate, typical for global tech firms with cloud and software services. | Moderate, focused on insurance tech sector; less exposed to broad tech regulation. |
| Operational Risk | Large scale with 159K employees; complexity could increase operational challenges. | Smaller scale (2.3K employees) lowers operational complexity but limits resources. |
| Environmental Risk | Moderate, primarily from data centers and hardware production footprint. | Low to moderate; mainly cloud-based services with limited physical footprint. |
| Geopolitical Risk | Moderate, with global operations subject to trade tensions and data privacy laws. | Lower, mostly US-focused with limited international exposure. |
Oracle’s most impactful risks are its high leverage and market volatility, which may pressure financial stability despite strong profitability. CCCS lacks detailed financial data but shows lower market risk and leverage, though with weaker financial health scores indicating potential distress. Both firms fall into a “grey zone” for bankruptcy risk, with Oracle’s Altman Z-score at 2.43 and CCCS at 2.18. Investors should weigh Oracle’s size and profitability against its debt burden, while CCCS’s smaller scale and weaker scores suggest higher operational and financial risks.
Which Stock to Choose?
Oracle Corporation (ORCL) shows a favorable income evolution with 8.38% revenue growth in 2025 and strong profitability metrics, including a 21.68% net margin and 60.84% ROE. However, its financial ratios are mixed, with several unfavorable indicators like a high debt-to-equity ratio of 5.09 and low liquidity ratios, resulting in an overall unfavorable ratio evaluation despite a very favorable B rating.
CCC Intelligent Solutions Holdings Inc. (CCCS) presents favorable income statement growth with 9.05% revenue growth and significant improvements in net margin and EPS over 2024. However, detailed financial ratios and ratings are missing, and the company’s Altman Z-Score indicates a moderate risk with a grey zone status, while its Piotroski score is very weak at 3, reflecting weaker financial strength.
Investors seeking companies with strong profitability and established rating structures might view Oracle’s profile as more favorable, whereas those focused on high-growth potential despite limited financial data might see CCC Intelligent Solutions as an option to watch. The choice could depend on whether one prioritizes proven financial metrics or growth trajectory amid uncertainties.
Disclaimer: Investment carries a risk of loss of initial capital. The past performance is not a reliable indicator of future results. Be sure to understand risks before making an investment decision.
Go Further
I encourage you to read the complete analyses of Oracle Corporation and CCC Intelligent Solutions Holdings Inc. to enhance your investment decisions: