In the rapidly evolving technology sector, Nutanix, Inc. (NTNX) and CCC Intelligent Solutions Holdings Inc. (CCCS) stand out as innovative players in software infrastructure. Nutanix focuses on enterprise cloud platforms and hybrid cloud orchestration, while CCC specializes in AI-driven solutions for the insurance economy. Their overlapping emphasis on cloud and software innovation makes them compelling candidates for comparison. Let’s explore which company offers the most promising investment opportunity in 2026.
Table of contents
Companies Overview
I will begin the comparison between Nutanix and CCC Intelligent Solutions by providing an overview of these two companies and their main differences.
Nutanix Overview
Nutanix, Inc. provides an enterprise cloud platform globally, including North America, Europe, and Asia Pacific. Its offerings focus on virtualization, enterprise storage, networking visualization, and cloud-native operations through products like Acropolis, Prism Pro, and Nutanix Karbon. The company serves diverse industries such as automotive, healthcare, and telecommunications, positioning itself as a comprehensive hybrid cloud orchestration provider headquartered in San Jose, California.
CCC Intelligent Solutions Overview
CCC Intelligent Solutions Holdings Inc. delivers cloud and AI-driven software solutions tailored to the property and casualty insurance economy. Its SaaS platform supports critical workflows and commerce connectivity for insurers, repairers, and automotive manufacturers. Founded in 1980 and based in Chicago, Illinois, CCC focuses on insurance and repair ecosystems with products like CCC Insurance solutions and CCC Repair workflow, serving a specialized market within the technology sector.
Key similarities and differences
Both Nutanix and CCC operate in the software infrastructure sector, leveraging cloud technology to serve their respective markets. Nutanix targets a broad range of industries with a focus on enterprise cloud and hybrid cloud orchestration solutions, while CCC specializes in AI-powered SaaS for the insurance economy. Their business models differ primarily in target customers and application areas, with Nutanix emphasizing virtualization and cloud management, and CCC concentrating on digitizing insurance-related workflows.
Income Statement Comparison
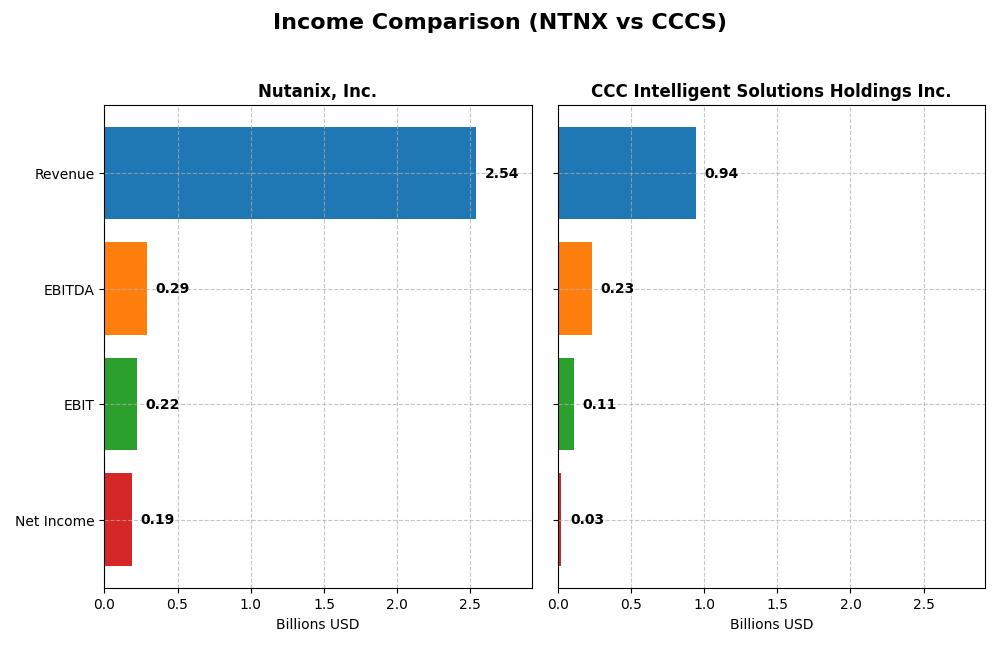
The table below summarizes the most recent full fiscal year income statement metrics for Nutanix, Inc. and CCC Intelligent Solutions Holdings Inc., providing a side-by-side financial snapshot.
| Metric | Nutanix, Inc. (NTNX) | CCC Intelligent Solutions Holdings Inc. (CCCS) |
|---|---|---|
| Market Cap | 12.4B | 5.6B |
| Revenue | 2.54B | 945M |
| EBITDA | 293M | 233M |
| EBIT | 220M | 109M |
| Net Income | 188M | 26M |
| EPS | 0.7 | 0.043 |
| Fiscal Year | 2025 | 2024 |
Income Statement Interpretations
Nutanix, Inc.
Nutanix showed strong growth in revenue, rising from $1.39B in 2021 to $2.54B in 2025, with net income turning positive in the last two years after several losses. Margins improved significantly, with a gross margin at 86.81% and a net margin of 7.42% in 2025. The latest year saw an 18.1% revenue increase and a 228% jump in net margin, indicating robust operational improvement.
CCC Intelligent Solutions Holdings Inc.
CCC Intelligent Solutions posted steady revenue growth from $633M in 2020 to $945M in 2024, returning to profitability after losses in 2021 and 2023. The company maintains a favorable gross margin of 75.55% and an EBIT margin of 11.53%. In 2024, net income improved by 126%, reflecting enhanced margin management despite a moderate net margin of 2.77%.
Which one has the stronger fundamentals?
Both companies show favorable income statement trends, with Nutanix demonstrating higher revenue growth (82% vs. 49%) and stronger margins, particularly net margin expansion. CCC benefits from consistent EBIT margins and improving net income growth (255% overall). Nutanix’s lower interest expense and higher gross margin provide an edge, but CCC’s operating income recovery is noteworthy. Overall, Nutanix exhibits a more pronounced margin and profitability improvement.
Financial Ratios Comparison
The table below presents a side-by-side comparison of key financial ratios for Nutanix, Inc. (NTNX) and CCC Intelligent Solutions Holdings Inc. (CCCS) based on their most recent fiscal year data.
| Ratios | Nutanix, Inc. (2025) | CCC Intelligent Solutions Holdings Inc. (2024) |
|---|---|---|
| ROE | -27.1% | 1.31% |
| ROIC | 8.11% | 1.86% |
| P/E | 106.7 | 274.0 |
| P/B | -28.95 | 3.59 |
| Current Ratio | 1.72 | 3.65 |
| Quick Ratio | 1.72 | 3.65 |
| D/E (Debt-to-Equity) | -2.14 | 0.42 |
| Debt-to-Assets | 45.2% | 26.7% |
| Interest Coverage | 8.75 | 1.24 |
| Asset Turnover | 0.77 | 0.30 |
| Fixed Asset Turnover | 9.15 | 4.68 |
| Payout Ratio | 0 | 0 |
| Dividend Yield | 0 | 0 |
Interpretation of the Ratios
Nutanix, Inc.
Nutanix presents a mixed ratio profile with half of its key ratios favorable, including a strong current ratio of 1.72 and excellent interest coverage at 11.15, indicating solid liquidity and debt servicing ability. However, its negative ROE at -27.12% and high PE ratio of 106.74 highlight potential profitability concerns. The company does not pay dividends, reflecting a likely focus on reinvestment and growth rather than shareholder returns.
CCC Intelligent Solutions Holdings Inc.
No ratio or key financial metric data is available for CCC Intelligent Solutions Holdings Inc., limiting any meaningful analysis. The lack of dividend information and financial ratios restricts assessment of liquidity, profitability, and shareholder returns. This absence of data suggests caution in evaluating the company’s financial health or dividend policy at this time.
Which one has the best ratios?
Based on the available data, Nutanix shows a more comprehensive ratio profile with a balance of favorable liquidity and coverage ratios, despite some profitability weaknesses. CCC Intelligent Solutions lacks sufficient financial ratios for comparison, making Nutanix the only company with a detailed and somewhat favorable ratio evaluation in this instance.
Strategic Positioning
This section compares the strategic positioning of Nutanix and CCC Intelligent Solutions, focusing on market position, key segments, and exposure to technological disruption:
Nutanix, Inc. (NTNX)
- Positioned in enterprise cloud platform market with competition in virtualization and hybrid cloud services.
- Key segments include subscription software, professional services, and infrastructure products across diverse industries globally.
- Exposure to disruption via cloud automation, Kubernetes management, and hybrid cloud orchestration technologies.
CCC Intelligent Solutions Holdings Inc. (CCCS)
- Operates in property and casualty insurance software, facing competition in AI-enabled workflows and telematics.
- Focused on SaaS platforms serving insurance, repair, parts, automotive, and financial sectors primarily in insurance economy.
- Leverages AI, telematics, and hyperscale tech to digitize insurance workflows, representing a niche technological focus.
Nutanix vs CCC Intelligent Solutions Positioning
Nutanix adopts a diversified approach across multiple industries with broad cloud infrastructure offerings, while CCC concentrates on the insurance sector with AI-driven SaaS. Nutanix’s broad market reach contrasts with CCC’s focused ecosystem, presenting distinct strategic benefits and risks.
Which has the best competitive advantage?
Nutanix shows a very favorable moat with growing ROIC exceeding WACC, indicating durable competitive advantage and efficient capital use. Insufficient data prevents a MOAT evaluation for CCC Intelligent Solutions.
Stock Comparison
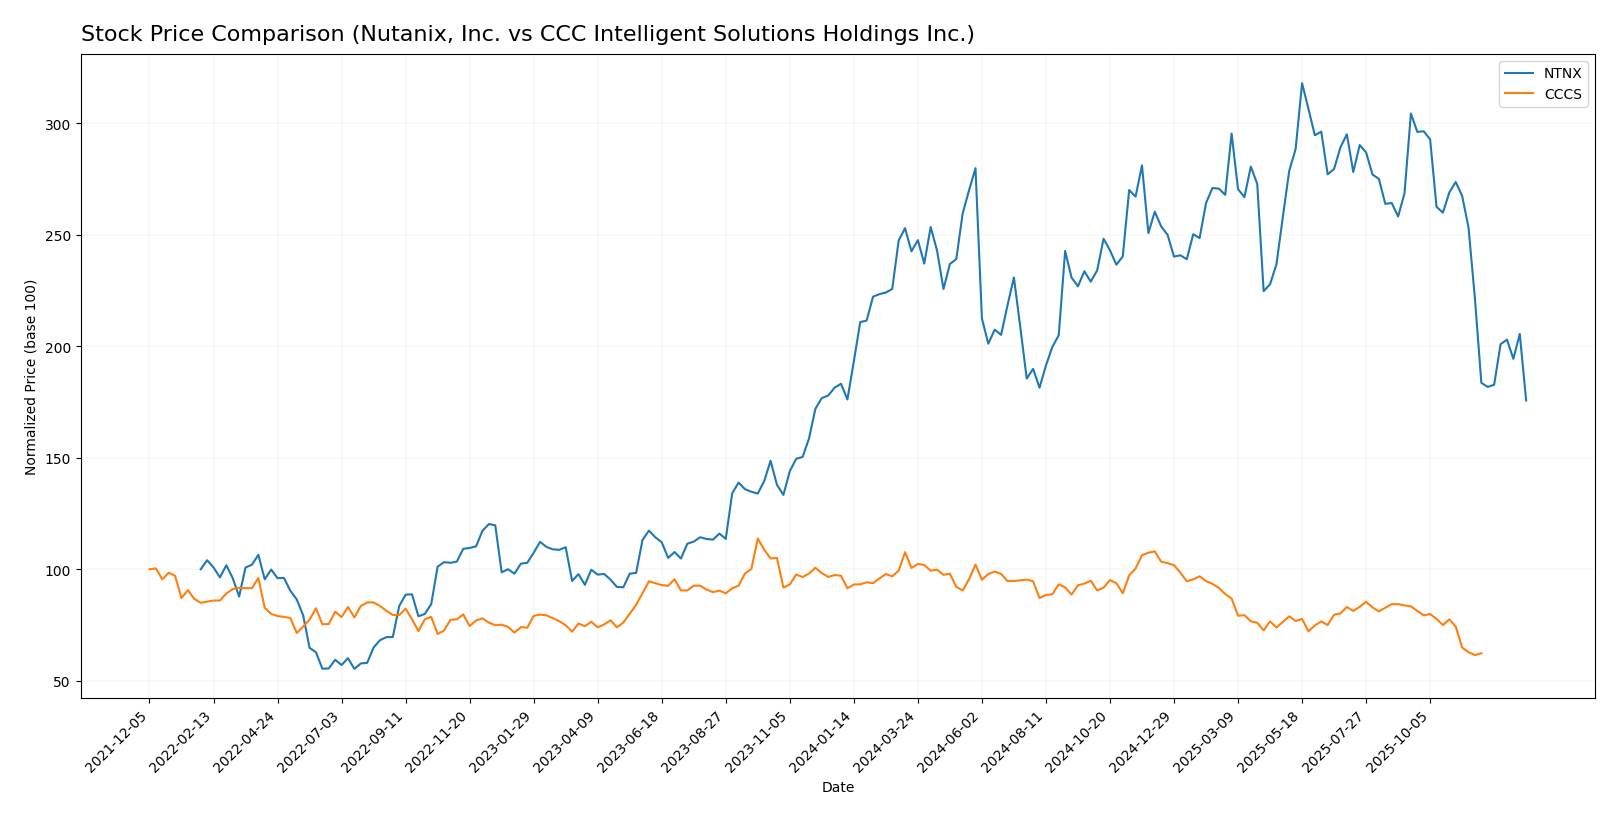
The stock prices of Nutanix, Inc. (NTNX) and CCC Intelligent Solutions Holdings Inc. (CCCS) have both experienced significant declines over the past year, with notable deceleration in their bearish trends and differing volatility profiles.
Trend Analysis
Nutanix, Inc. (NTNX) shows a bearish trend with a price decline of 22.16% over the past 12 months, accompanied by a deceleration in trend and a relatively high volatility (std dev 8.67). The stock’s price ranged between 45.74 and 82.77.
CCC Intelligent Solutions Holdings Inc. (CCCS) also displays a bearish trend with a price drop of 31.78% over the same period, showing deceleration and much lower volatility (std dev 1.24). The stock traded within a narrower range from 7.22 to 12.67.
Comparing both, NTNX delivered a smaller decline than CCCS, indicating a relatively better market performance despite both stocks trending downward.
Target Prices
Analysts provide a clear consensus on target prices for Nutanix, Inc. and CCC Intelligent Solutions Holdings Inc.
| Company | Target High | Target Low | Consensus |
|---|---|---|---|
| Nutanix, Inc. | 90 | 53 | 64.67 |
| CCC Intelligent Solutions | 11 | 11 | 11 |
The consensus target price for Nutanix is significantly above its current price of 45.74 USD, indicating potential upside. CCC’s consensus target at 11 USD also suggests room for price appreciation from its current 8.75 USD.
Analyst Opinions Comparison
This section compares analysts’ ratings and financial scores for Nutanix, Inc. and CCC Intelligent Solutions Holdings Inc.:
Rating Comparison
Nutanix Rating
- Rating: C+ with a “Very Favorable” evaluation.
- Discounted Cash Flow Score: 4, indicating favorable valuation based on future cash flows.
- ROE Score: 1, considered very unfavorable for equity profitability.
- ROA Score: 4, favorable asset utilization efficiency.
- Debt To Equity Score: 1, very unfavorable, indicating high financial risk.
- Overall Score: 2, moderate overall financial standing.
CCC Intelligent Solutions Rating
- No rating information available.
- No data available.
- No data available.
- No data available.
- No data available.
- No data available.
Which one is the best rated?
Based strictly on the data, Nutanix holds a C+ rating with several favorable scores but also some very unfavorable scores, while CCC Intelligent Solutions lacks any rating or score data for comparison. Nutanix is therefore the only rated company in this comparison.
Scores Comparison
Here is a comparison of the Altman Z-Score and Piotroski Score for Nutanix, Inc. and CCC Intelligent Solutions Holdings Inc.:
NTNX Scores
- Altman Z-Score: 1.48, indicating financial distress and high bankruptcy risk.
- Piotroski Score: 6, reflecting average financial strength and value potential.
CCCS Scores
- Altman Z-Score: 2.18, indicating moderate bankruptcy risk in the grey zone.
- Piotroski Score: 3, reflecting very weak financial strength and investment value.
Which company has the best scores?
Based on these scores, CCCS has a better Altman Z-Score, placing it in a safer financial zone than NTNX. However, NTNX has a significantly stronger Piotroski Score, indicating better overall financial health.
Grades Comparison
The following presents the recent grades assigned to Nutanix, Inc. and CCC Intelligent Solutions Holdings Inc.:
Nutanix, Inc. Grades
This table summarizes the latest grades from recognized grading companies for Nutanix, Inc.:
| Grading Company | Action | New Grade | Date |
|---|---|---|---|
| Barclays | Downgrade | Equal Weight | 2026-01-15 |
| Morgan Stanley | Downgrade | Equal Weight | 2026-01-12 |
| RBC Capital | Maintain | Outperform | 2026-01-05 |
| Goldman Sachs | Maintain | Buy | 2025-11-28 |
| JP Morgan | Maintain | Overweight | 2025-11-26 |
| Needham | Maintain | Buy | 2025-11-26 |
| Wells Fargo | Maintain | Equal Weight | 2025-11-26 |
| Morgan Stanley | Maintain | Overweight | 2025-11-26 |
| Keybanc | Maintain | Overweight | 2025-11-26 |
| Piper Sandler | Maintain | Overweight | 2025-11-26 |
Nutanix shows a generally positive rating with dominant buy and overweight grades despite recent downgrades to equal weight by two firms.
There are no reliable grades reported for CCC Intelligent Solutions Holdings Inc., indicating limited analyst coverage or unavailable data.
Which company has the best grades?
Nutanix, Inc. commands a stronger and more consistent buy-side consensus compared to CCC Intelligent Solutions Holdings Inc., which lacks recent reliable grades. This disparity may influence investor confidence and perceived risk between the two.
Strengths and Weaknesses
The table below compares the key strengths and weaknesses of Nutanix, Inc. (NTNX) and CCC Intelligent Solutions Holdings Inc. (CCCS) based on the most recent available data.
| Criterion | Nutanix, Inc. (NTNX) | CCC Intelligent Solutions (CCCS) |
|---|---|---|
| Diversification | Moderate: Strong subscription services; some product and professional services revenue | Moderate: Mainly software subscriptions with some other services |
| Profitability | Neutral net margin (7.42%) but unfavorable ROE (-27.12%) | Data unavailable for profitability assessment |
| Innovation | Very favorable economic moat with growing ROIC; invests in subscription tech | Data unavailable for innovation assessment |
| Global presence | Established global cloud and enterprise presence | Data unavailable for global presence |
| Market Share | Significant in cloud infrastructure and software markets | Data unavailable for market share |
Key takeaways: Nutanix shows a durable competitive advantage with increasing profitability and strong subscription revenues, though profitability ratios reveal some concerns. CCC Intelligent Solutions lacks sufficient public data for a thorough evaluation. Investors should exercise caution with CCC until more information is available.
Risk Analysis
Below is a comparative table outlining key risks for Nutanix, Inc. (NTNX) and CCC Intelligent Solutions Holdings Inc. (CCCS) based on the most recent 2025 data and qualitative factors.
| Metric | Nutanix, Inc. (NTNX) | CCC Intelligent Solutions Holdings Inc. (CCCS) |
|---|---|---|
| Market Risk | Moderate (Beta 0.49, price down 6% recently) | Moderate (Beta 0.72, price down 2.9%) |
| Debt Level | Moderate (Debt to assets 45%, favorable debt/equity ratio) | Unknown (data unavailable) |
| Regulatory Risk | Moderate (operates globally in tech, subject to data/privacy laws) | Moderate (insurance tech sector, regulatory scrutiny expected) |
| Operational Risk | Moderate (complex cloud infrastructure, virtualization) | Moderate (reliance on SaaS and AI workflows) |
| Environmental Risk | Low (software-focused with limited direct impact) | Low (software services, minimal environmental footprint) |
| Geopolitical Risk | Moderate (global operations vulnerable to geopolitical tensions) | Moderate (US-based but serving global insurance economy) |
The most likely and impactful risks for Nutanix include its moderate market volatility and operational complexity within the enterprise cloud market, alongside a distress-level Altman Z-score suggesting financial vulnerability. CCCS carries uncertainty due to limited financial data but faces moderate market and regulatory risks linked to its niche in insurance tech. Caution is advised, especially with Nutanix’s financial distress signals and high P/E valuation.
Which Stock to Choose?
Nutanix, Inc. (NTNX) shows a favorable income evolution with strong revenue and net income growth, supported by a favorable gross margin and net margin. Its financial ratios are slightly favorable overall, despite an unfavorable return on equity and high P/E ratio. The company maintains moderate debt with a favorable interest coverage and demonstrates a very favorable moat with ROIC exceeding WACC and a growing trend.
CCC Intelligent Solutions Holdings Inc. (CCCS) presents favorable income growth and solid gross and EBIT margins, with net margin and interest expense rated neutral. However, comprehensive financial ratio data is unavailable, and its scores reveal a grey zone Altman Z-Score and a very weak Piotroski Score, indicating weaker financial strength compared to NTNX.
For investors prioritizing a company with a durable competitive advantage and improving profitability, Nutanix might appear more favorable based on its rating and income performance. Conversely, those with a cautious approach could interpret CCC Intelligent Solutions’ limited data and financial scores as a signal to await more clarity before considering investment.
Disclaimer: Investment carries a risk of loss of initial capital. The past performance is not a reliable indicator of future results. Be sure to understand risks before making an investment decision.
Go Further
I encourage you to read the complete analyses of Nutanix, Inc. and CCC Intelligent Solutions Holdings Inc. to enhance your investment decisions: